Host Marriott 2004 Annual Report - Host Hotels & Resorts, Inc
Host Marriott 2004 Annual Report - Host Hotels & Resorts, Inc
Host Marriott 2004 Annual Report - Host Hotels & Resorts, Inc

Create successful ePaper yourself
Turn your PDF publications into a flip-book with our unique Google optimized e-Paper software.
een reclassified to discontinued operations. The business<br />
interruption proceeds received, net of expenses, for the New<br />
York <strong>Marriott</strong> Financial Center hotel are included in rooms<br />
revenue from continuing operations.<br />
COMPARABLE HOTEL OPERATING STATISTICS<br />
We present certain operating statistics (i.e., RevPAR, average<br />
daily rate and average occupancy) and operating results (revenues,<br />
expenses and adjusted operating profit) for the periods<br />
included in this report on a comparable hotel basis. We<br />
define our comparable hotels as full-service properties (i)<br />
that are owned or leased by us and the operations of which<br />
are included in our consolidated results, whether as continuing<br />
operations or discontinued operations, for the entirety of<br />
the reporting periods being compared, and (ii) that have not<br />
sustained substantial property damage or undergone largescale<br />
capital projects during the reporting periods being<br />
compared. Of the 111 full-service hotels that we owned on<br />
December 31, <strong>2004</strong>, 103 have been classified as comparable<br />
hotels for <strong>2004</strong> versus 2003 comparisons. The operating<br />
results of the following eight hotels that we owned as of<br />
December 31, <strong>2004</strong> are excluded from comparable hotel<br />
results for these periods:<br />
• The JW <strong>Marriott</strong>, Washington, D.C. (consolidated in our<br />
financial statements beginning in the second quarter of 2003);<br />
• The Hyatt Regency Maui Resort and Spa (acquired in<br />
November 2003);<br />
• The Memphis <strong>Marriott</strong> (construction of a 200-room<br />
expansion started in 2003 and completed in <strong>2004</strong>);<br />
• The Embassy Suites Chicago Downtown-Lakefront Hotel<br />
(acquired in April <strong>2004</strong>);<br />
• The Fairmont Kea Lani Maui (acquired in July <strong>2004</strong>);<br />
• The Newport Beach <strong>Marriott</strong> Hotel (major renovation<br />
started in July <strong>2004</strong>);<br />
• The Mountain Shadows Resort Hotel (temporarily closed<br />
in September <strong>2004</strong>); and<br />
• The Scottsdale <strong>Marriott</strong> at McDowell Mountains<br />
(acquired in September <strong>2004</strong>).<br />
In addition, the operating results of the 17 hotels we<br />
disposed of in <strong>2004</strong> and 2003 are also not included in<br />
comparable hotel results for the periods presented herein.<br />
Moreover, because these statistics and operating results are for<br />
our full-service hotel properties, they exclude results for our<br />
non-hotel properties and leased limited-service hotels.<br />
We evaluate the operating performance of our comparable<br />
hotels based on both geographic region and property type. These<br />
divisions are generally consistent with industry data provided by<br />
hospitality research firms such as Smith Travel Research.<br />
Geographic regions consist of the following (only states in<br />
which we own hotels are listed):<br />
• Pacific—California, Hawaii, Oregon and Washington;<br />
• Mountain—Arizona and Colorado;<br />
• North Central—Illinois, Indiana, Michigan, Minnesota,<br />
Missouri and Ohio;<br />
• South Central—Louisiana, Tennessee and Texas;<br />
• New England—Connecticut, Massachusetts and<br />
New Hampshire;<br />
• Mid-Atlantic—Pennsylvania, New Jersey and New York;<br />
• DC Metro—Maryland, Virginia and Washington, D.C.;<br />
• Atlanta— Georgia and North Carolina;<br />
• Florida—Florida; and<br />
• International—Canada and Mexico.<br />
Property types consist of the following:<br />
• Urban—<strong>Hotels</strong> located in central business districts of major<br />
cities. This includes most of our large convention center<br />
properties, suburban markets or edge cities located outside<br />
the urban core in larger metropolitan areas;<br />
• Suburban—<strong>Hotels</strong> located in office parks or smaller<br />
secondary markets;<br />
• Resort/conference—<strong>Hotels</strong> in tourist locations such as<br />
Florida, Hawaii and Southern California; and<br />
• Airport—<strong>Hotels</strong> located at or near airports.<br />
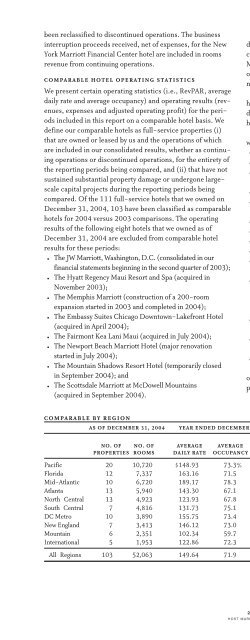
The following table sets forth performance information for<br />
our comparable full-service hotels by geographic region and<br />
property type as of December 31, <strong>2004</strong> and 2003:<br />
COMPARABLE BY REGION<br />
AS OF DECEMBER 31, <strong>2004</strong> YEAR ENDED DECEMBER 31, <strong>2004</strong> YEAR ENDED DECEMBER 31, 2003<br />
PERCENT<br />
NO. OF NO. OF AVERAGE AVERAGE AVERAGE AVERAGE CHANGE IN<br />
PROPERTIES ROOMS DAILY RATE OCCUPANCY REVPAR DAILY RATE OCCUPANCY REVPAR REVPAR<br />
Pacific 20 10,720 $148.93 73.3% $109.10 $148.71 67.9% $101.03 8.0%<br />
Florida 12 7,337 163.16 71.5 116.69 158.40 68.8 109.00 7.1<br />
Mid-Atlantic 10 6,720 189.17 78.3 148.19 180.11 74.3 133.85 10.7<br />
Atlanta 13 5,940 143.30 67.1 96.15 138.16 65.6 90.67 6.0<br />
North Central 13 4,923 123.93 67.8 84.06 123.52 66.6 82.28 2.2<br />
South Central 7 4,816 131.73 75.1 98.87 131.46 75.9 99.79 (0.9)<br />
DC Metro 10 3,890 155.75 73.4 114.29 148.07 70.7 104.65 9.2<br />
New England 7 3,413 146.12 73.0 106.72 142.32 67.5 96.11 11.0<br />
Mountain 6 2,351 102.34 59.7 61.10 97.56 61.0 59.52 2.7<br />
International 5 1,953 122.86 72.3 88.87 114.67 66.0 75.64 17.5<br />
All Regions 103 52,063 149.64 71.9 107.66 145.42 69.0 100.35 7.3<br />
24<br />
HOST MARRIOTT <strong>2004</strong>