Host Marriott 2004 Annual Report - Host Hotels & Resorts, Inc
Host Marriott 2004 Annual Report - Host Hotels & Resorts, Inc
Host Marriott 2004 Annual Report - Host Hotels & Resorts, Inc
Create successful ePaper yourself
Turn your PDF publications into a flip-book with our unique Google optimized e-Paper software.
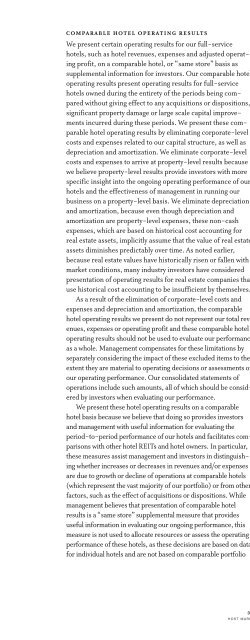
COMPARABLE HOTEL OPERATING RESULTS<br />
We present certain operating results for our full-service<br />
hotels, such as hotel revenues, expenses and adjusted operating<br />
profit, on a comparable hotel, or “same store” basis as<br />
supplemental information for investors. Our comparable hotel<br />
operating results present operating results for full-service<br />
hotels owned during the entirety of the periods being compared<br />
without giving effect to any acquisitions or dispositions,<br />
significant property damage or large scale capital improvements<br />
incurred during these periods. We present these comparable<br />
hotel operating results by eliminating corporate-level<br />
costs and expenses related to our capital structure, as well as<br />
depreciation and amortization. We eliminate corporate-level<br />
costs and expenses to arrive at property-level results because<br />
we believe property-level results provide investors with more<br />
specific insight into the ongoing operating performance of our<br />
hotels and the effectiveness of management in running our<br />
business on a property-level basis. We eliminate depreciation<br />
and amortization, because even though depreciation and<br />
amortization are property-level expenses, these non-cash<br />
expenses, which are based on historical cost accounting for<br />
real estate assets, implicitly assume that the value of real estate<br />
assets diminishes predictably over time. As noted earlier,<br />
because real estate values have historically risen or fallen with<br />
market conditions, many industry investors have considered<br />
presentation of operating results for real estate companies that<br />
use historical cost accounting to be insufficient by themselves.<br />
As a result of the elimination of corporate-level costs and<br />
expenses and depreciation and amortization, the comparable<br />
hotel operating results we present do not represent our total revenues,<br />
expenses or operating profit and these comparable hotel<br />
operating results should not be used to evaluate our performance<br />
as a whole. Management compensates for these limitations by<br />
separately considering the impact of these excluded items to the<br />
extent they are material to operating decisions or assessments of<br />
our operating performance. Our consolidated statements of<br />
operations include such amounts, all of which should be considered<br />
by investors when evaluating our performance.<br />
We present these hotel operating results on a comparable<br />
hotel basis because we believe that doing so provides investors<br />
and management with useful information for evaluating the<br />
period-to-period performance of our hotels and facilitates comparisons<br />
with other hotel REITs and hotel owners. In particular,<br />
these measures assist management and investors in distinguishing<br />
whether increases or decreases in revenues and/or expenses<br />
are due to growth or decline of operations at comparable hotels<br />
(which represent the vast majority of our portfolio) or from other<br />
factors, such as the effect of acquisitions or dispositions. While<br />
management believes that presentation of comparable hotel<br />
results is a “same store” supplemental measure that provides<br />
useful information in evaluating our ongoing performance, this<br />
measure is not used to allocate resources or assess the operating<br />
performance of these hotels, as these decisions are based on data<br />
for individual hotels and are not based on comparable portfolio<br />
hotel results. For these reasons, we believe that comparable hotel<br />
operating results, when combined with the presentation of GAAP<br />
operating profit, revenues and expenses, provide useful information<br />
to investors and management.<br />
The following table presents certain operating results<br />
and statistics for our comparable hotels for the periods<br />
presented herein:<br />
COMPARABLE HOTEL RESULTS<br />
YEAR ENDED<br />
DECEMBER 31,<br />
(IN MILLIONS, EXCEPT HOTEL STATISTICS) <strong>2004</strong> 2003<br />
Number of hotels 103 103<br />
Number of rooms 52,063 52,183<br />
Percent change in Comparable Hotel RevPAR 7.3% —<br />
Comparable hotel sales<br />
Room $2,045 $1,907<br />
Food and beverage 1,102 1,043<br />
Other 226 220<br />
Comparable hotel sales (1) 3,373 3,170<br />
Comparable hotel expenses<br />
Room 515 483<br />
Food and beverage 823 784<br />
Other 141 134<br />
Management fees, ground rent and other costs 1,140 1,091<br />
Comparable hotel expenses (2) 2,619 2,492<br />
Comparable hotel adjusted operating profit 754 678<br />
Non-comparable hotel results, net (3) 83 26<br />
Comparable hotels classified as held for sale (12) (11)<br />
Office building and limited service properties, net (4) 2 1<br />
Other income 1 12<br />
Depreciation and amortization (354) (347)<br />
Corporate and other expenses (67) (60)<br />
(1)<br />
Operating profit $ 407 $ 299<br />
The reconciliation of total revenues per the consolidated statements of<br />
operations to the comparable hotel sales is as follows:<br />
YEAR ENDED<br />
DECEMBER 31,<br />
(IN MILLIONS) <strong>2004</strong> 2003<br />
Revenues per the consolidated statements<br />
of operations $3,640 $3,288<br />
Revenues of hotels held for sale 70 66<br />
Non-comparable hotel sales (292) (137)<br />
Hotel sales for the property for which we record<br />
rental income, net 47 46<br />
Rental income for office buildings and<br />
limited service hotels (80) (75)<br />
Other income (1) (12)<br />
Adjustment for hotel sales for comparable hotels<br />
to reflect <strong>Marriott</strong>’s fiscal year for <strong>Marriott</strong>managed<br />
hotels (11) (6)<br />
Comparable hotel sales $3,373 $3,170<br />
39<br />
HOST MARRIOTT <strong>2004</strong>


