A complete gradient clustering algorithm formed with kernel estimators
A complete gradient clustering algorithm formed with kernel estimators
A complete gradient clustering algorithm formed with kernel estimators

Create successful ePaper yourself
Turn your PDF publications into a flip-book with our unique Google optimized e-Paper software.
128 P. Kulczycki and M. Charytanowicz<br />
The “list of clusters” so defined contains all clusters<br />
marked out in the above procedure. Therefore it becomes<br />
the <strong>complete</strong> <strong>gradient</strong> <strong>clustering</strong> <strong>algorithm</strong> in the basic<br />
form—its possible modifications and their influence on<br />
the obtained results will be presented in the next section.<br />
3.4. Analysis of the influence of the values of parameters<br />
on the obtained results. It is worth repeating that<br />
the presented <strong>clustering</strong> <strong>algorithm</strong> did not require a preliminary,<br />
often arbitrary in practice, assumption concerning<br />
the number of clusters—their size depending solely<br />
on the internal structure of data, given as the set (1). In<br />
the application of the <strong>complete</strong> <strong>gradient</strong> <strong>clustering</strong> <strong>algorithm</strong><br />
in its basic form, the values of the parameters used<br />
are effectively calculated taking optimization reasons into<br />
account. However, optionally—if the researcher makes<br />
a decision—by an appropriate change in values of <strong>kernel</strong><br />
estimator parameters, it is possible to influence the size<br />
of the number of clusters, and also the proportion of their<br />
appearance in dense areas in relation to sparse regions of<br />
elements in this set.<br />
In the example presented now, the elements of the<br />
set (1) have been generated pseudorandomly, for a distribution<br />
selected specially to highlight the above aspects.<br />
As mentioned in Section 2, too small a value of the<br />
smoothing parameter h results in the appearance of too<br />
many local extremes of the <strong>kernel</strong> estimator, while too<br />
great a value causes its excessive smoothing. In this situation<br />
lowering the value of the parameter h <strong>with</strong> respect to<br />
that obtained by procedures based on the criterion of the<br />
mean integrated square error creates, as a consequence, an<br />
increase in the number of clusters. At the same time, an<br />
increase in the smoothing parameter value results in fewer<br />
clusters. It should be underlined that in both cases, despite<br />
having an influence on the size of the cluster number,<br />
their exact number will still depend solely on the internal<br />
structure of data. Based on research carried out, one can<br />
recommend a change in the value of the smoothing parameter<br />
by between −25% and +50%. Outside this range,<br />
the obtained results require individual verification.<br />
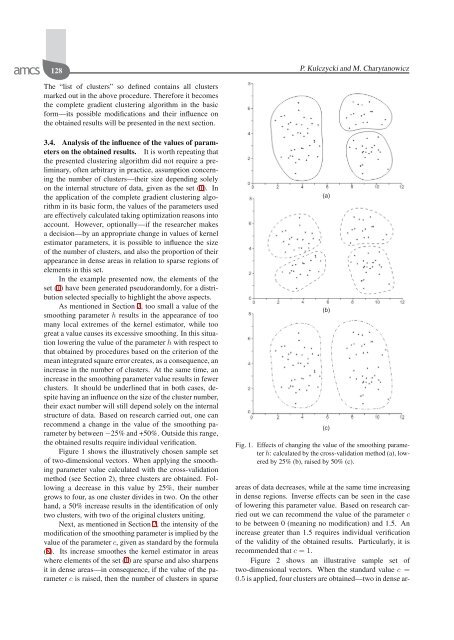
Figure 1 shows the illustratively chosen sample set<br />
of two-dimensional vectors. When applying the smoothing<br />
parameter value calculated <strong>with</strong> the cross-validation<br />
method (see Section 2), three clusters are obtained. Following<br />
a decrease in this value by 25%, their number<br />
grows to four, as one cluster divides in two. On the other<br />
hand, a 50% increase results in the identification of only<br />
two clusters, <strong>with</strong> two of the original clusters uniting.<br />
Next, as mentioned in Section 2, the intensity of the<br />
modification of the smoothing parameter is implied by the<br />
value of the parameter c, given as standard by the formula<br />
(8). Its increase smoothes the <strong>kernel</strong> estimator in areas<br />
where elements of the set (1) are sparse and also sharpens<br />
it in dense areas—in consequence, if the value of the parameter<br />
c is raised, then the number of clusters in sparse<br />
Fig. 1. Effects of changing the value of the smoothing parameter<br />
h: calculated by the cross-validation method (a), lowered<br />
by 25% (b), raised by 50% (c).<br />
areas of data decreases, while at the same time increasing<br />
in dense regions. Inverse effects can be seen in the case<br />
of lowering this parameter value. Based on research carried<br />
out we can recommend the value of the parameter c<br />
to be between 0 (meaning no modification) and 1.5. An<br />
increase greater than 1.5 requires individual verification<br />
of the validity of the obtained results. Particularly, it is<br />
recommended that c =1.<br />
Figure 2 shows an illustrative sample set of<br />
two-dimensional vectors. When the standard value c =<br />
0.5 is applied, four clusters are obtained—two in dense ar-