A complete gradient clustering algorithm formed with kernel estimators
A complete gradient clustering algorithm formed with kernel estimators
A complete gradient clustering algorithm formed with kernel estimators

You also want an ePaper? Increase the reach of your titles
YUMPU automatically turns print PDFs into web optimized ePapers that Google loves.
Int. J. Appl. Math. Comput. Sci., 2010, Vol. 20, No. 1, 123–134<br />
DOI: 10.2478/v10006-010-0009-3<br />
A COMPLETE GRADIENT CLUSTERING ALGORITHM<br />
FORMED WITH KERNEL ESTIMATORS<br />
PIOTR KULCZYCKI ∗,∗∗ ,<br />
MAŁGORZATA CHARYTANOWICZ ∗,∗∗∗<br />
∗ Systems Research Institute, Center for Stochastic Data Analysis Methods<br />
Polish Academy of Sciences, ul. Newelska 6, 01–447 Warsaw, Poland<br />
e-mail: {kulczycki,malgorzata.charytanowicz}@ibspan.waw.pl<br />
∗∗ Department of Automatic Control and Information Technology, Faculty of Electrical and Computer Engineering<br />
Cracow University of Technology, ul. Warszawska 24, 31–155 Cracow, Poland<br />
e-mail: kulczycki@pk.edu.pl<br />
∗∗∗ Institute of Mathematics and Computer Science<br />
John Paul II Catholic University of Lublin, ul. Konstantynów 1 H, 20–708 Lublin, Poland<br />
e-mail: mchmat@kul.lublin.pl<br />
The aim of this paper is to provide a <strong>gradient</strong> <strong>clustering</strong> <strong>algorithm</strong> in its <strong>complete</strong> form, suitable for direct use <strong>with</strong>out requiring<br />
a deeper statistical knowledge. The values of all parameters are effectively calculated using optimizing procedures.<br />
Moreover, an illustrative analysis of the meaning of particular parameters is shown, followed by the effects resulting from<br />
possible modifications <strong>with</strong> respect to their primarily assigned optimal values. The proposed <strong>algorithm</strong> does not demand<br />
strict assumptions regarding the desired number of clusters, which allows the obtained number to be better suited to a real<br />
data structure. Moreover, a feature specific to it is the possibility to influence the proportion between the number of clusters<br />
in areas where data elements are dense as opposed to their sparse regions. Finally, the <strong>algorithm</strong>—by the detection of oneelement<br />
clusters—allows identifying atypical elements, which enables their elimination or possible designation to bigger<br />
clusters, thus increasing the homogeneity of the data set.<br />
Keywords: data analysis and mining, <strong>clustering</strong>, <strong>gradient</strong> procedures, nonparametric statistical methods, <strong>kernel</strong> <strong>estimators</strong>,<br />
numerical calculations.<br />
1. Introduction<br />
Consider an m-element set of n-dimensional vectors:<br />
x 1 ,x 2 ,...,x m ∈ R n . (1)<br />
Generally, the task of <strong>clustering</strong> relies upon the division<br />
of the above data set into subsets (clusters), each containing<br />
elements similar to one another, yet significantly<br />
differing from elements of other subsets (for a basic notion,<br />
see (Anderberg, 1973; Jain and Dubes, 1988; Everitt<br />
et al., 2001)). Such a comfortable, intuitively obvious definition<br />
is equally awkward both from a theoretical and a<br />
practical point of view, as it contains visible and hidden<br />
imprecisions. Above all there is no unambiguous definition<br />
of what denotes “similarity” (and, consequently, “difference”)<br />
of elements, nor is it clear if the number of clusters<br />
is to be arbitrarily assumed or defined as a result of<br />
the structure of real data (1) itself, or how to measure the<br />
quality of the divisions imposed. If it is also taken into account<br />
that the mathematical apparatus does not have a natural<br />
methodology for solving such problems, the existence<br />
becomes obvious of an excessive number of heuristic iterative<br />
procedures, each of them characterized by different<br />
advantages and disadvantages, as well as certain properties<br />
which may be of benefit in some problems and of no<br />
profit in others.<br />
Another kind of difficulty in the use of such heuristic<br />
iterative procedures is that many of these methods were<br />
developed 30–40 years ago, when computer access was<br />
the privilege of a selected group of specialists, in possession<br />
of deep knowledge necessary for comprehensive<br />
analysis of the obtained results. In many cases, a lot<br />
of conditions and parameters—among others such fundamentals<br />
as a stop criterion or the assumed number of
124 P. Kulczycki and M. Charytanowicz<br />
clusters—are left for the user to decide. A basis for the<br />
analysis of collected results was often presented by viewing<br />
their graphical representation, not easy even when using<br />
specialized visualization methods, particularly in the<br />
multidimensional case when n>2.<br />
The above is now in <strong>complete</strong> contradiction to the<br />
demands of the majority of contemporary users of these<br />
methods. The availability of computer technology means<br />
that they often do not have specialist knowledge for comprehensive<br />
analysis. The best solution for these users<br />
is to provide a <strong>complete</strong> <strong>algorithm</strong>, taking into account<br />
“automatic” procedures for fixing all quantities appearing<br />
there, both functions and parameters, as well as clear<br />
information concerning their influence on the obtained<br />
results and—in consequence—advantages and disadvantages<br />
arising from their potential changes.<br />
In the now classic paper (Fukunaga and Hostetler,<br />
1975), the authors formulated a natural idea of <strong>clustering</strong>,<br />
employing notable possibilities entering into widespread<br />
use of statistical <strong>kernel</strong> <strong>estimators</strong> at that time, today the<br />
main method of nonparametric estimation. The basis of<br />
the above concept is treating the data set (1) as a random<br />
sample obtained from an n-dimensional random variable,<br />
calculating the <strong>kernel</strong> estimator of the density of its distribution,<br />
and making the clear assumption that particular<br />
clusters correspond to modes (local maxima) of the estimator,<br />
and so “valleys” of the density function constitute<br />
a bordering of such clusters. The presented method was<br />
formulated as a general idea only, leaving the details—as<br />
was the generally accepted behavior of that time—to the<br />
painstaking analysis of the user. Its naturalness and clarity<br />
of interpretation allowed the method to be applied in<br />
many varied specialist tasks such as tracking, image segmentation,<br />
information fusion, and video processing (see<br />
(Zhang et al., 2005) for a list of examples), interesting mutations<br />
and supplements (see, e.g., (Yang et al., 2003) or<br />
(Cheng, 1995)), and even unwitting repetition of the same<br />
idea (Wang et al., 2004).<br />
The aim of this paper is to present <strong>gradient</strong> <strong>clustering</strong><br />
<strong>algorithm</strong> based on Fukunaga and Hostetler’s concept in<br />
its <strong>complete</strong> form, suitable for direct use <strong>with</strong>out requiring<br />
users to have a deeper statistical knowledge or to conduct<br />
laborious research. All parameters appearing here can be<br />
effectively calculated using convenient numerical procedures<br />
based on optimization criteria. Moreover, making<br />
use of a near-intuitive interpretation of the concept of the<br />
<strong>gradient</strong> <strong>algorithm</strong> itself, as well as its theoretical base—<br />
<strong>kernel</strong> <strong>estimators</strong>, an illustrative analysis of the significance<br />
of particular parameters will be given, and the effects<br />
achieved through their possible change <strong>with</strong> respect<br />
to the above mentioned optimal values, depending on conditions<br />
of the problem in question and user preferences.<br />
The main feature of the <strong>algorithm</strong> under research is<br />
that it does not demand strict assumptions regarding the<br />
desired number of clusters, which allows the obtained<br />
number to be better suited to a real data structure. In the<br />
paper, the parameter directly responsible for the number<br />
of clusters will be indicated. At a preliminary stage its<br />
value can be calculated effectively using optimization criteria.<br />
It will also be shown how possible changes to this<br />
value (which may be per<strong>formed</strong> but are not necessary) influence<br />
the increase or decrease in the number of clusters,<br />
although <strong>with</strong>out defining their exact number. Moreover,<br />
the next parameter is indicated, and its value will influence<br />
the proportion between the number of clusters in dense<br />
and sparse areas of data set elements. Here also its value<br />
can be assumed based on optimization ground, or possibly<br />
subject to modifications <strong>with</strong> the goal of increasing<br />
the number of clusters in dense areas of data set elements<br />
while simultaneously reducing or even eliminating them<br />
from sparse regions, or vice-versa. This possibility is particularly<br />
worth underlining as practically non-existent in<br />
other <strong>clustering</strong> procedures.<br />
By its nature, the <strong>algorithm</strong> commonly creates oneelement<br />
clusters, which can be treated as atypical elements<br />
(Barnett and Lewis, 1994) in a given configuration<br />
of clusters. This could be the basis for eliminating elements<br />
which create them in order to increase the homogeneity<br />
of the data set. However, by the above mentioned<br />
modification of the appropriate parameter, leading to a reduction<br />
in the number of clusters in sparse areas, these<br />
elements may also be assigned to the closest clusters.<br />
Moreover, the appropriate relation between the above<br />
mentioned two parameters permits a reduction or even<br />
elimination of clusters in sparse areas, usually <strong>with</strong>out influencing<br />
the number of clusters in dense areas of data set<br />
elements.<br />
The <strong>complete</strong> <strong>gradient</strong> <strong>clustering</strong> <strong>algorithm</strong> proposed<br />
in this paper has, of course, its application limits, mainly<br />
that it is not intended for tasks where the desired number<br />
of clusters is strictly defined. The calculation time becomes<br />
relatively great, which may cause difficulties <strong>with</strong><br />
its use in tasks carried out in real time. For multidimensional<br />
problems, i.e., when n>5, it might prove necessary<br />
to apply first procedures for the reduction of dimensionality.<br />
Typical concepts are described in the book<br />
(Larose, 2006, Chapter 1) and those dedicated to <strong>algorithm</strong>s<br />
of data analysis and mining using the <strong>kernel</strong> <strong>estimators</strong><br />
methodology, based on the simulated annealing<br />
method, are presented in (Kulczycki and Łukasik, 2009)<br />
and will soon be the subject of further research.<br />
A preliminary version of this article was presented as<br />
(Kulczycki and Charytanowicz, 2008).<br />
2. Statistical <strong>kernel</strong> <strong>estimators</strong><br />
Consider an n-dimensional random variable X <strong>with</strong> a distribution<br />
characterized by the density f. Its <strong>kernel</strong> estimator<br />
ˆf : R n → [0, ∞), calculated using experimentally<br />
obtained values for the m-element random sample
A <strong>complete</strong> <strong>gradient</strong> <strong>clustering</strong> <strong>algorithm</strong> <strong>formed</strong> <strong>with</strong> <strong>kernel</strong> <strong>estimators</strong><br />
125<br />
x 1 ,x 2 ,...,x m , in its basic form is defined as<br />
ˆf(x) = 1<br />
mh n<br />
m ∑<br />
i=1<br />
( ) x − xi<br />
K , (2)<br />
h<br />
where m ∈ N\{0}, the coefficient h > 0 is called<br />
a smoothing parameter, while the measurable function<br />
K : R n → [0, ∞) of unit integral ∫ R<br />
K(x)dx =1,symmetrical<br />
<strong>with</strong> respect to zero and having a weak global<br />
n<br />
maximum in this place, is called the <strong>kernel</strong>. The choice of<br />
the <strong>kernel</strong> K and the calculation of the smoothing parameter<br />
h is made most often <strong>with</strong> the criterion of the mean<br />
integrated square error.<br />
Thus, the choice of the <strong>kernel</strong> form has—from a statistical<br />
point of view—no practical meaning and, thanks<br />
to this, it becomes possible to take into account primarily<br />
properties of the obtained estimator (e.g., its class of regularity,<br />
assigned positive values) or aspects of calculations,<br />
advantageous from the point of view of the application<br />
problem under investigation (for a broader discussion, see<br />
(Kulczycki, 2005, Section 3.1.3; Wand and Jones, 1994,<br />
Section 2.7 and Section 4.5) and also (Muller, 1984) for<br />
individual aspects). The most popular in practice is the<br />
normal <strong>kernel</strong>:<br />
K(x) = 1 ( )<br />
2π exp − xT x<br />
. (3)<br />
n/2 2<br />
Note that it is differentiable to any degree and assumes<br />
positive values in the whole domain.<br />
The fixing of the smoothing parameter h has significant<br />
meaning for the estimation quality. Too small a value<br />
causes a large number of local extremes of the estimator<br />
ˆf to appear, which is contrary to the actual properties<br />
of real populations. On the other hand, too big values of<br />
the parameter h result in the overflattening of this estimator,<br />
hiding specific properties of the distribution under<br />
investigation. According to the universal cross-validation<br />
method (Kulczycki, 2005, Section 3.1.5; Silverman, 1986,<br />
Section 3.4.3), it can be calculated as a value realizing the<br />
minimum of the function g :(0, ∞) → R in the form<br />
g(h) = 1<br />
m 2 h n<br />
m ∑<br />
m∑<br />
i=1 j=1<br />
( )<br />
xj − x i<br />
˜K<br />
h<br />
+ 2 K(0), (4)<br />
mhn while ˜K(x) =K ∗2 (x) − 2K(x), whereas K ∗2 denotes<br />
a convolution square of the function K. For the normal<br />
<strong>kernel</strong> (3), we have<br />
K ∗2 (x) =<br />
( )<br />
1<br />
(4π) exp − xT x<br />
. (5)<br />
n/2 4<br />
A range of other methods of calculating the smoothing parameter<br />
have been investigated under specific conditions.<br />
In particular, for the one-dimensional case one can recommend<br />
the simple and effective plug-in method (Kulczycki,<br />
2005, Section 3.1.5; Wand and Jones, 1994, Section<br />
3.6.1), although the above described universal crossvalidation<br />
method can also be applied here.<br />
In the case of the basic definition of the <strong>kernel</strong> estimator<br />
(2), the influence of the smoothing parameter<br />
on particular <strong>kernel</strong>s is the same. Advantageous results<br />
are obtained thanks to the individualization of this effect,<br />
achieved through the so-called modification of the<br />
smoothing parameter. It relies on mapping the positive<br />
modifying parameters s 1 ,s 2 ,...,s m on particular <strong>kernel</strong>s,<br />
described as<br />
( ) −c<br />
ˆf∗ (x i )<br />
s i =<br />
, (6)<br />
s<br />
where c ∈ [0, ∞), ˆf∗ denotes the <strong>kernel</strong> estimator <strong>with</strong>out<br />
modification, s is the geometrical mean of the numbers<br />
ˆf ∗ (x 1 ), ˆf ∗ (x 2 ), ..., ˆf ∗ (x m ) and, finally, defining the<br />
<strong>kernel</strong> estimator <strong>with</strong> the modification of the smoothing<br />
parameter in the following form:<br />
ˆf(x) = 1<br />
mh n<br />
m ∑<br />
s n i=1 i<br />
1<br />
K<br />
( ) x − xi<br />
. (7)<br />
hs i<br />
Thanks to the above procedure, the areas in which<br />
the <strong>kernel</strong> estimator has small values (e.g., in the range<br />
of “tails”) are additionally flattened, and the areas connected<br />
<strong>with</strong> large values are peaked, which permits to better<br />
reveal individual properties of the distribution. The<br />
parameter c stands for the intensity of the modification<br />
procedure. Based on indications for the criterion of the<br />
integrated mean square error, the value<br />
c =0.5 (8)<br />
can be suggested.<br />
Owing to the basic form of the <strong>kernel</strong> estimator (2),<br />
the smoothing parameter has the same influence on particular<br />
coordinates of this variable. Taking into account<br />
the possibility of sizable differences in scales of the above<br />
coordinates, for some of these the value of the parameter<br />
may turn out to be too small, whereas for others—too big.<br />
Because of this, a linear transformation is applied:<br />
X = RY, (9)<br />
where the matrix R is positive definite. In practice, its two<br />
main forms are used: diagonal,<br />
⎡ √ ⎤<br />
Var(X1 ) ··· 0<br />
⎢<br />
R =<br />
.<br />
⎣<br />
.<br />
. ..<br />
. ⎥<br />
√ . ⎦ , (10)<br />
0 ··· Var(Xn )<br />
and general,<br />
R = √ Cov(X), (11)
126 P. Kulczycki and M. Charytanowicz<br />
where Var(X i ) means the variance of the i-th coordinate,<br />
while Cov(X) stands for the covariance of the variable<br />
X. Following the transformation (9), the <strong>kernel</strong> estimator<br />
takes the form<br />
ˆf(x) =<br />
1<br />
mh n det(R)<br />
m∑<br />
i=1<br />
(<br />
K R −1 x − x )<br />
i<br />
. (12)<br />
h<br />
As a result, the scales of the particular coordinates become<br />
equal, while in the case of the general form (11), additionally,<br />
the shapes of <strong>kernel</strong>s stretch out in a direction defined<br />
by proper correlation coefficients.<br />
The naturalness and clarity of the <strong>kernel</strong> estimator<br />
concept allow us to easily adapt its properties to conditions<br />
of an investigated problem, e.g., by restricting the<br />
support of the function ˆf. The case of the left-sided<br />
boundary of a one-dimensional random variable, i.e., the<br />
condition ˆf(x) =0is to be fulfilled for every x0 and k ∗ ∈ N\{0}. In practice, it is recommended<br />
that<br />
b =<br />
h2<br />
(16)<br />
n +2<br />
(Fukunaga and Hostetler, 1975) 1 .<br />
In order to refine the above concept to the state of<br />
a <strong>complete</strong> <strong>algorithm</strong>, the following aspects need to be<br />
formulated and analyzed in detail:<br />
1. formula for the <strong>kernel</strong> estimator ˆf,<br />
2. setting a stopping condition (and, consequently, the<br />
number of steps k ∗ ),<br />
3. definition of a procedure for creating clusters and assigning<br />
to them particular elements of the set (1), after<br />
the last, k ∗ -th step,<br />
4. analysis of the influence of the values of parameters<br />
on the obtained results.<br />
The above tasks are the subjects of the following sections.<br />
3.1. Formula of the <strong>kernel</strong> estimator. For the needs<br />
of further parts of the concept presented here, the <strong>kernel</strong><br />
estimator ˆf is assumed in a form <strong>with</strong> the modification of<br />
the smoothing parameter of standard intensity (8), as is<br />
linear transformation using the diagonal form of the matrix<br />
(10) 2 .<br />
1 For ease of computations one can make use of ∇ ˆf(x)/ ˆf(x) =<br />
∇ln( ˆf(x)). Moreover, the value of this expression is sometimes obtained<br />
by computing the so-called mean shift—in this case, the <strong>gradient</strong><br />
<strong>clustering</strong> <strong>algorithm</strong> is known in the literature as the mean shift <strong>algorithm</strong><br />
(procedure); see, for example, (Cheng, 1995; Comaniciu and<br />
Meer, 2002; Yang et al., 2003). The method of evaluating the above<br />
expression is of no relevance for further parts of the presented material.<br />
2 Using the general form of the transformation matrix (11) results in<br />
elongating <strong>kernel</strong>s in one direction. This causes a difference in the rate of<br />
the convergence of the <strong>algorithm</strong> (14)–(15) <strong>with</strong> respect to the direction<br />
of the transposition of elements of the set (1), unjustified from the point<br />
of view of the <strong>clustering</strong> task and, consequently, interfering <strong>with</strong> the obtained<br />
results. Also for this reason, the product <strong>kernel</strong> (Kulczycki, 2005,<br />
Section 3.1.3; Wand and Jones, 1994, Section 4.2), very useful in practical<br />
applications, was rejected.
A <strong>complete</strong> <strong>gradient</strong> <strong>clustering</strong> <strong>algorithm</strong> <strong>formed</strong> <strong>with</strong> <strong>kernel</strong> <strong>estimators</strong><br />
127<br />
The <strong>kernel</strong> K is recommended in the normal form<br />
(3) due to its differentiability in the whole domain, convenience<br />
for analytical deliberations connected <strong>with</strong> the <strong>gradient</strong>,<br />
and assuming positive values, which in every case<br />
prevents from division by zero in the formula (15).<br />
3.2. Setting a stop condition. It is assumed that the<br />
<strong>algorithm</strong> (14)–(15) should be finished, if after the consecutive<br />
k-th step the following condition is fulfilled:<br />
where a>0 and<br />
|D k − D k−1 |≤aD 0 , (17)<br />
D 0 =<br />
D k−1 =<br />
D k =<br />
m−1<br />
∑<br />
m∑<br />
i=1 j=i+1<br />
m−1<br />
∑<br />
m∑<br />
i=1 j=i+1<br />
m−1<br />
∑<br />
m∑<br />
i=1 j=i+1<br />
d(x i ,x j ), (18)<br />
d(x k−1<br />
i ,x k−1<br />
j ), (19)<br />
d(x k i ,x k j ), (20)<br />
while d means a Euclidean metric in R n . Therefore, D 0<br />
and D k−1 , D k denote sums of distances between particular<br />
elements of the set (1) before starting the <strong>algorithm</strong><br />
as well as after the (k − 1)-th and k-th steps, respectively.<br />
Primarily, it is recommended that<br />
α =0.001. (21)<br />
A potential decrease in this value does not significantly<br />
influence the obtained results, although increases require<br />
individual verification of their correctness. The convergence<br />
of the above <strong>algorithm</strong> is proven in Appendix.<br />
Finally, if after the k-th step the condition (17) is fulfilled,<br />
then<br />
k ∗ = k (22)<br />
and, consequently, this step is treated as the last one.<br />
3.3. Procedure for creating clusters and assigning<br />
particular elements to them. At this stage, the following<br />
set is investigated:<br />
x k∗<br />
1 ,xk∗ 2 ,...,xk∗ m , (23)<br />
consisting of the elements of the set (1) after the k ∗ -th<br />
step of the <strong>algorithm</strong> (14)–(15). Following this, the set of<br />
mutual distances of the above elements<br />
{d(x k∗<br />
i ,x k∗<br />
j )<br />
}<br />
i=1,2,...,m−1<br />
j=i+1,i+2,...,m<br />
should be defined. Its size is given as<br />
m d =<br />
(24)<br />
m(m − 1)<br />
. (25)<br />
2<br />
Taking (24) as a sample of a one-dimensional random<br />
variable, the auxiliary <strong>kernel</strong> estimator ˆf d of mutual<br />
distances of the elements of the set (23) ought to be calculated.<br />
Regarding the methodology of <strong>kernel</strong> <strong>estimators</strong><br />
presented in Section 2, the normal <strong>kernel</strong> (3) is once again<br />
proposed, as is the use of the procedure of smoothing parameter<br />
modification <strong>with</strong> a standard value of the parameter<br />
(8), and additionally left-sided boundary of a support<br />
to the interval [0, ∞).<br />
The next task is to find—<strong>with</strong> suitable precision—<br />
the “first” (i.e., for the smallest value of an argument) a<br />
local minimum of the function ˆf d belonging to the interval<br />
(0,D), where<br />
D =<br />
max<br />
i=1,2,...,m−1<br />
d(x i ,x j ). (26)<br />
j=i+1,i+2,...,m<br />
For this purpose, one should treat the set (24) as a random<br />
sample, calculate its standard deviation σ d , and next take<br />
in sequence the values x from the set<br />
{ }<br />
0.01σd , 0.02σ d ,...,[int(100D) − 1]0.01σ d , (27)<br />
where int(100D) denotes the integer part of the number<br />
100D, until finding the first (the smallest) of them which<br />
fulfils the condition<br />
ˆf d (x − 0.01σ d ) > ˆf d (x) and ˆf d (x) ≤ ˆf d (x +0.01σ d ).<br />
(28)<br />
This valueă 3 will be denoted hereinafter as x d , and it can<br />
be interpreted as half the distance between “centers” of<br />
potential clusters lying closest together.<br />
Finally, the clusters will be created. To this aim, one<br />
should:<br />
1. Take the element of the set (23) and initially create a<br />
one-element cluster containing it.<br />
2. Find an element of the set (23) different from the one<br />
in the cluster, closer than x d ; if there is such an element,<br />
then it should be added to the cluster, otherwise,<br />
proceed to Point 4.<br />
3. Find an element of the set (23) different from elements<br />
in the cluster, closer than x d to at least one of<br />
them; if there is such an element, then it should be<br />
added to the cluster and Point 3 repeated.<br />
4. Add the obtained cluster to a “list of clusters” and remove<br />
from the set (23) elements of this cluster; if this<br />
so-reduced set (23) is not empty, return to Point 1,<br />
otherwise, finish the <strong>algorithm</strong>.<br />
3 If such a value does not exist, then one should recognize the existence<br />
of one cluster and finish the procedure. A similar suggestion may<br />
be made for the irrational, yet formally possible case where m =1,as<br />
the set (24) is then empty.
128 P. Kulczycki and M. Charytanowicz<br />
The “list of clusters” so defined contains all clusters<br />
marked out in the above procedure. Therefore it becomes<br />
the <strong>complete</strong> <strong>gradient</strong> <strong>clustering</strong> <strong>algorithm</strong> in the basic<br />
form—its possible modifications and their influence on<br />
the obtained results will be presented in the next section.<br />
3.4. Analysis of the influence of the values of parameters<br />
on the obtained results. It is worth repeating that<br />
the presented <strong>clustering</strong> <strong>algorithm</strong> did not require a preliminary,<br />
often arbitrary in practice, assumption concerning<br />
the number of clusters—their size depending solely<br />
on the internal structure of data, given as the set (1). In<br />
the application of the <strong>complete</strong> <strong>gradient</strong> <strong>clustering</strong> <strong>algorithm</strong><br />
in its basic form, the values of the parameters used<br />
are effectively calculated taking optimization reasons into<br />
account. However, optionally—if the researcher makes<br />
a decision—by an appropriate change in values of <strong>kernel</strong><br />
estimator parameters, it is possible to influence the size<br />
of the number of clusters, and also the proportion of their<br />
appearance in dense areas in relation to sparse regions of<br />
elements in this set.<br />
In the example presented now, the elements of the<br />
set (1) have been generated pseudorandomly, for a distribution<br />
selected specially to highlight the above aspects.<br />
As mentioned in Section 2, too small a value of the<br />
smoothing parameter h results in the appearance of too<br />
many local extremes of the <strong>kernel</strong> estimator, while too<br />
great a value causes its excessive smoothing. In this situation<br />
lowering the value of the parameter h <strong>with</strong> respect to<br />
that obtained by procedures based on the criterion of the<br />
mean integrated square error creates, as a consequence, an<br />
increase in the number of clusters. At the same time, an<br />
increase in the smoothing parameter value results in fewer<br />
clusters. It should be underlined that in both cases, despite<br />
having an influence on the size of the cluster number,<br />
their exact number will still depend solely on the internal<br />
structure of data. Based on research carried out, one can<br />
recommend a change in the value of the smoothing parameter<br />
by between −25% and +50%. Outside this range,<br />
the obtained results require individual verification.<br />
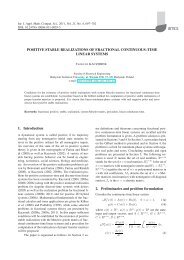
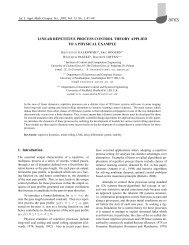
Figure 1 shows the illustratively chosen sample set<br />
of two-dimensional vectors. When applying the smoothing<br />
parameter value calculated <strong>with</strong> the cross-validation<br />
method (see Section 2), three clusters are obtained. Following<br />
a decrease in this value by 25%, their number<br />
grows to four, as one cluster divides in two. On the other<br />
hand, a 50% increase results in the identification of only<br />
two clusters, <strong>with</strong> two of the original clusters uniting.<br />
Next, as mentioned in Section 2, the intensity of the<br />
modification of the smoothing parameter is implied by the<br />
value of the parameter c, given as standard by the formula<br />
(8). Its increase smoothes the <strong>kernel</strong> estimator in areas<br />
where elements of the set (1) are sparse and also sharpens<br />
it in dense areas—in consequence, if the value of the parameter<br />
c is raised, then the number of clusters in sparse<br />
Fig. 1. Effects of changing the value of the smoothing parameter<br />
h: calculated by the cross-validation method (a), lowered<br />
by 25% (b), raised by 50% (c).<br />
areas of data decreases, while at the same time increasing<br />
in dense regions. Inverse effects can be seen in the case<br />
of lowering this parameter value. Based on research carried<br />
out we can recommend the value of the parameter c<br />
to be between 0 (meaning no modification) and 1.5. An<br />
increase greater than 1.5 requires individual verification<br />
of the validity of the obtained results. Particularly, it is<br />
recommended that c =1.<br />
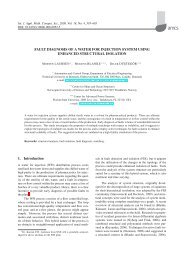
Figure 2 shows an illustrative sample set of<br />
two-dimensional vectors. When the standard value c =<br />
0.5 is applied, four clusters are obtained—two in dense ar-
A <strong>complete</strong> <strong>gradient</strong> <strong>clustering</strong> <strong>algorithm</strong> <strong>formed</strong> <strong>with</strong> <strong>kernel</strong> <strong>estimators</strong><br />
129<br />
as they frequently pertain to atypical elements (outliers)<br />
commonly arising due to various errors. Putting the above<br />
together, one can propose an increase in both the standard<br />
scale of the smoothing parameter modification (8) and the<br />
value of the smoothing parameter h calculated on the criterion<br />
of the mean integrated square error, to the value h ∗<br />
defined by the formula<br />
( ) c−0.5 3<br />
h ∗ = h. (29)<br />
2<br />
The joint action of both these factors results in a twofold<br />
smoothing of the function ˆf in the regions where the elements<br />
of the set (1) are sparse. Meanwhile, these factors<br />
more or less compensate for each other in dense areas,<br />
thereby having small influence on the detection of these<br />
clusters. Based on research carried out, one can recommend<br />
a change in the value of the parameter c from 0.5 to<br />
1.0. Increasing it to above 1.0 demands individual verification<br />
of the validity of the obtained results. Particularly<br />
it is recommended that c =0.75.<br />
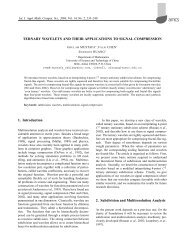
Figure 3 once more shows an illustrative sample set<br />
of two-dimensional vectors. In the case of the standard<br />
value of the parameter c = 0.5, four clusters appear—<br />
two in dense areas and two in sparse regions. When c =<br />
0.75 was assumed and, consequently, h ∗ =(3/2) 0.25 h ≈<br />
1.11h, the first two clusters remained unchanged, but the<br />
two peripheral ones united. For c =1and h ∗ =1.22h<br />
this was also then eliminated.<br />
Finally, it is worth mentioning a possibility of reducing<br />
the set (24). In practice, it is too large not only because<br />
of the square dependence regarding the size of the set (1),<br />
occurring in the formula (25), but also due to the fact<br />
that the estimator ˆf d concerns a one-dimensional random<br />
variable, while ˆf, usually multidimensional, by nature demanding<br />
notably greater a sample size. For a very large<br />
size of the sample (24) it is worth using data-compression<br />
procedures well-known in literature, see, e.g., (Girolami<br />
and He, 2003; Pal and Mitra, 2004, Section 2.5).<br />
Fig. 2. Effects of differentiation intensity of smoothing parameter<br />
modification through changes in the value of the parameter<br />
c: standard value c =0.5 (a), value lowered to<br />
c =0(b), value increased to c =1(c).<br />
eas and two in sparse regions. If c =0, there is no change<br />
in the number of clusters; however, the clusters in dense<br />
areas coalesce, and an additional cluster appears in sparse<br />
regions. Similarly, when c =1, the number of clusters<br />
remains the same, but in dense areas the number increases<br />
to three, while decreasing to one in sparse regions.<br />
Practice, however, often prevents changes to clusters<br />
in dense areas of data—the most important from an applicational<br />
point of view—while at the same time requiring a<br />
reduction or even elimination of clusters in sparse regions,<br />
4. Summary and application examples<br />
The subject of this article is the <strong>gradient</strong> <strong>clustering</strong> <strong>algorithm</strong>,<br />
based on the natural assumption that if one treats a<br />
data set, given as n-dimensional vectors, as a sample obtained<br />
from an n-dimensional random variable, then particular<br />
clusters correspond to modes (local maxima) of its<br />
density estimator, while assigning particular data set elements<br />
to them takes place by transposing those elements<br />
in the direction of the density function <strong>gradient</strong>. A <strong>complete</strong><br />
form was presented, suitable for direct use <strong>with</strong>out<br />
requiring a deeper statistical knowledge or laborious research<br />
by users.<br />
A basic characteristic of the <strong>complete</strong> <strong>gradient</strong> <strong>clustering</strong><br />
<strong>algorithm</strong> investigated here is that a fixed number<br />
of clusters is not required, just an indication of its size,
130 P. Kulczycki and M. Charytanowicz<br />
(a)<br />
(b)<br />
(c)<br />
Fig. 3. Effects of simultaneous changes in the values of the parameters<br />
h and c: standard value c =0.5 and h calculated<br />
by the cross-validation method (a), value increased<br />
to c =0.75 and h calculated according to the formula<br />
(29) (b), value increased to c =1and h calculated according<br />
to the formula (29) (c).<br />
which allows the number of clusters to be suited to the<br />
real structure of data. Applying the <strong>algorithm</strong> in its basic<br />
form does not require the user to supply arbitrary values<br />
for parameters, as they may be calculated using optimizing<br />
criteria; however, there also exists the possibility of<br />
their optional change. Thus, <strong>with</strong> a proper modification of<br />
parameter values, it is possible to influence the approximate<br />
quantity of clusters alone (although their exact number<br />
will depend on the internal structure of data), as well<br />
as—which is particularly worth underlining—the proportion<br />
of their appearances in dense as opposed to sparse<br />
areas of data set elements. Especially, it is possible practically<br />
not to intervene in the number of clusters in dense areas,<br />
at the same time significantly reducing, or even eliminating,<br />
clusters in sparse regions. The <strong>algorithm</strong> often<br />
creates one-element clusters, which indicates that they are<br />
atypical in a given data structure—it can be then homogenized<br />
by their elimination or by assigning them to the<br />
nearest clusters through the above mentioned appropriate<br />
change in parameter values.<br />
Now, three application examples of the investigated<br />
<strong>algorithm</strong> will be presented, firstly for improving the quality<br />
of the <strong>kernel</strong> estimator of the distribution density, described<br />
in Section 2, next, for use in a classification task—<br />
referring to a real research problem from biology—for a<br />
set of real data available in classic literature, and then for<br />
the practical task of planning the marketing strategy of<br />
mobile phone operators.<br />
Consider first the example of an eighty-element random<br />
sample illustrated in Fig. 4. In order to find a distribution<br />
density, the <strong>kernel</strong> <strong>estimators</strong> methodology, presented<br />
in Section 2, will be used, <strong>with</strong> the application of a normal<br />
<strong>kernel</strong>, a cross-validation method, a procedure for the<br />
modification of the smoothing parameter <strong>with</strong> standard intensity<br />
(8), and a linear transformation. So, the matrix R<br />
calculated for the sample considered is for the diagonal<br />
form (10):<br />
R =<br />
[ 8.77 0<br />
0 4.15<br />
and for the general form (11):<br />
[<br />
8.77 1.41<br />
R =<br />
1.41 4.15<br />
]<br />
, (30)<br />
]<br />
. (31)<br />
In the first case, this results in the contour lines of <strong>kernel</strong>s<br />
being stretched horizontally by about 45%, while in the<br />
second case the direction undergoes a turn of about 30ř<br />
counter-clockwise. Thus, in both cases the shapes of <strong>kernel</strong>s<br />
do not fit any clearly-outlined data subset and do not<br />
even represent any kind of “compromise” between them.<br />
In order to improve the quality of the estimator, the<br />
random sample shown in Fig. 4 was submitted to the <strong>complete</strong><br />
<strong>gradient</strong> <strong>clustering</strong> <strong>algorithm</strong> <strong>with</strong> c = 1 and the<br />
smoothing parameter value obtained using the formula<br />
(29), after which for each defined cluster a linear transformation<br />
matrix was calculated in its general form (11),<br />
giving the following:<br />
R ′ =<br />
R ′′ =<br />
[ 0.18 −0.22<br />
−0.22 4.74<br />
[ 3.14 3.21<br />
3.21 3.57<br />
]<br />
, (32)<br />
]<br />
. (33)
A <strong>complete</strong> <strong>gradient</strong> <strong>clustering</strong> <strong>algorithm</strong> <strong>formed</strong> <strong>with</strong> <strong>kernel</strong> <strong>estimators</strong><br />
131<br />
8<br />
160<br />
d<br />
y<br />
z<br />
concinna<br />
x<br />
150<br />
heptapotamica<br />
6<br />
140<br />
x2<br />
a b c<br />
4<br />
130<br />
A<br />
B C<br />
x2<br />
2<br />
120<br />
110<br />
x2<br />
x2<br />
heikertingeri<br />
0<br />
0<br />
2 4 6 8 10 12<br />
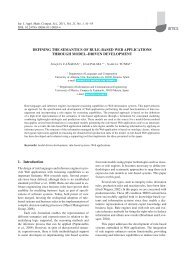
Fig. 4. Illustration of the improvement in the quality of the <strong>kernel</strong><br />
estimator by the application of the local linear transformation<br />
matrices (32)–(33).<br />
100<br />
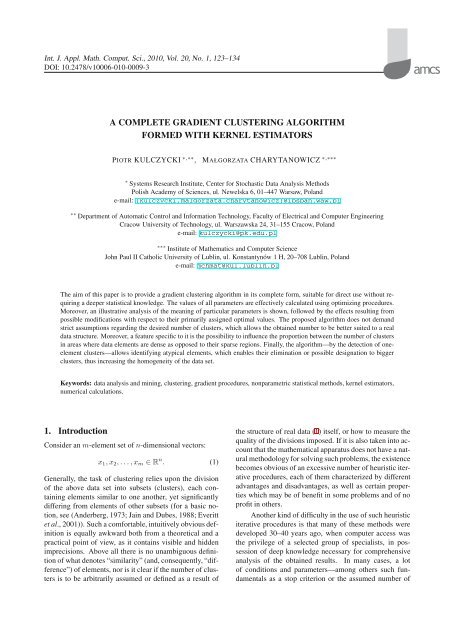
100 120 140 160 180 200 220 240 260<br />
Fig. 5. Empirical data for three species of the beetle genus<br />
Chaetocnema (X-axis—width of the first joint of the tarsus,<br />
Y -axis—the front angle of the aedeagus).<br />
Applying them separately to the obtained clusters, the<br />
shape of the <strong>kernel</strong>s was appropriately stretched—for illustration,<br />
see Fig. 4 once more.<br />
Knowing the theoretical distribution density from<br />
which the sample was generated, the mean integrated<br />
square error value was calculated. For the whole<br />
80-element random sample, this error was only 2% less<br />
for the general form of the transformation matrix (31) than<br />
for the significantly simpler diagonal form (30). Such a<br />
small difference comes from the fact that—as mentioned<br />
above—in both cases the <strong>kernel</strong> shapes are almost equally<br />
poorly suited to the data structure. After using the <strong>complete</strong><br />
<strong>gradient</strong> <strong>clustering</strong> <strong>algorithm</strong> and calculating the <strong>kernel</strong><br />
<strong>estimators</strong> separately for the obtained clusters, the error<br />
decreased by about 50% for the general transformation<br />
matrices (32)–(33), and for the diagonal forms of the<br />
matrices—by about 20%. Both cases show evident advantages<br />
arising from the applications of preliminary <strong>clustering</strong><br />
data <strong>with</strong> the help of the <strong>complete</strong> <strong>gradient</strong> <strong>clustering</strong><br />
<strong>algorithm</strong>. Similar results occurred for other distributions,<br />
also multimodal, and for various random sample sizes.<br />
The next example is based on real data referring to<br />
the often-found in Europe beetle of the genus Chaetocnema,<br />
existing in three speciesă: conicinna, heikertingeri<br />
and heptapotamica. The work (Lubischew, 1962,<br />
Tables 4–6), offers six features measured in 21, 31 and<br />
22 males of the above species, respectively. The first feature,<br />
“width of the first joint of the tarsus in microns (the<br />
sum of measurements for both tarsi)”, dominates, while<br />
the fourth, “the front angle of the aedeagus (1 unit = 7,5ř)”<br />
and the sixth, “the aedeagus width from the side (in microns)”,<br />
are of medium importance. The remaining three<br />
are less significant. For the sake of graphic presentation<br />
and facilitating interpretation of the results obtained on a<br />
plane, the investigation below was limited to the two mentioned<br />
first.<br />
Figure 5 shows points representing particu-<br />
lar individually tested beetles (Lubischew, 1962,<br />
Tables 4–6). Some of them were characterized by identical<br />
measurements—in these cases corresponding points<br />
were given the symbol “×2”. As a result of <strong>clustering</strong><br />
using the <strong>complete</strong> <strong>gradient</strong> <strong>clustering</strong> <strong>algorithm</strong> for<br />
standard parameter values, the data set was divided into<br />
four clusters, <strong>with</strong> one of them containing one element.<br />
Considering the task of classification <strong>with</strong> the <strong>clustering</strong><br />
procedure, one can ascertain that three elements<br />
marked in Fig. 5 as A, B, C were wrongly assigned. The<br />
first of these forms the aforementioned one-element cluster,<br />
the second was wrongly included in the left-hand cluster<br />
representing the species heptapotamica, and the third<br />
was placed in the lower-right-hand heikertingeri, while all<br />
three should belong to the upper-right-hand cluster representing<br />
the species conicinna.<br />
The basic conditioning of the problem—even <strong>with</strong>out<br />
knowing the number of species—shows that the oneelement<br />
cluster is erroneous. Following the instructions<br />
presented above, this cluster was eliminated in the typical<br />
waybytakingc =1and the modification of the smoothing<br />
parameter h value, according to the formula (29).<br />
Thus the number of clusters was reduced to three. The<br />
point A was assigned to the left-hand cluster representing<br />
the species heptapotamica, which is not actually correct<br />
from the classification task point of view, as it should belong<br />
to the upper-right-hand cluster of conicinna. Sothe<br />
<strong>complete</strong> <strong>gradient</strong> <strong>clustering</strong> <strong>algorithm</strong> made three mistakes<br />
in classifying the beetle genus Chaetocnema. Looking<br />
at Fig. 5 it is worth noticing, however, that in the<br />
case of points A and B these mistakes are justified—the<br />
above points are placed very close to elements of the lefthand<br />
cluster of the species heptapotamica. With respect to<br />
the point C such diagnosis is not so unambiguous, though<br />
worth pointing out is the fact that it lies close to a significant<br />
concentration of elements from the lower-right-hand<br />
cluster representing heikertingeri.
132 P. Kulczycki and M. Charytanowicz<br />
For comparison, the same data were subjected to the<br />
classic k-means <strong>algorithm</strong>, available in statistical packages<br />
Statistica and SPSS. Standard parameter values as<br />
well as procedure forms were used during their running.<br />
It is worth stressing that the k-means <strong>algorithm</strong><br />
availed of the aprioriassumed correct number of clusters,<br />
which in many applications may not be known, or<br />
even such a “correct”—from a theoretical point of view—<br />
number might not exist at all (see the example for planning<br />
the marketing strategy for mobile phone operators, below).<br />
Thus, for the k-means <strong>algorithm</strong> from Statistica, the<br />
<strong>clustering</strong> process led to four erroneous classifications—<br />
wrongly assigned points are marked in Fig. 5 <strong>with</strong> the letters<br />
‘a’, ‘b’, ‘c’ and ‘d’—the first three were included in<br />
the lower-right-hand cluster representing the heikertingeri<br />
space, although they should be part of the upper-righthand<br />
conicinna, while the fourth, actually belonging to<br />
the left-hand heptapotamica, was given to the upper-righthand<br />
cluster of conicinna. The k-means <strong>algorithm</strong> from<br />
SPSS, however, generated 18 misclassifications. Here,<br />
a group of 15 elements in the left part of the lowerright-hand<br />
cluster representing the heikertingeri space—<br />
in Fig. 5 surrounded by a dashed line—were placed in the<br />
upper-right-hand cluster of conicinna, while for one element,<br />
marked in Fig. 5 by the letter ‘x’, the opposite classification<br />
error was the case. Moreover, the points ‘y’ and<br />
‘z’ were put in the left-hand cluster representing the heptapotamica<br />
space, while they should actually belong to the<br />
upper-right-hand conicinna. When interpreting the relative<br />
positions of particular points in Fig. 5, in both cases<br />
errors created by the k-means <strong>algorithm</strong> are most often<br />
difficult to explain in terms that would be easy for people<br />
to understand.<br />
The above comments can be generalized to the results<br />
of numerous tests carried out <strong>with</strong> the aim of comparing<br />
the <strong>complete</strong> <strong>gradient</strong> <strong>clustering</strong> <strong>algorithm</strong> investigated<br />
here <strong>with</strong> other classic <strong>clustering</strong> procedures besides<br />
k-means, e.g., hierarchical methods. It is difficult to confirm<br />
here the absolute supremacy of any one of them—to<br />
a large degree the advantage stemmed from the conditions<br />
and requirements formulated <strong>with</strong> regard to the problem<br />
under consideration, although the <strong>complete</strong> <strong>gradient</strong> <strong>clustering</strong><br />
<strong>algorithm</strong> allowed greater possibilities of adjustment<br />
to the real structure of data and, consequently, the<br />
obtained results were more justifiable to a natural human<br />
point of view. A very important feature for practitioners<br />
was the possibility of firstly functioning using standard<br />
parameter values, and the option of changing them<br />
afterwards—according to individual needs—by the modification<br />
of two of them <strong>with</strong> easy and illustrative interpretations.<br />
The <strong>complete</strong> <strong>gradient</strong> <strong>clustering</strong> <strong>algorithm</strong> was also<br />
successfully practically applied to planning the marketing<br />
strategy for mobile phone operators <strong>with</strong> respect to corporate<br />
clients. The aim of the research here was to investigate<br />
the appropriate behavior towards a given client,<br />
based on factors such as a mean monthly income from<br />
each SIM-card, the length of subscription, and the number<br />
of active SIM-cards. There was no aprioritheoretical<br />
premise for setting the number of clusters characterizing<br />
particular types of clients. The data representing particular<br />
clients were divided into clusters, resulting in the possibility<br />
of defining a preferred marketing strategy <strong>with</strong> respect<br />
to each of them on the basis of fuzzy data obtained<br />
from experts.<br />
A deep analysis and exploration of information contained<br />
in the client database not only allows the development<br />
of the best—from the client as well as the operator<br />
point of view—options for offering the most satisfaction<br />
possible to the former and at the same time the appropriate<br />
steering of the development of the latter, but also the<br />
acquisition of new clients. In particular, after the preliminary<br />
phase was per<strong>formed</strong> for standard parameter values,<br />
the intensity of the modification of the smoothing parameter<br />
was increased by taking c =1, <strong>with</strong> the aim of dividing<br />
the largest cluster containing over half of the elements and<br />
reducing small, and therefore less meaningful, clusters.<br />
Finally, 17 clusters were distinguished as a result for the<br />
<strong>complete</strong> <strong>gradient</strong> <strong>clustering</strong> <strong>algorithm</strong>, which was an acceptable<br />
size as far as further analysis was concerned, and<br />
consequently a change in the smoothing parameter value<br />
was not carried out, <strong>with</strong> the standard value remaining.<br />
The two largest clusters contained 27% and 23% of data<br />
base elements, <strong>with</strong> the next medium two in possession of<br />
14% and 7%—most often elements of typical characteristics.<br />
The rest of the clusters accounted for less than 3%,<br />
most often atypical and firm-specific, although properly<br />
grouped. For details, see the publication (Kulczycki and<br />
Daniel, 2009).<br />
The concept presented in this article is universal,<br />
and in particular cases the details may be refined, as an<br />
example see the different concepts of the stop criterion<br />
based on entropy applied in the works (Rodriguez and<br />
Suarez, 2006; Carreira-Perpinan, 2006).<br />
Acknowledgment<br />
Our heartfelt thanks go to our colleague Dr. Karina Daniel,<br />
whose research carried out for her Ph.D. thesis (Daniel,<br />
2009) showed us the importance of the task presented<br />
here and gave credence to the usefulness of the obtained<br />
results.<br />
References<br />
Anderberg, M. R. (1973). Cluster Analysis for Applications,<br />
Academic Press, New York, NY.<br />
Barnett, V. and Lewis, T. (1994). Outliers in Statistical Data,<br />
Wiley, Chichester.
A <strong>complete</strong> <strong>gradient</strong> <strong>clustering</strong> <strong>algorithm</strong> <strong>formed</strong> <strong>with</strong> <strong>kernel</strong> <strong>estimators</strong><br />
133<br />
Carreira-Perpinan, M. A. (2006). Fast nonparametric <strong>clustering</strong><br />
<strong>with</strong> gaussian blurring mean-shift, Proceedings of the International<br />
Conference on Machine Learning, Pittsburgh,<br />
PA, USA, pp. 153–160.<br />
Cheng, Y. (1995). Mean shift, mode seeking, and <strong>clustering</strong>,<br />
IEEE Transactions on Pattern Analysis and Machine Intelligence<br />
17(8): 790–799.<br />
Comaniciu, D. and Meer, P. (2002). Mean shift: A robust<br />
approach toward feature space analysis, IEEE Transactions<br />
on Pattern Analysis and Machine Intelligence<br />
24(5): 603–619.<br />
Daniel, K. (2009). Marketing strategy support method for a cell<br />
phone operator, Ph.D. thesis, Systems Research Institute,<br />
Polish Academy of Sciences, Warsaw, (in Polish).<br />
Everitt, B. S., Landau, S. and Leese, M. (2001). Cluster Analysis,<br />
Arnold, London.<br />
Fukunaga, K. and Hostetler, L. D. (1975). The estimation of<br />
the <strong>gradient</strong> of a density function, <strong>with</strong> applications in pattern<br />
recognition, IEEE Transactions on Information Theory<br />
21(1): 32–40.<br />
Girolami, M. and He, C. (2003). Probability density estimation<br />
from optimally condensed data samples, IEEE<br />
Transactions on Pattern Analysis and Machine Intelligence<br />
25(10): 1253–1264.<br />
Jain, A. K. and Dubes, R. C. (1988). Algorithms for Clustering<br />
Data, Prentice Hall, Englewood Cliffs, NJ.<br />
Kincaid, D. and Cheney, W. (2002). Numerical Analysis,<br />
Brooks/Cole, Pacific Grove, CA.<br />
Kulczycki, P. (2005). Kernel Estimators in Systems Analysis,<br />
WNT, Warsaw, (in Polish).<br />
Kulczycki, P. (2007). Kernel <strong>estimators</strong> in systems research,<br />
in P. Kulczycki, O. Hryniewicz and J. Kacprzyk (Eds), Information<br />
Technologies in Systems Research, WNT,Warsaw,<br />
pp. 79–105, (in Polish).<br />
Kulczycki, P. (2008). Kernel <strong>estimators</strong> in industrial applications,<br />
in B. Prasad (Ed.), Soft Computing Applications in<br />
Industry, Springer-Verlag, Berlin, pp. 69–91.<br />
Kulczycki, P. and Charytanowicz, M. (2008). A <strong>complete</strong><br />
<strong>gradient</strong> <strong>clustering</strong> <strong>algorithm</strong>, in K. Malinowski<br />
and L. Rutkowski (Eds), Control and Automation: Current<br />
Problems and Their Solutions, EXIT, Warsaw,<br />
pp. 312–321, (in Polish).<br />
Kulczycki, P. and Daniel, K. (2009). A method for supporting<br />
the marketing strategy of a mobile phone network provider,<br />
Przeglad ˛ Statystyczny 56(2): 116–134, (in Polish).<br />
Kulczycki, P. and Łukasik, S. (2009). Reduction of sample<br />
dimension and size for synthesis of a statistical fault detection<br />
system, in Z. Kowalczuk (Ed.), Systems Detecting,<br />
Analysing and Tolerating Faults, PWNT, Gdańsk,<br />
pp. 139–146, (in Polish).<br />
Larose, D. T. (2006). Data Mining Methods and Models, Wiley,<br />
New York, NY.<br />
Lubischew, A. A. (1962). On the use of discriminant functions<br />
in taxonomy, Biometrics 18(4): 455–478.<br />
Muller, H. G. (1984). Smooth optimum <strong>kernel</strong> <strong>estimators</strong> of densities,<br />
regression curves and models, The Annals of Statistics<br />
12(2): 766–774.<br />
Pal, S. K. and Mitra, P. (2004). Pattern Recognition Algorithms<br />
for Data Mining, Chapman and Hall, London.<br />
Rodriguez, R. and Suarez, A. G. (2006). A new <strong>algorithm</strong> for<br />
image segmentation by using iteratively the mean shift filtering,<br />
Scientific Research and Essay 1(2): 43–48.<br />
Silverman, B. W. (1986). Density Estimation for Statistics and<br />
Data Analysis, Chapman and Hall, London.<br />
Wand, M. P. and Jones, M. C. (1994). Kernel Smoothing, Chapman<br />
and Hall, London.<br />
Wang, W. J., Tan, Y. X., Jiang, J. H., Lu, J. Z., Shen, G. L.<br />
and Yu, R. Q. (2004). Clustering based on <strong>kernel</strong> density<br />
estimation: Nearest local maximum searching <strong>algorithm</strong>,<br />
Chemometrics and Intelligent Laboratory Systems<br />
72(1): 1–8.<br />
Yang, C., Duraiswami, R., DeMenthon, D. and Davis, L. (2003).<br />
Mean-shift analysis using quasi-newton methods, Proceedings<br />
of the IEEE International Conference on Image Processing,<br />
Barcelona, Spain, pp. 447–450.<br />
Zhang, K., Tang, M. and Kwok, J. T. (2005). Applying neighborhood<br />
consistency for fast <strong>clustering</strong> and <strong>kernel</strong> density<br />
estimation, Proceedings of the IEEE International Conference<br />
on Vision and Pattern Recognition, San Diego, CA,<br />
USA, pp. 1001–1007.<br />
Piotr Kulczycki is a professor at the Systems<br />
Research Institute of the Polish Academy of<br />
Sciences and the head of its Center for Statistical<br />
Data Analysis Methods, as well as at the<br />
Cracow University of Technology, where he is<br />
the head of the Department of Automatic Control<br />
and Information Technology. He has also<br />
held the position of a visiting professor at Aalborg<br />
University. The field of his scientific activity<br />
to date covers applicational aspects of information<br />
technology as well as data mining and analysis, mostly connected<br />
<strong>with</strong> the use of modern statistical methods and fuzzy logic in diverse issues<br />
of contemporary systems research and control engineering.<br />
Małgorzata Charytanowicz is research scientist<br />
at the Systems Research Institute, Polish<br />
Academy of Sciences, as well as at the Department<br />
of Numerical Analysis and Programming<br />
Methods, John Paul II Catholic University<br />
of Lublin. She obtained her M.Sc. degree<br />
in mathematics from Maria Curie-Skłodowska<br />
University in Lublin, and her Ph.D. from the<br />
Systems Research Institute, Polish Academy of<br />
Sciences, in the area of computer science. Her<br />
research interests are programming methods, data analysis and its applications<br />
for medicine.<br />
Appendix<br />
Here a proof is provided that the <strong>algorithm</strong> presented in<br />
Section 3.2 converges, therefore that after a sufficient (finite)<br />
number of steps the condition (17) <strong>with</strong> the notations
134 P. Kulczycki and M. Charytanowicz<br />
(18)–(20) is fulfilled <strong>with</strong> probability 1. To this end, it is<br />
enough to show that<br />
lim |D k − D k−1 | =0 (34)<br />
k→∞<br />
<strong>with</strong> probability 1, and therefore, for every ɛ>0 there<br />
exists ˜k ∈ N such that<br />
∣<br />
m−1<br />
∑<br />
m∑<br />
i=1 j=i+1<br />
m−1<br />
∑<br />
d(x˜k<br />
i ,x˜k<br />
j ) −<br />
m∑<br />
i=1 j=i+1<br />
d(x˜k−1<br />
i ,x˜k−1<br />
j )<br />
∣ 0 be arbitrarily fixed. From the definition<br />
of the <strong>kernel</strong> estimator and the normal <strong>kernel</strong> form,<br />
it follows that the set x ∈ R n such that ∇ ˆf(x) =0has<br />
measure zero. Because at the beginning of Section 3 it<br />
was assumed that elements of the set (1) are treated as<br />
realizations of a random variable <strong>with</strong> distribution having<br />
density, the probability that one of them belongs to this set<br />
is zero. Therefore, ∇ ˆf(x i ) ≠0for i =1, 2,...,m<strong>with</strong><br />
probability 1.<br />
In the paper (Fukunaga and Hostetler, 1975) it was<br />
shown that in this case, for the normal <strong>kernel</strong> and the<br />
parameter b given by the formula (16), the <strong>algorithm</strong><br />
(14)–(15) transposes the elements x 1 ,x 2 ,...,x m to the<br />
proper modes of the estimator ˆf. A result is that for any<br />
fixed i =1, 2,...,m−1 and j = i+1,i+2,...,mthere<br />
exists ˜k i,j ∈ N such that for every natural k greater than<br />
˜k i,j we have<br />
∣<br />
∣d(x k i ,xk j ) − d(xk−1 i<br />
,x k−1<br />
j<br />
) ∣ ∣ <<br />
2ɛ<br />
m(m − 1)<br />
(36)<br />
(remember that a convergence sequence is a Cauchy one).<br />
As the number of factors in the sums appearing in the formula<br />
(35) equals m(m − 1)/2, then denoting<br />
˜k =<br />
max ˜k i,j , (37)<br />
i=1,2,...,m−1<br />
j=i+1,i+2,...,m<br />
one obtains the condition (35), which finally <strong>complete</strong>s<br />
this proof, establishing the convergence of the <strong>algorithm</strong><br />
presented in Section 3.2 <strong>with</strong> probability 1.<br />
Received: 2 October 2008<br />
Revised: 10 April 2009