A multi-factor model for the valuation and risk management of ...
A multi-factor model for the valuation and risk management of ...
A multi-factor model for the valuation and risk management of ...

You also want an ePaper? Increase the reach of your titles
YUMPU automatically turns print PDFs into web optimized ePapers that Google loves.
We retrieve quarterly individual bank 1994:Q4-2005:Q2 savings deposit balance data from <strong>the</strong><br />
Belgian supervisory reporting scheme (<strong>the</strong> so-called Schema A, unconsolidated numbers). The<br />
balances <strong>of</strong> institutions that merged in our time sample have been added up be<strong>for</strong>e <strong>the</strong> merger to<br />
avoid structural breaks in <strong>the</strong> times series. To respect con…dentiality <strong>of</strong> individual bank data, we<br />
report key results averaged over groups <strong>of</strong> banks. Speci…cally, average results are reported <strong>for</strong> <strong>the</strong><br />
Big 4 conglomerate banks <strong>and</strong> <strong>the</strong> group <strong>of</strong> four medium-sized banks, respectively.<br />
Instead <strong>of</strong> using advertised deposit rates, that is advertized base rates plus growth or loyalty<br />
premiums, we have extracted implicit deposit rates, de…ned as <strong>the</strong> ratio <strong>of</strong> <strong>the</strong> interest that is<br />
paid out by <strong>the</strong> bank over a speci…c quarter divided by <strong>the</strong> average outst<strong>and</strong>ing balances over <strong>the</strong><br />
same quarter. Compared to advertised rates, being <strong>the</strong> sum <strong>of</strong> base <strong>and</strong> premium rates, <strong>the</strong> use<br />
<strong>of</strong> implicit deposit rates has a number <strong>of</strong> advantages. They better re‡ect <strong>the</strong> true cost <strong>and</strong> cash<br />
out‡ows <strong>of</strong> <strong>the</strong> bank, given <strong>the</strong> sometimes intricate day count rules that apply to <strong>the</strong> advertised<br />
rates <strong>and</strong> given <strong>the</strong> presence <strong>of</strong> <strong>the</strong> growth <strong>and</strong> loyalty premium rules. Fur<strong>the</strong>rmore, <strong>the</strong>y make it<br />
easier to integrate pre- <strong>and</strong> post-merger deposit rate data.<br />
Implicit deposit rate dynamics averaged across banks are re‡ected in <strong>the</strong> upper panels <strong>of</strong> Figure<br />
1. Deposit rates <strong>of</strong> both groups <strong>of</strong> banks have experienced a downward trend in <strong>the</strong> last decade.<br />
However, deposit rates <strong>of</strong> <strong>the</strong> medium-sized banks have been set above Big 4 bank deposit rates.<br />
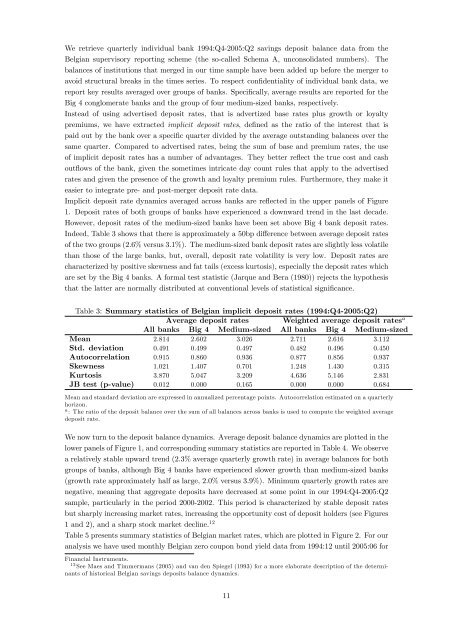
Indeed, Table 3 shows that <strong>the</strong>re is approximately a 50bp di¤erence between average deposit rates<br />
<strong>of</strong> <strong>the</strong> two groups (2.6% versus 3.1%). The medium-sized bank deposit rates are slightly less volatile<br />
than those <strong>of</strong> <strong>the</strong> large banks, but, overall, deposit rate volatility is very low. Deposit rates are<br />
characterized by positive skewness <strong>and</strong> fat tails (excess kurtosis), especially <strong>the</strong> deposit rates which<br />
are set by <strong>the</strong> Big 4 banks. A <strong>for</strong>mal test statistic (Jarque <strong>and</strong> Bera (1980)) rejects <strong>the</strong> hypo<strong>the</strong>sis<br />
that <strong>the</strong> latter are normally distributed at conventional levels <strong>of</strong> statistical signi…cance.<br />
Table 3: Summary statistics <strong>of</strong> Belgian implicit deposit rates (1994:Q4-2005:Q2)<br />
Average deposit rates Weighted average deposit rates a<br />
All banks Big 4 Medium-sized All banks Big 4 Medium-sized<br />
Mean 2.814 2.602 3.026 2.711 2.616 3.112<br />
Std. deviation 0.491 0.499 0.497 0.482 0.496 0.450<br />
Autocorrelation 0.915 0.860 0.936 0.877 0.856 0.937<br />
Skewness 1.021 1.407 0.701 1.248 1.430 0.315<br />
Kurtosis 3.870 5.047 3.209 4.636 5.146 2.831<br />
JB test (p-value) 0.012 0.000 0.165 0.000 0.000 0.684<br />
Mean <strong>and</strong> st<strong>and</strong>ard deviation are expressed in annualized percentage points. Autocorrelation estimated on a quarterly<br />
horizon.<br />
a : The ratio <strong>of</strong> <strong>the</strong> deposit balance over <strong>the</strong> sum <strong>of</strong> all balances across banks is used to compute <strong>the</strong> weighted average<br />
deposit rate.<br />
We now turn to <strong>the</strong> deposit balance dynamics. Average deposit balance dynamics are plotted in <strong>the</strong><br />
lower panels <strong>of</strong> Figure 1, <strong>and</strong> corresponding summary statistics are reported in Table 4. We observe<br />
a relatively stable upward trend (2.3% average quarterly growth rate) in average balances <strong>for</strong> both<br />
groups <strong>of</strong> banks, although Big 4 banks have experienced slower growth than medium-sized banks<br />
(growth rate approximately half as large, 2.0% versus 3.9%). Minimum quarterly growth rates are<br />
negative, meaning that aggregate deposits have decreased at some point in our 1994:Q4-2005:Q2<br />
sample, particularly in <strong>the</strong> period 2000-2002. This period is characterized by stable deposit rates<br />
but sharply increasing market rates, increasing <strong>the</strong> opportunity cost <strong>of</strong> deposit holders (see Figures<br />
1 <strong>and</strong> 2), <strong>and</strong> a sharp stock market decline. 12<br />
Table 5 presents summary statistics <strong>of</strong> Belgian market rates, which are plotted in Figure 2. For our<br />
analysis we have used monthly Belgian zero coupon bond yield data from 1994:12 until 2005:06 <strong>for</strong><br />
Financial Instruments.<br />
12 See Maes <strong>and</strong> Timmermans (2005) <strong>and</strong> van den Spiegel (1993) <strong>for</strong> a more elaborate description <strong>of</strong> <strong>the</strong> determinants<br />
<strong>of</strong> historical Belgian savings deposits balance dynamics.<br />
11