A multi-factor model for the valuation and risk management of ...
A multi-factor model for the valuation and risk management of ...
A multi-factor model for the valuation and risk management of ...

Create successful ePaper yourself
Turn your PDF publications into a flip-book with our unique Google optimized e-Paper software.
deposit premium<br />
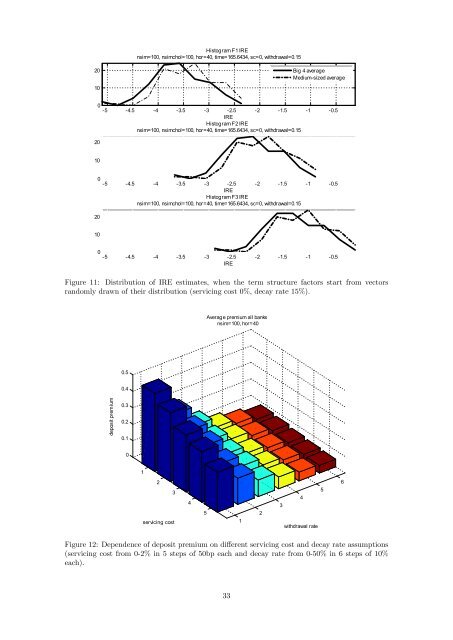
Histogram F1 IRE<br />
nsim=100, nsimchol=100, hor=40, time=165.6434, sc=0, withdrawal=0.15<br />
20<br />
10<br />
Big 4 average<br />
Medium-sized average<br />
0<br />
-5 -4.5 -4 -3.5 -3 -2.5 -2 -1.5 -1 -0.5<br />
IRE<br />
Histogram F2 IRE<br />
nsim=100, nsimchol=100, hor=40, time=165.6434, sc=0, withdrawal=0.15<br />
20<br />
10<br />
0<br />
-5 -4.5 -4 -3.5 -3 -2.5 -2 -1.5 -1 -0.5<br />
IRE<br />
Histogram F3 IRE<br />
nsim=100, nsimchol=100, hor=40, time=165.6434, sc=0, withdrawal=0.15<br />
20<br />
10<br />
0<br />
-5 -4.5 -4 -3.5 -3 -2.5 -2 -1.5 -1 -0.5<br />
IRE<br />
Figure 11: Distribution <strong>of</strong> IRE estimates, when <strong>the</strong> term structure <strong>factor</strong>s start from vectors<br />
r<strong>and</strong>omly drawn <strong>of</strong> <strong>the</strong>ir distribution (servicing cost 0%, decay rate 15%).<br />
Average premium all banks<br />
nsim=100, hor=40<br />
0.5<br />
0.4<br />
0.3<br />
0.2<br />
0.1<br />
0<br />
1<br />
2<br />
3<br />
servicing cost<br />
4<br />
5<br />
1<br />
2<br />
5<br />
4<br />
3<br />
withdrawal rate<br />
6<br />
Figure 12: Dependence <strong>of</strong> deposit premium on di¤erent servicing cost <strong>and</strong> decay rate assumptions<br />
(servicing cost from 0-2% in 5 steps <strong>of</strong> 50bp each <strong>and</strong> decay rate from 0-50% in 6 steps <strong>of</strong> 10%<br />
each).<br />
33