Annual Report 2009 UK - Bonfiglioli
Annual Report 2009 UK - Bonfiglioli
Annual Report 2009 UK - Bonfiglioli

You also want an ePaper? Increase the reach of your titles
YUMPU automatically turns print PDFs into web optimized ePapers that Google loves.
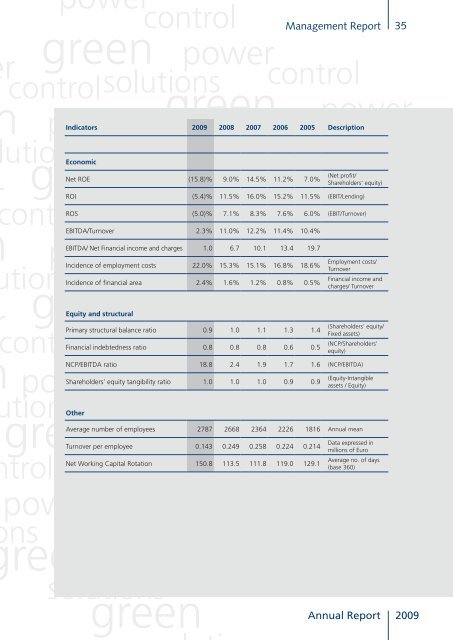
Management <strong>Report</strong><br />
Indicators <strong>2009</strong> 2008 2007 2006 2005 Description<br />
Economic<br />
Net ROE (15.8)% 9.0% 14.5% 11.2% 7.0%<br />
(Net profit/<br />
Shareholders’ equity)<br />
ROI (5.4)% 11.5% 16.0% 15.2% 11.5% (EBIT/Lending)<br />
ROS (5.0)% 7.1% 8.3% 7.6% 6.0% (EBIT/Turnover)<br />
EBITDA/Turnover 2.3% 11.0% 12.2% 11.4% 10.4%<br />
EBITDA/ Net Financial income and charges 1.0 6.7 10.1 13.4 19.7<br />
Incidence of employment costs 22.0% 15.3% 15.1% 16.8% 18.6%<br />
Incidence of financial area 2.4% 1.6% 1.2% 0.8% 0.5%<br />
Equity and structural<br />
Employment costs/<br />
Turnover<br />
Financial income and<br />
charges/ Turnover<br />
Primary structural balance ratio 0.9 1.0 1.1 1.3 1.4<br />
(Shareholders’ equity/<br />
Fixed assets)<br />
Financial indebtedness ratio 0.8 0.8 0.8 0.6 0.5 (NCP/Shareholders’<br />
equity)<br />
NCP/EBITDA ratio 18.8 2.4 1.9 1.7 1.6 (NCP/EBITDA)<br />
Shareholders’ equity tangibility ratio 1.0 1.0 1.0 0.9 0.9 (Equity-Intangible<br />
assets / Equity)<br />
Other<br />
Average number of employees 2787 2668 2364 2226 1816 <strong>Annual</strong> mean<br />
Turnover per employee 0.143 0.249 0.258 0.224 0.214<br />
Net Working Capital Rotation 150.8 113.5 111.8 119.0 129.1<br />
Data expressed in<br />
millions of Euro<br />
Average no. of days<br />
(base 360)<br />
35<br />
<strong>Annual</strong> <strong>Report</strong> <strong>2009</strong>