Annual Report 2009 UK - Bonfiglioli
Annual Report 2009 UK - Bonfiglioli
Annual Report 2009 UK - Bonfiglioli

Create successful ePaper yourself
Turn your PDF publications into a flip-book with our unique Google optimized e-Paper software.
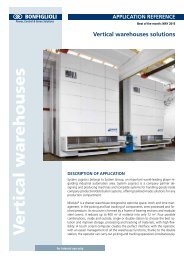
Management <strong>Report</strong><br />
2008 to 2.4% in <strong>2009</strong>, in line with 2008 in terms of absolute value, following the reduction in<br />
the cost of money and operations to reduce the Group’s indebtedness recorded since the second<br />
half of the year;<br />
• extraordinary income and charges had a debit balance for <strong>2009</strong>, their incidence on turnover<br />
standing at 1.7% as a result of provisions for future charges of other than an ordinary nature<br />
(allocations made by the Parent company against the reorganisation underway).<br />
At the level of the asset and liability structure of the Group, Net Working Capital fell sharply from<br />
209.2 to 167.4 M€ (-41.8 M€), due to a reduction in warehouse volumes and the effect of the de-<br />
crease in turnover on the mass of trade receivables and payables. Average rotation index suffered the<br />
consequences of the disproportionate decline in turnover.<br />
An important positive development worthy of mention is the fact that, in spite of the reduction in<br />
sales and the economic losses recorded, net cash position (overall financial indebtedness) improved<br />
from 177.9 to 170.9 M€ dropping by 7 M€, despite the negative economic trend. This was the result<br />
of the substantial recovery made by Net Working Capital, which is undoubtedly a very good result.<br />
Net investments amount to 18.8 M€ with details given below:<br />
Values in Euro/millions <strong>2009</strong> 2008 2007 2006 2005<br />
Land and buildings 2.5 16.1 16.3 12.1 13.5<br />
Plant and machinery 12.4 23.2 22.2 18.1 8.4<br />
Trade & industrial fixtures 4.9 8.0 7.8 5.5 2.9<br />
Other assets 0.8 2.9 2.0 1.0 1.8<br />
Assets in progress (3.1) (4.3) 4.6 (0.2) 7.0<br />
Tangible fixed assets 17.5 45.9 52.9 36.5 33.6<br />
Software, trademarks, patents 0.8 0.5 1.9 1.5 1.1<br />
Consolidation goodwill - 0.2 0.1 0.1 1.8<br />
Other 0.5 3.2 - 0.2 0.5<br />
Intangible fixed assets 1.3 3.9 2.0 1.8 3.4<br />
Total investments 18.8 49.8 54.9 38.3 37.0<br />
37<br />
<strong>Annual</strong> <strong>Report</strong> <strong>2009</strong>