Annual Report 2009 UK - Bonfiglioli
Annual Report 2009 UK - Bonfiglioli
Annual Report 2009 UK - Bonfiglioli

You also want an ePaper? Increase the reach of your titles
YUMPU automatically turns print PDFs into web optimized ePapers that Google loves.
<strong>Annual</strong> <strong>Report</strong> <strong>2009</strong><br />
power<br />
control<br />
green<br />
solutions<br />
<strong>Annual</strong> <strong>Report</strong> <strong>2009</strong>
power<br />
control<br />
green<br />
solutions<br />
<strong>Bonfiglioli</strong> Worldwide<br />
Europe<br />
Albania, Austria, Belgium, Bielorussia,<br />
Bulgaria, Cyprus, Croatia,<br />
Czech Republic, Denmark, Estonia,<br />
Finland, France, Holland, Hungary,<br />
Germany, Great Britain, Greece, Ireland,<br />
Italy, Lettonia, Lituania, Luxemburg,<br />
Malta, Montenegro, Norway, Poland,<br />
Portugal, Romania, Russia, Slovakian<br />
Republic, Serbia, Slovenia, Spain,<br />
Switzerland, Turkey, Ucraina<br />
Africa<br />
Algeria, Egypt, Kenya, Morocco,<br />
South Africa, Tunisia<br />
Asia<br />
Bahrain, China, Emirates, Japan,<br />
Jordan, Hong Kong, India, Indonesia,<br />
Iran, Israel, Kuwait, Malaysia, Oman,<br />
Pakistan, Philippine, Qatar, Saudi Arabia,<br />
Singapore, South Korea, Syria, Thailand,<br />
Taiwan, Vietnam<br />
North America<br />
Canada, United States<br />
Latin America<br />
Argentine, Bolivia, Brasil, Chile,<br />
Colombia, Costa Rica, Ecuador,<br />
Guatemala, Honduras, Mexico, Perù,<br />
Uruguay, Venezuela<br />
Oceania<br />
Australia, New Zealand<br />
<strong>Bonfiglioli</strong>, in its commitment to environmental preservation,<br />
has printed these pages on eco-friendly paper.
2<br />
power<br />
control<br />
green<br />
solutions<br />
<strong>2009</strong> <strong>Annual</strong> <strong>Report</strong>
“I must admit that we have made<br />
great progress in just fifty years.<br />
Our company has seen impressive growth<br />
and our products have won recognition<br />
for their quality worldwide.<br />
If I had to do it all again,<br />
I’d do it exactly as I did the first time round,<br />
because I had the full backing<br />
of management, my employees<br />
and my family.<br />
My wife and my children<br />
have always given me their full support,<br />
even in the most difficult times.<br />
They have always<br />
encouraged me to carry on.<br />
I have built up this company<br />
not just for my own satisfaction<br />
but for the future, for my family<br />
and for my employees,<br />
and to see our name, our brand,<br />
succeeding.<br />
So it’s still full speed ahead.”<br />
Clementino <strong>Bonfiglioli</strong><br />
April 2006<br />
on the occasion of company’s Fiftieth<br />
Anniversary<br />
3<br />
<strong>Annual</strong> <strong>Report</strong> <strong>2009</strong>
4<br />
power<br />
control<br />
green<br />
solutions<br />
<strong>2009</strong> <strong>Annual</strong> <strong>Report</strong>
<strong>Annual</strong> <strong>Report</strong> <strong>2009</strong><br />
5<br />
<strong>Annual</strong> <strong>Report</strong> <strong>2009</strong>
6<br />
power<br />
control<br />
green<br />
solutions<br />
<strong>2009</strong> <strong>Annual</strong> <strong>Report</strong>
Contents<br />
Financial Highlights<br />
<strong>Bonfiglioli</strong> Group<br />
Management <strong>Report</strong><br />
Consolidated Financial Statements as of December 31, <strong>2009</strong><br />
Notes to the consolidated financial statements<br />
Independent Auditors’ <strong>Report</strong><br />
7<br />
<strong>Annual</strong> <strong>Report</strong> <strong>2009</strong><br />
9<br />
19<br />
27<br />
53<br />
61<br />
101
8<br />
power<br />
control<br />
green<br />
solutions<br />
<strong>2009</strong> <strong>Annual</strong> <strong>Report</strong>
Financial Highlights<br />
9<br />
<strong>Annual</strong> <strong>Report</strong> <strong>2009</strong>
10<br />
power<br />
control<br />
green<br />
solutions<br />
Financial Highlights<br />
Group sales<br />
(Euro/Million)<br />
Net investments<br />
(Euro/Million)<br />
<strong>2009</strong> <strong>Annual</strong> <strong>Report</strong>
Financial Highlights<br />
EBITDA<br />
(Euro/Million)<br />
Group share<br />
of shareholders’ equity<br />
(Euro/Million)<br />
11<br />
<strong>Annual</strong> <strong>Report</strong> <strong>2009</strong>
12<br />
power<br />
control<br />
green<br />
solutions<br />
Sales<br />
by geographical area<br />
(Euro/Million)<br />
Number of employees<br />
<strong>2009</strong> <strong>Annual</strong> <strong>Report</strong>
Financial Highlights<br />
Actions and prospects for the future - The Industrial Plan<br />
In response to the recent dramatic and global economic crisis, <strong>Bonfiglioli</strong> Group initiated a number of<br />
actions to build stronger organisational and structural foundations for the future. These actions were<br />
described in the Industrial Plan that the Board of Directors approved during <strong>2009</strong>.<br />
The Board’s intention was to use these tough times as an opportunity to begin a process of rapid in-<br />
ternal rationalisation in order to recover and improve efficiency. The Board was, of course, well aware<br />
that some of these actions would take time to bear fruit.<br />
Various actions were begun in <strong>2009</strong>, with the main objectives of improving our managerial skills,<br />
raising levels of responsibility within the company and focusing on the businesses of most importance<br />
to the Group. This latter objective was particularly important given the dimensions and complexity<br />
that the Group has reached in the last five business years.<br />
The key actions of our Three Year Business Plan (for <strong>2009</strong> - 2011) focus on the following strategic<br />
areas:<br />
1. Markets, businesses and products<br />
2. Structure and production processes<br />
3. Organisation and human resources<br />
One of the first projects we put in place was to redefine our organisation’s macro-structure, sim-<br />
plifying it and focusing on the Business Units to which we have assigned our specialist production<br />
plants. In particular, the following two Business Units were set up, for a better customer oriented<br />
service:<br />
• BU “Mobile & Wind” whose core business is represented by products from <strong>Bonfiglioli</strong> range for<br />
customers of Construction and Wind sectors (BU MWS);<br />
• BU “Industrial & Photovoltaic” dedicated to products from <strong>Bonfiglioli</strong> range for customers of Indu-<br />
strial sector (light and medium-heavy industry) and Photovoltaic sector (BU IPV).<br />
This re-organisation and streamlining of our organisation has generated immediate benefits, raised<br />
the level of responsibility of our entire management, and increased the efficiency of our internal<br />
decision-making and operational processes.<br />
13<br />
<strong>Annual</strong> <strong>Report</strong> <strong>2009</strong>
14<br />
power<br />
control<br />
green<br />
solutions<br />
We then looked carefully at the rapidly expanding Green Economy, allocated specific new resources<br />
to the continuous development of new products and made major investments in the people and<br />
structures needed to serve the leading markets of Europe, America and Asia and to reinforce our<br />
dedicated pre-sales and after-sales services.<br />
Among the many actions initiated or scheduled in the Industrial Plan, those involving the re-enginee-<br />
ring of our industrial processes along lean production lines represent one of the largest undertakings<br />
in which our Group is involved today, in both organisational and investment terms. We need to<br />
respond more rapidly to continuous fluctuations in the market and we also need to reduce product<br />
development times, improve overall stock levels and boost real operation flexibility, not only in those<br />
countries where we have located our main production operations (currently Italy, India, Vietnam, Slo-<br />
vakia and Germany) but also in countries where we operate through local market service subsidiaries.<br />
These needs are now fully occupying all levels of management and operations within our Group and<br />
are creating a new corporate culture throughout our organisation. The changes we need to make are<br />
big ones and our new culture requires the re-engineering of all the processes along our supply chain<br />
if we are to ensure constant and radical improvements in the service and product quality we offer.<br />
This is the driving force behind all current activities and the most important challenge facing us if we<br />
are to succeed in coming years.<br />
The following figures illustrate the principal targets in our Industrial Plan and also show what im-<br />
provements have already been achieved in the Plan’s first year (<strong>2009</strong>) with respect to early estimates<br />
made half way through that year. These improvements on the Plan’s initial figures have continued<br />
into the first half of 2010 and have led to our starting activities to draw up a new Business Plan for<br />
implementation in our next business year, 2011.<br />
<strong>2009</strong> <strong>Annual</strong> <strong>Report</strong>
Financial Highlights<br />
Total<br />
consolidated<br />
sales<br />
(Euro/Million)<br />
EBITDA<br />
(Euro/Million)<br />
Actual<br />
Business Plan<br />
15<br />
<strong>Annual</strong> <strong>Report</strong> <strong>2009</strong>
16<br />
power<br />
control<br />
green<br />
solutions<br />
Net Sales Business Unit<br />
Insustrial Photovoiltaic<br />
(BUIPV)<br />
(Euro/Million)<br />
Net Sales Business Unit<br />
Mobile Wind<br />
(BUMWS)<br />
(Euro/Million)<br />
Actual<br />
Business Plan<br />
<strong>2009</strong> <strong>Annual</strong> <strong>Report</strong>
Financial Highlights<br />
17<br />
<strong>Annual</strong> <strong>Report</strong> <strong>2009</strong>
18<br />
power<br />
control<br />
green<br />
solutions<br />
<strong>2009</strong> <strong>Annual</strong> <strong>Report</strong>
<strong>Bonfiglioli</strong> Group<br />
19<br />
<strong>Annual</strong> <strong>Report</strong> <strong>2009</strong>
20<br />
power<br />
control<br />
green<br />
solutions<br />
<strong>Bonfiglioli</strong> Group as of December 31, <strong>2009</strong><br />
Tecnoingranaggi Riduttori srl<br />
Italy<br />
<strong>Bonfiglioli</strong> Transmission PVT Ltd<br />
India<br />
<strong>Bonfiglioli</strong> Slovakia sro<br />
Slovak Republic<br />
<strong>Bonfiglioli</strong> Vietnam Ltd<br />
Vietnam<br />
<strong>Bonfiglioli</strong> Vectron GmbH<br />
Germany<br />
<strong>2009</strong> <strong>Annual</strong> <strong>Report</strong><br />
<strong>Bonfiglioli</strong> Riduttori S.p.A.<br />
100%<br />
100%<br />
100%<br />
80%<br />
100%<br />
100%<br />
67%<br />
100%<br />
97% 74%<br />
100%<br />
<strong>Bonfiglioli</strong> Transmissions S.A.<br />
France<br />
<strong>Bonfiglioli</strong> <strong>UK</strong> Ltd<br />
United Kingdom<br />
<strong>Bonfiglioli</strong> Skandinavien AB<br />
Sweden<br />
<strong>Bonfiglioli</strong> Italia S.p.A.<br />
Italy<br />
100% 1%<br />
<strong>Bonfiglioli</strong> Power Transmissions &<br />
Automation Technologies Jsc<br />
Turkey<br />
<strong>Bonfiglioli</strong> Deutschland GmbH<br />
Germany<br />
<strong>Bonfiglioli</strong> Österreich GmbH<br />
Austria
<strong>Bonfiglioli</strong> Canada Inc<br />
Canada<br />
<strong>Bonfiglioli</strong> USA Inc<br />
USA<br />
<strong>Bonfiglioli</strong> Drives<br />
(Shanghai) Co Ltd<br />
China<br />
<strong>Bonfiglioli</strong> Transmission<br />
(Aust.) PTY Ltd<br />
Australia<br />
<strong>Bonfiglioli</strong> Redutores do Brasil<br />
Industria e Comercio Ltda<br />
Brazil<br />
<strong>Bonfiglioli</strong> Power Transmission<br />
PTY Ltd<br />
South Africa<br />
75%<br />
<strong>Bonfiglioli</strong> South Africa<br />
PTY Ltd<br />
South Africa<br />
100%<br />
100%<br />
100%<br />
100%<br />
70%<br />
75%<br />
33,33%<br />
15%<br />
10%<br />
<strong>Bonfiglioli</strong> Group<br />
Tecnotrans <strong>Bonfiglioli</strong> S.A.<br />
Spain<br />
Omega Endustriel Limited<br />
Turkey<br />
B.E.S.T. Hellas S.A.<br />
Greece<br />
Production Plants<br />
Commercial Subsidiaries Europe<br />
Commercial Subsidiaries Overseas<br />
Associated companies<br />
Other companies<br />
21<br />
<strong>Annual</strong> <strong>Report</strong> <strong>2009</strong>
22<br />
power<br />
control<br />
green<br />
solutions<br />
HEADQUARTERS<br />
BONFIGLIOLI RIDUTTORI S.p.A.<br />
Via Giovanni XXIII, 7/A<br />
40012 Lippo di Calderara di Reno<br />
Bologna (ITALY)<br />
Tel. (+39) 051 6473111<br />
Fax (+39) 051 6473126<br />
www.bonfiglioli.com<br />
bonfiglioli@bonfiglioli.com<br />
AUSTRALIA<br />
BONFIGLIOLI TRANSMISSION (Aust) Pty Ltd.<br />
2, Cox Place Glendenning NSW 2761 (Australia)<br />
Locked Bag 1000 Plumpton NSW 2761<br />
Tel. (+ 61) 2 8811 8000 - Fax (+ 61) 2 9675 6605<br />
www.bonfiglioli.com.au - sales@bonfiglioli.com.au<br />
AUSTRIA<br />
BONFIGLIOLI ÖSTERREICH GmbH<br />
Molkereistr 4 - A-2700 Wiener Neustadt<br />
Tel. (+43) 02622 22400 - Fax (+43) 02622 22386<br />
www.bonfiglioli.at - info@bonfiglioli.at<br />
BRAZIL<br />
BONFIGLIOLI REDUTORES DO BRASIL INDÚSTRIA E COMÉRCIO LTDA.<br />
Travessa Cláudio Armando 171 - Bloco 3 - CEP 09861-730<br />
Bairro Assunção - São Bernardo do Campo - São Paulo (Brasil)<br />
Tel. (+55) 11 4344 1900 - Fax (+55) 11 4344 1906<br />
www.bonfigliolidobrasil.com.br - bonfiglioli@bonfigliolidobrasil.com.br<br />
CANADA<br />
BONFIGLIOLI CANADA INC.<br />
2-7941 Jane Street - Concord, Ontario L4K 4L6<br />
Tel. (+1) 905 7384466 - Fax (+1) 905 7389833<br />
www.bonfigliolicanada.com - sales@bonfigliolicanada.com<br />
CHINA<br />
BONFIGLIOLI DRIVES (SHANGHAI) CO. LTD.<br />
19D, No. 360 Pudong Road (S)<br />
New Shanghai International Tower - 200120 Shanghai (P.R. China)<br />
Tel. (+86) 21 69225500 - Fax (+86) 21 69225511<br />
www.bonfiglioli.cn - bds@bonfiglioli.com.cn<br />
<strong>2009</strong> <strong>Annual</strong> <strong>Report</strong><br />
FRANCE<br />
BONFIGLIOLI TRANSMISSIONS S.A.<br />
14 Rue Eugène Pottier BP 19<br />
Zone Industrielle de Moimont II - 95670 Marly la Ville<br />
Tel. (+33) 1 34474510 - Fax (+33) 1 34688800<br />
www.bonfiglioli.fr - btf@bonfiglioli.fr<br />
GERMANY<br />
BONFIGLIOLI DEUTSCHLAND Gmbh<br />
Sperberweg 12 - 41468 Neuss<br />
Tel. (+49) 02131 2988-0 - Fax (+49) 02131 2988-100<br />
www.bonfiglioli.de - info@bonfiglioli.de<br />
BONFIGLIOLI VECTRON GmbH<br />
Europark Fichtenhain B6 - 47807 Krefeld - Germany<br />
Tel. +49 (0) 2151 8396 0 - Fax +49 (0) 2151 8396 999<br />
www.vectron.net - info@vectron.net<br />
GREAT BRITAIN<br />
BONFIGLIOLI <strong>UK</strong> Ltd<br />
Industrial Equipment - Unit 7, Colemeadow Road<br />
North Moons Moat - Redditch, Worcestershire B98 9PB<br />
Tel. (+44) 1527 65022 - Fax (+44) 1527 61995<br />
www.bonfiglioli.co.uk - uksales@bonfiglioli-uk.com<br />
Mobile Equipment<br />
3- 7 Grosvenor Grange, Woolston, Warrington - Cheshire WA1 4SF<br />
Tel. (+44) 1925 852667 - Fax (+44) 1925 852668<br />
www.bonfiglioli.co.uk - sales@bonfiglioli.co.uk<br />
INDIA<br />
BONFIGLIOLI TRANSMISSIONS PVT Ltd.<br />
PLOT AC7-AC11 Sidco Industrial Estate - Thirumudivakkam - Chennai 600 044<br />
Tel. +91(0) 44 24781035 / 24781036 / 24781037<br />
Fax +91(0) 44 24780091 / 24781904<br />
www.bonfiglioliindia.com - info@bonfiglioliin.com
ITALY<br />
BONFIGLIOLI ITALIA S.p.A.<br />
Via Sandro Pertini lotto 7b - 20080 Carpiano (Milano)<br />
Tel. (+39) 02 985081 - Fax (+39) 02 985085817<br />
www.bonfiglioli.it - customerservice.italia@bonfiglioli.it<br />
TECNOINGRANAGGI RIDUTTORI s.r.l.<br />
via Davia, 5 - S. Giovanni in Persiceto - 40017 (Bologna) Italy<br />
Tel. +39 0516878111 - Fax +39 0516878132<br />
www.tecnoingranaggi.it - info@tecnoingranaggi.it<br />
SLOVAKIA REPUBLIC<br />
BONFIGLIOLI SLOVAKIA s.r.o.<br />
Robotnícka 2129 - 017 01 Považská Bystrica<br />
Tel. (+421) 0 42 430 75 64 - Fax: (+421) 0 42 430 75 89<br />
SPAIN<br />
TECNOTRANS BONFIGLIOLI S.A.<br />
Pol. Ind. Zona Franca sector C, calle F, n°6 08040 Barcelona<br />
Tel. (+34) 93 4478400 - Fax (+34) 93 3360402<br />
www.tecnotrans.com - tecnotrans@tecnotrans.com<br />
SOUTH AFRICA<br />
BONFIGLIOLI POWER TRANSMISSION Pty Ltd.<br />
55 Galaxy Avenue, Linbro Business Park - Sandton<br />
Tel. (+27) 11 608 2030 OR - Fax (+27) 11 608 2631<br />
www.bonfiglioli.co.za - bonfigsales@bonfiglioli.co.za<br />
SWEDEN<br />
BONFIGLIOLI SKANDINAVIEN AB<br />
Koppargatan 8 - 234 35 Lomma, Sweden<br />
Tel. (+46) 40-41 82 30 - Fax (+46) 40-41 45 08<br />
www.bonfiglioli.se - info@bonfiglioli.se<br />
TURKEY<br />
BONFIGLIOLI TURKIYE<br />
Atatürk Organíze Sanayi Bölgesi, 10015 Sk. No: 17, Çigli - Izmir<br />
Tel. +90 (0) 232 328 22 77 (pbx) - Fax +90 (0) 232 328 04 14<br />
www.bonfiglioli.com.tr - info@bonfiglioli.com.tr<br />
USA<br />
BONFIGLIOLI USA, INC.<br />
3541 Hargrave Drive Hebron, Kentucky 41048<br />
Tel. (+1) 859 334 3333 - Fax (+1) 859 334 8888<br />
www.bonfiglioliusa.com<br />
industrialsales@bonfiglioliusa.com - mobilesales@bonfiglioliusa.com<br />
VIETNAM<br />
BONFIGLIOLI VIETNAM LTD.<br />
Lot C-9D-CN My Phuoc Industrial Park 3 - Ben Cat<br />
Binh Duong Province - Vietnam<br />
Tel. (+84) 650 3577411 - Fax (+84) 650 3577422<br />
salesvn@bonfiglioli.com - www.bonfiglioli.vn<br />
<strong>Bonfiglioli</strong> Group<br />
23<br />
<strong>Annual</strong> <strong>Report</strong> <strong>2009</strong>
24<br />
power<br />
control<br />
green<br />
solutions<br />
Corporate bodies<br />
Board of Directors<br />
Clementino <strong>Bonfiglioli</strong> - Chairman<br />
Luisa Luisardi - Vice Chairman<br />
Sonia <strong>Bonfiglioli</strong> - CEO<br />
Luciano <strong>Bonfiglioli</strong> - Director<br />
Roberto Megna - Director<br />
Statutory Auditors<br />
Monica Marisaldi<br />
Alessandro Gualtieri<br />
Giacomo Iannelli<br />
Independent Auditors<br />
PricewaterhouseCoopers<br />
Executive commettee<br />
Sonia <strong>Bonfiglioli</strong> - CEO<br />
Fausto Carboni - General Manager BUMWS<br />
Guglielmo Iodice - General Manager BUIPV Operation<br />
Massimo Sarti - General Manager BUIPV Product<br />
Tiziano Pacetti - C.F.O.<br />
Stefano Rizzo - Corporate Director Purchasing and Marketing<br />
<strong>2009</strong> <strong>Annual</strong> <strong>Report</strong>
Local Management<br />
Malcolm Lewis - <strong>Bonfiglioli</strong> Transmission PTY Ltd (Australia)<br />
Manfredi Ucelli Di Nemi - <strong>Bonfiglioli</strong> Redutores do Brasil Industria e Comercio Ltda (Brazil)<br />
Greg Shulte - <strong>Bonfiglioli</strong> Canada & USA Inc. (Canada and U.S.A)<br />
Jason Wang - <strong>Bonfiglioli</strong> Drives (Shanghai) Co.Ltd. (China)<br />
Gilbert Khawam - <strong>Bonfiglioli</strong> Transmissions S.A. (France)<br />
Thomas Becker - <strong>Bonfiglioli</strong> Deutschland GmbH (Germany)<br />
Siegfried Stadtfeld - <strong>Bonfiglioli</strong> Vectron GmbH (Germany)<br />
John Adair - <strong>Bonfiglioli</strong> <strong>UK</strong> Ltd Mobile & Wind equipment (Grait Britain)<br />
Mike Mccan - <strong>Bonfiglioli</strong> <strong>UK</strong> Ltd Industrial equipment (Grait Britain)<br />
M. Ganesh - <strong>Bonfiglioli</strong> Transmissions PVT. Ltd. Mobile & Wind equipment (India)<br />
PL. Muthusekkar - <strong>Bonfiglioli</strong> Transmissions PVT. Ltd. Industrial equipment (India)<br />
Rajat Vashisht - <strong>Bonfiglioli</strong> Italia S.p.A. (Italy)<br />
Massimo Sarti - Tecnoingranaggi Riduttori s.r.l. (Italy)<br />
Marek Kolarik - <strong>Bonfiglioli</strong> Slovakia s.r.o (Slovakia)<br />
David Bassas - Tecnotrans <strong>Bonfiglioli</strong> S.A. (Spain)<br />
Robert Rohman - <strong>Bonfiglioli</strong> Power Transmission PTY Ltd. (South Africa)<br />
Thomas Dedering - <strong>Bonfiglioli</strong> Skandinavien AB (Sweden)<br />
Sonia <strong>Bonfiglioli</strong> a.i. - <strong>Bonfiglioli</strong> Turkiye (Turkey)<br />
Luigi Galimberti - <strong>Bonfiglioli</strong> Vietnam Ltd. (Vietnam)<br />
25<br />
<strong>Annual</strong> <strong>Report</strong> <strong>2009</strong>
26<br />
power<br />
control<br />
green<br />
solutions<br />
<strong>2009</strong> <strong>Annual</strong> <strong>Report</strong>
Management <strong>Report</strong><br />
(The Management <strong>Report</strong> has been translated into the English language<br />
solely for the convenience of international readers)<br />
27<br />
<strong>Annual</strong> <strong>Report</strong> <strong>2009</strong>
28<br />
power<br />
control<br />
green<br />
solutions<br />
Management report<br />
Foreword<br />
This management report, drawn up in compliance with the provisions of Legislative Decree 127/1991,<br />
integrated and interpreted on the basis of CNDC (Italian National Councils of Chartered Accountants)<br />
accounting principles, updated by the OIC (Italian Accounting Authority), is submitted as a comment<br />
on the results recorded in the consolidated financial statement of <strong>Bonfiglioli</strong> Group.<br />
Unless otherwise indicated, data are shown in Euro/millions.<br />
Reference Economic Situation<br />
In <strong>2009</strong> expansion of the world economy came to a standstill and settled at a negative growth rate<br />
of 0.6% compared with + 3% in 2008. The effects of the global financial crisis on the real economy<br />
were felt violently in the first half of <strong>2009</strong>. The heavy reduction in the value of wealth, the slowdown<br />
of credit, the reduction in consumer and business confidence brought demand and production to a<br />
standstill in advanced economies, where significant numbers of jobs were lost. Almost all the leading<br />
developed economies recorded falls in GDP and the first signs of recovery were only felt in the second<br />
half of the year. Business in all developed economies was supported by expansive currency and fiscal<br />
policies; in some cases reconstitution of stocks offered manufacturing temporary support. Consum-<br />
ption came to a standstill due to the high level of unemployment, and investments due to uncertainty<br />
and by large margins of unutilised capacity. In the main emerging economies, on the other hand,<br />
growth continued to be supported by the robust dynamics of domestic demand. Tensions on interna-<br />
tional financial markets relaxed and the restriction of bank credit became less intense. Although the<br />
price of oil and other raw materials are rising again gradually, inflation is still moderate, partly due to<br />
a large number of unutilised resources.<br />
As regards individual geographical areas, in <strong>2009</strong> the GDP of the Euro area suffered a 4.1% decline<br />
compared to the 0.6% growth recorded in 2008. With the recovery of international trade economic<br />
activity in the area was restricted by the persistent weakness of domestic demand.<br />
The Italian GDP fell slightly in the fourth quarter of <strong>2009</strong>. Faced with a stagnation in consumption<br />
and a further decline in investments, exports did not confirm the slight recovery of the third quarter.<br />
During the second half of the year economic activity recorded modest expansion with respect to the<br />
previous half of the year, bringing <strong>2009</strong> to a close with a negative expansion rate of -5% (-1.3%<br />
in 2008). Faced with this persistent weakness in internal demand, the dynamism demonstrated by<br />
exports have to date been adequate to bring growth back to high levels.<br />
<strong>2009</strong> <strong>Annual</strong> <strong>Report</strong>
Management <strong>Report</strong><br />
The United States GDP during the fourth quarter of <strong>2009</strong> rose by 5.6 from 2.2 in the previous quarter<br />
(both at an annual rate). The acceleration is more or less attributable entirely to the dynamism of<br />
stocks as both private consumption and foreign trade have had a limited impact on the dynamism of<br />
the GDP. The year <strong>2009</strong> closed with a negative growth rate on the USA GDP of -2.4%.<br />
Even in the United Kingdom the decline in economic activity slowed during the fourth quarter of<br />
<strong>2009</strong> after six consecutive quarters of negative rates. At the end of <strong>2009</strong> the negative growth of<br />
British GDP settled at -4.9% (+0.5 at the end of 2008).<br />
In Japan the economy in <strong>2009</strong> recorded a reduction in GDP growth of -5.2% (-1.2% at the end of<br />
2008).<br />
The fall in world demand and the reduced flow of foreign capital slowed down the main emerging<br />
economies, whose expansion rates in some cases took a downward turn (Russia and Brazil). The<br />
growth rates in China (+8.7%) and India (+5.7%) remained positive in <strong>2009</strong> however.<br />
During the first quarter of 2010 global recovery is picking up speed. The reconstitution of stocks will<br />
continue to provide a stronger boost in all areas, hand in hand with consumption, though in a less<br />
uniform manner (stronger in emerging economies). In some countries the conditions required to start<br />
the investments cycle for machinery are being created. The manufacturing sector, the most affected by<br />
the crisis, is now the driving force: the relevant indexes have reached the highest multi-year figures (in<br />
April in the Euro area 61.3, the highest in nearly 10 years); services are tagging along and are picking<br />
up speed. The Italian economy is still giving contradictory signals (as shown by the drop in turnover<br />
and orders), but is latching onto reawakening foreign demand: export is livelier, industrial production<br />
is increasing especially in the current quarter. GDP growth, taking into account the likely rise in esti-<br />
mates for the last quarter of <strong>2009</strong>, will be much higher than expected. The level of activity in Italy is<br />
however still quite low forcing companies to resort to the Layoff Benefits Fund. In general, the labour<br />
market is still weak, which penalises the confidence and spending of families. There remain extremely<br />
fragile elements making the global scenario uncertain. Firstly, in the financial system where indictment<br />
of Goldman Sachs pairs with the case of Greece highlighting questions remaining unresolved. Inte-<br />
rest rates will continue to be kept low. All the more so that, energy and food aside, retail prices are<br />
sluggish. In the meantime increases in raw materials crush margins recorded by businesses and the<br />
purchasing power of families. The exchange rates of Asian currencies will tend to appreciate following<br />
the revaluation of the Chinese Yuan recently announced. The International Monetary Fund (IMF) has<br />
estimated a 4.2% growth in the global economy for 2010, forecasting an additional + 4.3% for 2011.<br />
29<br />
<strong>Annual</strong> <strong>Report</strong> <strong>2009</strong>
30<br />
power<br />
control<br />
green<br />
solutions<br />
The recovery in the USA is already creating jobs. The number of employed workers rose in March, the<br />
first statistically meaningful rise since November 2007. Industrial production has risen to the highest<br />
level since December 2008 (+0.1% in March) and the rise in orders anticipates further increases.<br />
The housing market is again giving positive signals. The Federal Reserve has confirmed the objective<br />
interval for interest rates between 0.0 and 0.25 percent, reaffirming its intention to maintain a highly<br />
expansive stance for a long period of time. For the US economy the IMF estimates forecast a growth<br />
in the GDP of 3.1% for 2010 and 2.6% in 2011.<br />
Cyclical indicators are showing signs of an improvement in the first part of the year for Japan and the<br />
United Kingdom. The forecasts have been revised upward with GDP growth in 2010 of 1.3% and<br />
1.9% respectively.<br />
Growth forecasts for emerging economies have been revised upward. In the most recent IMF valua-<br />
tions China and India should record expansion rates in 2010 of 10% and 8.8% respectively, while<br />
Brazil and Russia should record a growth of 5.5% and 4.0%.<br />
In the first quarter of 2010 economic activity in the Euro area has continued to draw support from the<br />
recovery of international trade, and has benefited from the depreciation of the single currency. In the<br />
first months of the year the index of industrial production in the area grew by 2.4% in cyclical terms.<br />
IMF forecasts indicate a 1% growth in the area for 2010 which should increase to 1.5% in 2011%.<br />
As regards Italy, in January of this year Italian exports showed stronger signs of recovery. According<br />
to IMF forecasts, Italy should see a growth of 1.5% in 2010 and 1.8% in 2011.<br />
Area of consolidation<br />
The area of consolidation as at 31 st December <strong>2009</strong> covers a total of nineteen subsidiaries, including:<br />
• five manufacturing companies (located in Italy, India, Germany, Slovakia, and Vietnam), which<br />
produce the various products in <strong>Bonfiglioli</strong>’s extensive range.<br />
• thirteen sales subsidiaries that manage promotion, sales, pre- and after-sales assistance, logistics<br />
and customisation, and final assembly of the Group’s products, together with “<strong>Bonfiglioli</strong> Power<br />
Transmission Pty Ltd” that has a 75% majority holding in the South African subsidiary<br />
The only associated company of <strong>Bonfiglioli</strong> Group is a commercial branch that has been operating<br />
on the Spanish market for 40 years, Tecnotrans <strong>Bonfiglioli</strong> S.A., in which the Group holds a 33.33%<br />
stake.<br />
With reference to the changes during the corporate year, we point out the incorporation of the<br />
<strong>2009</strong> <strong>Annual</strong> <strong>Report</strong>
company <strong>Bonfiglioli</strong> Österreich GmbH, fully controlled by <strong>Bonfiglioli</strong> Deutschland GmbH. At 31 st De-<br />
cember <strong>2009</strong> the company was still not operational.<br />
Management <strong>Report</strong><br />
31<br />
<strong>Annual</strong> <strong>Report</strong> <strong>2009</strong>
32<br />
power<br />
control<br />
green<br />
solutions<br />
Analysis of <strong>2009</strong> results<br />
In keeping with the amended provisions of art. 2428 of the Italian Civil Code, the layouts for the<br />
Balance Sheet and Income Statement are set out below, reclassified with regard to the last five years’<br />
operations conducted by the Group. The schemes set out below contain absolute data and percen-<br />
tage data, as well as the principle financial and non-financial result indicators.<br />
<strong>2009</strong> <strong>Annual</strong> <strong>Report</strong><br />
Values<br />
Reclassified income statement <strong>2009</strong> 2008 2007 2006 2005<br />
TURNOVER 399.8 663.5 609.9 498.6 387.8<br />
Cost of sales (335.3) (513.2) (464.6) (379.5) (293.4)<br />
GROSS MARGIN 64.5 150.3 145.3 119.1 94.4<br />
Structure and operating expenses (84.5) (103.1) (94.4) (81.3) (71.0)<br />
EBIT (20.0) 47.3 50.9 37.8 23.4<br />
Financial income and charges (9.5) (10.9) (7.3) (4.2) (2.1)<br />
Exchange rate differences (1.2) (1.8) (0.2) (0.3) (0.1)<br />
Associated companies’ result (0.4) 0.9 0.5 0.3 0.2<br />
Extraordinary income and expenses (7.3) (1.8) 1.8 (0.3) 0.2<br />
EBT (38.4) 33.7 45.7 33.3 21.6<br />
Current taxes (3.3) (16.5) (20.8) (17.2) (12.1)<br />
Prepaid and deferred taxes 10.0 5.1 1.5 2.2 1.0<br />
CONSOLIDATED PROFIT/LOSS (31.8) 22.2 26.3 18.2 10.5<br />
Minority (0.2) (1.3) (0.7) (1.0) (0.9)<br />
NET GROUP PROFIT/LOSS (32.0) 20.9 25.6 17.2 9.6<br />
Personnel costs (88.0) (101.6) (91.9) (83.6) (72.2)<br />
Depreciation & other provisions (29.1) (25.7) (23.4) (19.0) (17.2)<br />
EBITDA 9.1 73.0 74.3 56.8 40.5
Management <strong>Report</strong><br />
% of Turnover<br />
Reclassified income statement <strong>2009</strong> 2008 2007 2006 2005<br />
TURNOVER 100.0% 100.0% 100.0% 100.0% 100.0%<br />
Cost of sales (89.3)% (77.3)% (76.2)% (76.1)% (75.7)%<br />
GROSS MARGIN 16.1% 22.7% 23.8% 23.9% 24.3%<br />
Structure and operating expenses (21.1)% (15.5)% (15.5)% (16.3)% (18.3)%<br />
EBIT (5.0)% 7.1% 8.3% 7.6% 6.0%<br />
Financial income and charges (2.4)% (1.6)% (1.2)% (0.8)% (0.5)%<br />
Exchange rate differences (0.3)% (0.3)% 0.0% (0.1)% 0.0%<br />
Associated companies’ result (0.1)% 0.1% 0.1% 0.1% 0.0%<br />
Extraordinary income and expenses (1.8)% (0.3)% 0.3% (0.1)% 0.1%<br />
EBT (9.6)% 5.1% 7.5% 6.7% 5.6%<br />
Current taxes (0.8)% (2.5)% (3.4)% (3.4)% (3.1)%<br />
Prepaid and deferred taxes 2.5% 0.8% 0.2% 0.4% 0.3%<br />
CONSOLIDATED PROFIT/LOSS (7.9)% 3.3% 4.3% 3.7% 2.7%<br />
Minority (0.1)% (0.2)% (0.1)% (0.2)% (0.2)%<br />
NET GROUP PROFIT/LOSS (8.0)% 3.2% 4.2% 3.4% 2.5%<br />
Personnel costs (22.0)% (15.3)% (15.1)% (16.8)% (18.6)%<br />
Depreciation & other provisions (7.3)% (3.9)% (3.8)% (3.8)% (4.4)%<br />
EBITDA 2.3% 11.0% 12.2% 11.4% 10.4%<br />
33<br />
<strong>Annual</strong> <strong>Report</strong> <strong>2009</strong>
34<br />
power<br />
control<br />
green<br />
solutions<br />
<strong>2009</strong> <strong>Annual</strong> <strong>Report</strong><br />
Values<br />
Reclassified balance sheet <strong>2009</strong> 2008 2007 2006 2005<br />
Net Working Capital 167.4 209.2 189.4 164.9 139.1<br />
Fixed assets 222.9 229.2 158.3 122.9 102.5<br />
Other invested capital (12.5) (23.1) (28.1) (32.2) (31.5)<br />
Minority (4.0) (4.1) (2.2) (6.8) (6.3)<br />
Capital employed 373.9 411.1 317.3 248.8 203.8<br />
Group shareholders’ equity 203.0 233.2 177.1 153.7 138.5<br />
Net Cash Position 170.9 177.9 140.3 95.0 65.3<br />
Funds 373.9 411.1 317.3 248.8 203.8<br />
average rotation days (base 360)<br />
Reclassified balance sheet <strong>2009</strong> 2008 2007 2006 2005<br />
Net Working Capital 150.8 113.5 111.8 119.0 129.1<br />
Fixed assets 200.8 124.3 93.5 88.8 95.1<br />
Other invested capital (11.3) (12.6) (16.6) (23.3) (29.3)<br />
Minority (3.6) (2.2) (1.3) (4.9) (5.8)<br />
Capital employed 336.7 223.1 187.3 179.6 189.2<br />
Group shareholders’ equity 182.8 126.5 104.5 111.0 128.6<br />
Net Cash Position 153.9 96.5 82.8 68.6 60.6<br />
Funds 336.7 223.1 187.3 179.6 189.2<br />
Values<br />
Turnover by geographical area <strong>2009</strong> 2008 2007 2006 2005<br />
Italy 74.0 166.6 164.6 145.2 120.3<br />
Europe 151.9 283.8 270.0 229.0 175.3<br />
Overseas 173.9 213.1 175.3 124.4 92.2<br />
Total turnover 399.8 663.5 609.9 498.6 387.8<br />
% of Turnover<br />
Turnover by geographical area <strong>2009</strong> 2008 2007 2006 2004<br />
Italy 18.5% 25.1% 27.0% 29.1% 33.6%<br />
Europe 38.0% 42.8% 44.3% 45.9% 45.2%<br />
Overseas 43.5% 32.1% 28.7% 24.9% 21.1%
Management <strong>Report</strong><br />
Indicators <strong>2009</strong> 2008 2007 2006 2005 Description<br />
Economic<br />
Net ROE (15.8)% 9.0% 14.5% 11.2% 7.0%<br />
(Net profit/<br />
Shareholders’ equity)<br />
ROI (5.4)% 11.5% 16.0% 15.2% 11.5% (EBIT/Lending)<br />
ROS (5.0)% 7.1% 8.3% 7.6% 6.0% (EBIT/Turnover)<br />
EBITDA/Turnover 2.3% 11.0% 12.2% 11.4% 10.4%<br />
EBITDA/ Net Financial income and charges 1.0 6.7 10.1 13.4 19.7<br />
Incidence of employment costs 22.0% 15.3% 15.1% 16.8% 18.6%<br />
Incidence of financial area 2.4% 1.6% 1.2% 0.8% 0.5%<br />
Equity and structural<br />
Employment costs/<br />
Turnover<br />
Financial income and<br />
charges/ Turnover<br />
Primary structural balance ratio 0.9 1.0 1.1 1.3 1.4<br />
(Shareholders’ equity/<br />
Fixed assets)<br />
Financial indebtedness ratio 0.8 0.8 0.8 0.6 0.5 (NCP/Shareholders’<br />
equity)<br />
NCP/EBITDA ratio 18.8 2.4 1.9 1.7 1.6 (NCP/EBITDA)<br />
Shareholders’ equity tangibility ratio 1.0 1.0 1.0 0.9 0.9 (Equity-Intangible<br />
assets / Equity)<br />
Other<br />
Average number of employees 2787 2668 2364 2226 1816 <strong>Annual</strong> mean<br />
Turnover per employee 0.143 0.249 0.258 0.224 0.214<br />
Net Working Capital Rotation 150.8 113.5 111.8 119.0 129.1<br />
Data expressed in<br />
millions of Euro<br />
Average no. of days<br />
(base 360)<br />
35<br />
<strong>Annual</strong> <strong>Report</strong> <strong>2009</strong>
36<br />
power<br />
control<br />
green<br />
solutions<br />
In general the trend of the Group has suffered greatly from the effects of the global economic<br />
slowdown. Turnover fell by nearly 40% compared to 2008. Specifically, European markets suffered<br />
more from the effects of the financial crisis with very strong impacts especially in Italy, Spain and Fran-<br />
ce. These negative results were partly alleviated by the good results recorded in emerging countries<br />
(China, India and Brazil) which therefore demonstrated the soundness of strategic choices aimed at<br />
market share expansion implemented by the Group in recent years. The geographical breakdown of<br />
sales show that the loss in turnover was much higher in Italy and Europe with respect to overseas<br />
markets whose sales, as a whole, dropped by 18% compared to sales realised in 2008, as opposed<br />
to the -55% in Italy and -46% in Europe.<br />
Turning to an analysis of the main figures in the Income Statement, on a consolidated level, the<br />
Group gross operating margin (EBITDA) stood at 9.1 M€, accounting for 2.3% of sales, dropping by<br />
over 8 percentage points from 2008.<br />
More precisely, we point out the following:<br />
• the cost of sales recorded a 6.6 percentage point increase, the incidence on turnover rising from<br />
77.3% to 83.9%. This reduction is mainly due to fixed industrial costs that could not be reduced<br />
in proportion to the drop in turnover, in spite of the steps taken by Italian companies (Layoff Be-<br />
nefits Fund, Solidarity, Mobility, general costs savings) which however allowed for a reduction in<br />
absolute terms of fixed and variable industrial costs equivalent to 22.8 M€ with respect to 2008.<br />
As regards the trend in added value, stable percentage values were recorded between 2008 and<br />
<strong>2009</strong>, a sign that the price policies implemented to retain market shares were not too aggressive,<br />
even though fluctuations in the cost of materials and the product mix had a positive effect on the<br />
added value percentage.<br />
• structural and general operating costs increased their percentage incidence (22.1% as opposed to<br />
15.5%) due, to a large extent, to the effect of fixed costs, even if in terms of absolute value, these<br />
expenses are 18.6 M€ lower than in 2008, thanks to the costs reduction measures implemented<br />
by the Group as a whole.<br />
• overall personnel costs increased their percentage incidence on turnover (22% as opposed to<br />
15.3%) although it fell in absolute value by 13.6 M€ compared to 2008;<br />
• the overall incidence of depreciation and amortisation increased by nearly three percentage points<br />
(6.3% compared with 3.4%), recording an increase in absolute value of roughly 2.7 M€;<br />
• financial expenses and income increased in terms of incidence on turnover, rising from 1.6% in<br />
<strong>2009</strong> <strong>Annual</strong> <strong>Report</strong>
Management <strong>Report</strong><br />
2008 to 2.4% in <strong>2009</strong>, in line with 2008 in terms of absolute value, following the reduction in<br />
the cost of money and operations to reduce the Group’s indebtedness recorded since the second<br />
half of the year;<br />
• extraordinary income and charges had a debit balance for <strong>2009</strong>, their incidence on turnover<br />
standing at 1.7% as a result of provisions for future charges of other than an ordinary nature<br />
(allocations made by the Parent company against the reorganisation underway).<br />
At the level of the asset and liability structure of the Group, Net Working Capital fell sharply from<br />
209.2 to 167.4 M€ (-41.8 M€), due to a reduction in warehouse volumes and the effect of the de-<br />
crease in turnover on the mass of trade receivables and payables. Average rotation index suffered the<br />
consequences of the disproportionate decline in turnover.<br />
An important positive development worthy of mention is the fact that, in spite of the reduction in<br />
sales and the economic losses recorded, net cash position (overall financial indebtedness) improved<br />
from 177.9 to 170.9 M€ dropping by 7 M€, despite the negative economic trend. This was the result<br />
of the substantial recovery made by Net Working Capital, which is undoubtedly a very good result.<br />
Net investments amount to 18.8 M€ with details given below:<br />
Values in Euro/millions <strong>2009</strong> 2008 2007 2006 2005<br />
Land and buildings 2.5 16.1 16.3 12.1 13.5<br />
Plant and machinery 12.4 23.2 22.2 18.1 8.4<br />
Trade & industrial fixtures 4.9 8.0 7.8 5.5 2.9<br />
Other assets 0.8 2.9 2.0 1.0 1.8<br />
Assets in progress (3.1) (4.3) 4.6 (0.2) 7.0<br />
Tangible fixed assets 17.5 45.9 52.9 36.5 33.6<br />
Software, trademarks, patents 0.8 0.5 1.9 1.5 1.1<br />
Consolidation goodwill - 0.2 0.1 0.1 1.8<br />
Other 0.5 3.2 - 0.2 0.5<br />
Intangible fixed assets 1.3 3.9 2.0 1.8 3.4<br />
Total investments 18.8 49.8 54.9 38.3 37.0<br />
37<br />
<strong>Annual</strong> <strong>Report</strong> <strong>2009</strong>
38<br />
power<br />
control<br />
green<br />
solutions<br />
With reference to the year <strong>2009</strong>, the largest investments made by the Group are set out below, in-<br />
volving an overall outlay of 18.8 M€:<br />
• investments in intangible fixed assets refer mainly to the purchase and implementation of applica-<br />
tion software related to the development of the SAP project in Italy and in the main overseas sites.<br />
The increase in “other intangible fixed assets” is attributable for the most part to improvements<br />
to rented premises realised primarily by the Parent company and by the Chinese subsidiary;<br />
• investments in land and buildings relate principally to the expansion of the factory in Forlì by the<br />
Parent company involving the sum of 1.6 M€ and the completion of construction of the factory<br />
of the Vietnamese subsidiary totalling 0.5 M€;<br />
• investments in plants, machinery and equipment related mainly to the production companies<br />
and deferments and delays in investments started during the first eight months of 2008: only the<br />
Parent company strengthened production with purchases amounting to 9 M€ of which 2.7 M€<br />
relates to leasing investments; there were also considerable increases to the machine inventory at<br />
the factories located in Slovakia (2.5 M€), Vietnam (0.9 M€) and India (3.7 M€).<br />
To the investments already made, investments in progress on 31.12.<strong>2009</strong> and involving a total of 5.6<br />
M€ must be added; these investments relate mainly to works on the building of the Turkish subsidia-<br />
ry and advances paid for the purchase of new machinery by the Parent company and by the Indian<br />
subsidiary, installation of which was delayed in agreement with the suppliers following the very bad<br />
economic cycle.<br />
Risk management<br />
An analysis is set out below of the principle risks to which the Group is exposed, these risks being re-<br />
presented by events capable of producing negative effects on the pursuit of the company’s objectives<br />
and which therefore restrict the creation of value.<br />
Risks connected with general economic conditions<br />
The economic and financial standing of the Group, as well as its assets and liabilities, are influenced<br />
by a number of factors that make up the macro-economic picture in the various countries in which<br />
the Group operates: increase or decrease in GDP, consumer and business confidence, interest rate<br />
fluctuations, the cost of raw materials and the unemployment rate.<br />
Risks connected with the market sectors served<br />
The Group manufactures and distributes complete solutions for both the “industrial” sector (gearbo-<br />
<strong>2009</strong> <strong>Annual</strong> <strong>Report</strong>
Management <strong>Report</strong><br />
xes and gearmotors for industrial and photovoltaic applications) and the “mobile” sector (gearboxes<br />
and gearmotors for earth-moving machinery, excavators, agricultural machinery and wind turbines).<br />
The wide range of end markets and applications supplied has always provided shelter from economic<br />
slumps by allowing the Group to shift the range on offer from sectors in decline to those in growth.<br />
The extraordinary nature of the current global economic crisis, which last year hit almost all economic<br />
sectors almost without distinction, had led to a drastic decline in demand in all manufacturing sectors<br />
in which the Group is involved. Analysts forecasts for 2010, all things considered positive, suggest<br />
that the return of a more balanced dynamic between supply and demand is feasible.<br />
Risks connected with financial resource requirements<br />
In order to keep the Net Financial Position under constant check and to monitor the business’ short-<br />
term capacity to meet its commitments, short-term cash flow estimates were drawn up in order to<br />
make the most appropriate decisions.<br />
During <strong>2009</strong> the net cash position of the Group improved by nearly 7 M€ confirming the actions and<br />
efforts made to improve Net Working Capital and reduce investments and spending.<br />
In any event, acting with the maximum caution, 3-5 year industrial and financial plans were prepared<br />
during <strong>2009</strong> in order to tackle these cash requirement risks in the short and medium term as effec-<br />
tively as possible and were presented to financial institutions. In early 2010 appropriate agreements<br />
were reached with leading financial institutions to define the support to be given to the Group over<br />
the next few years, also in light of a reduction in the overall rating following the losses recorded in<br />
<strong>2009</strong>. The signing of these agreements has undoubtedly had a positive result, reducing the risk of fi-<br />
nancial resource requirements should the general economic crisis worsen during the coming months,<br />
an extremely cautious approach being favoured.<br />
Credit risk<br />
Bad debt risk is represented by the Group’s exposure to potential losses that may stem from the fai-<br />
lure by customers to meet their obligations.<br />
Customer credit risk is constantly monitored with the use of information and customer assessment<br />
procedures and this type of risk has had very little scope in the past, even though the level of bad<br />
debts recorded in <strong>2009</strong> was much greater than previous averages.<br />
Risks connected with exchange and interest rate fluctuations<br />
Being a global player the Group is naturally exposed to market risks connected with exchange rate<br />
and interest rate fluctuations. Exposure to exchange rate fluctuations is linked mainly to the geogra-<br />
39<br />
<strong>Annual</strong> <strong>Report</strong> <strong>2009</strong>
40<br />
power<br />
control<br />
green<br />
solutions<br />
phical distribution of production and sales activities which generate export flows in foreign currency<br />
different from the production currency. In particular, the Group is exposed through its exports from<br />
Italy to the USA, Great Britain and Australia. As regards inflows, on the other hand, the risk relates to<br />
imports from Japan, in the currency Yen.<br />
In keeping with its risk management policies, the Group tries to tackle risks relating to exchange and<br />
interest rate fluctuations with the use of hedging financial instruments.<br />
Risks connected with the use of derivative financial instruments<br />
The Group uses the interest/exchange rate hedging financial instruments referred to in the previous<br />
section. The companies in the Group do not use speculative-type derivative financial instruments.<br />
Risks connected with employment relations<br />
In the various countries in which the Group operates, employees are protected by various laws and<br />
by collective labour contracts which provide them with guarantees through local and national repre-<br />
sentatives. Employees are entitled to be consulted on specific matters, including the reduction in size<br />
or closure of departments or reductions in work force. These laws and collective labour contracts<br />
applicable to the Group could affect the flexibility with which it redefines or strategically repositions<br />
its activities.<br />
Risks connected with competition<br />
The macroeconomic crisis has had the effect of reducing consumption in almost all sectors in which<br />
the products distributed by the Group are used (manufacturing and building in particular) thereby<br />
gradually reducing the overall value of the available market and increasing competition. The success<br />
of the Group will therefore also depend on its ability to maintain and increase its market share,<br />
perhaps expanding into new sectors and emerging countries.<br />
Information regarding the environment<br />
The Group conducts its activities in accordance with environment protection regulations currently in<br />
force in the various countries in which the Group operates.<br />
In any event we can confirm that no damage has been caused to the environment for which com-<br />
panies in the Group have been declared definitively responsible, nor have any definitive sanctions or<br />
penalties been imposed on companies in the Group for environmental offences or damage.<br />
<strong>2009</strong> <strong>Annual</strong> <strong>Report</strong>
Human resources<br />
Management <strong>Report</strong><br />
The crisis situation occurring in the first few months of <strong>2009</strong> made it necessary for the business to<br />
take various organisational measures that have been summed up and approved as part of a prelimi-<br />
nary three-year industrial plan (<strong>2009</strong>-2011). The actions defined have concerned the entire Group<br />
and have been worked out in detail based upon the following strategic lines:<br />
• simplification and better organisational focus through definition of 2 Business Units (Industrial-<br />
Photovoltaic and Mobile-Wind) headed by general managers with far-reaching powers, who have<br />
been put in charge of management of the Group’s entire business, with the exception of some<br />
central functions such as Finance, Human Resources, Information Systems, strategic Marketing<br />
and corporate Quality Control;<br />
• adoption of processes and an organisation that utilises the principles of lean production at all<br />
levels and which - together with creation of the 2 BU’s - is producing a great cultural and organi-<br />
sational change in all companies in the Group;<br />
• definition of actions even in the short term that should allow for large reductions of fixed costs<br />
that has led to managerial level agreements (managers of the Group), as well as agreements with<br />
trade union representatives on different fronts as described in the following points.<br />
At the level of <strong>Bonfiglioli</strong> Riduttori S.p.A. alone, the Parent company, the various actions taken during<br />
the year have led to a reduction in the overall number of employees by nearly 110, from 1,486 to<br />
1,376 employees (excluding executives) from January to December <strong>2009</strong>. At first, Interim employ-<br />
ment contracts were eliminated and agreements were reached regarding fixed term contracts, some<br />
of which were completed while others were converted into contracts with no fixed term. Agreements<br />
have been reached at both the Parent company and other companies in the Group on how to mana-<br />
ge the crisis by having recourse to ordinary Layoff Benefits Fund and through Solidarity agreements.<br />
During the second half of the year the transfer of electric motor assembly lines from the Calderara<br />
di Reno (B5) factory to the one at Lippo (B1) was completed with transfer of the entire workforce of<br />
B5. The operation took place in agreement with the trade unions and with a shared commitment re-<br />
garding the implementation and management of 5S production and quality improvement programs.<br />
Subsequently, at the end of November an agreement was reached permitting the Parent company<br />
to have recourse to Extraordinary Layoff Benefits Fund for 12 months and to simultaneously start 80<br />
employees on a mobility procedure. Procedures to encourage personnel to leave the company began<br />
in early 2010 and are still underway.<br />
41<br />
<strong>Annual</strong> <strong>Report</strong> <strong>2009</strong>
42<br />
power<br />
control<br />
green<br />
solutions<br />
In line with the guidelines of these agreements the <strong>2009</strong>-2011 industrial plan was presented with<br />
a clear indication of the objectives and actions the company must take in order to tackle the crisis.<br />
Italian and foreign production allocations as well as programs directed at improving efficiency and<br />
quality essential for maintaining and strengthening the Group’s market position were also illustrated.<br />
The positive climate generated by these agreements has already made room for ambitious operations<br />
to reorganise production areas and have given the go ahead for improvements to programs, adop-<br />
ting the principle of lean manufacturing.<br />
After the reorganisation into 2 Business Units a plan for reducing the number of executives was in-<br />
troduced and led to the resignation of 5 executives during the year.<br />
All pay reviews were blocked during the year, all MBO plans were eliminated at executive and middle<br />
management level, and selection processes were essentially eliminated, except for some limited ca-<br />
ses, linked mainly to development of the photovoltaic business.<br />
As regards training-related interventions, during <strong>2009</strong> focus was on different sectors, including the<br />
continued training of workers on safety, internal rules and processes, quality control with specific<br />
courses on 5S, Timing & Methods and others, as well as ongoing updates regarding new electronic<br />
mail systems, and other information technology packages. When possible training has been suppor-<br />
ted by internal teaching staff and resources accumulated in Fondimpresa/Fondirigenti interprofessio-<br />
nal funds.<br />
As regards planning of training activities, a new intervention forecast process was introduced, now<br />
undergoing improvement directed at its effectiveness, especially in relation to some activities finan-<br />
ced locally (e.g. prompt participation in courses for maintenance personnel, on PLC and hydraulic oil<br />
motor programming, financed by the Province of Bologna) and long-term programming of complex<br />
activities (such as courses on lean production launched in early 2010) that should continue at all<br />
Italian plants).<br />
A summary of the main areas covered during 2010 is given below.<br />
Leg. Decree 81/08 Languages IT Production Other<br />
20.13% 15.88% 26.40% 21.03% 16.56%<br />
<strong>2009</strong> <strong>Annual</strong> <strong>Report</strong>
Management <strong>Report</strong><br />
To conclude, it is confirmed that none of the following events occurred at any of the companies in<br />
the Group:<br />
• death at work place or serious injuries of employees;<br />
• charges connected with professional illness to employees or former employees as a result of mobbing.<br />
Research and development<br />
Research and development activities are performed for “<strong>Bonfiglioli</strong> Riduttori” brand gearboxes and<br />
electric motors (including products of Tecnoingranaggi) at the Lippo di Calderara (BO) site, for “Tra-<br />
smital” planetary gearboxes at the Forlì site and for “Vectron” electronic inverters at the Kreferld site<br />
in Düsseldorf of the subsidiary <strong>Bonfiglioli</strong> Vectron GmbH.<br />
As confirmation of the importance assumed by R&D we draw your attention to the fact that overall<br />
R&D expenditure in <strong>2009</strong> was roughly 7 M€ for the <strong>Bonfiglioli</strong> Group.<br />
The following section contains an overview of the main development projects in relation to the three<br />
product brands (<strong>Bonfiglioli</strong> Riduttori, <strong>Bonfiglioli</strong> Trasmital and <strong>Bonfiglioli</strong> Vectron).<br />
<strong>Bonfiglioli</strong> Riduttori<br />
A - C - F - W Series<br />
The year <strong>2009</strong> saw demanding efforts made to upgrade the performances of products in the cata-<br />
logue came to an end and development of the A and F Series with low backlash designed with con-<br />
nection interfaces for brushless servomotors, suitable for medium dynamic applications. Although<br />
traditional design choices were made, these variants were authorised by assuming various building<br />
solutions, some innovative, requiring the granting of patents (backlash elastic recovery system).<br />
In order to meet certain application needs in the wind turbine sector, special products were designed<br />
and tested deriving from “W75” and “W110” type worm gearboxes equipped with integrated tor-<br />
que-limiting unit, which are used as the first external reducing stage and safety device against over-<br />
charging on the planetary gearboxes in the “Series 300”, utilised to position the wind turbine yaw.<br />
The technical lab, in collaboration with Ferrara University, was involved in intense operations to map<br />
and define the vibration and noise levels considered acceptable for the gearboxes in the A - C - F seri-<br />
es, with a view to tackling any problems reported to light by customers. With the new skills acquired,<br />
an automatic noise measuring system was created and installed at the end of the assembly line, used<br />
to check that the products meet quality standards and to deal with the relevant validation.<br />
43<br />
<strong>Annual</strong> <strong>Report</strong> <strong>2009</strong>
44<br />
power<br />
control<br />
green<br />
solutions<br />
HDP - HDO Series<br />
The Project Area was heavily involved in the development of a large number of personalised and<br />
special models to meet customer specifications.<br />
With regard only to the Medium level range, sizes of between 100 and 160, technical reference do-<br />
cumentation was prepared as necessary to assemble the gearboxes correctly both at the Italian facto-<br />
ries (the factory in Sala Bolognese) and the foreign branches (South Africa, Australia, United States).<br />
Finally, in the single screw extruder sector, the modularity of the thrust block was developed and<br />
optimised on sizes 60 to 160.<br />
Tecnoingranaggi low backlash high-precision gearboxes<br />
Development of the new TQ and TQK series was concluded in <strong>2009</strong> and, following tests carried out<br />
on prototypes of various sizes, technologies were set up that marked a breakthrough compared to<br />
the past, in terms of production materials options, forms of heat treatment and finishing processes<br />
(honing) adopted, as well as test bench gauging of torsional rigidity and transmission error.<br />
Electric Motors<br />
Operations to support the start-up of the production plant located in Vietnam commenced in 2008<br />
continued throughout the year, and drawings for new components and equipment (sizes BN 90-100-<br />
112-132, M3-M4) were released and production bills of materials and relevant technical specifica-<br />
tions were issued.<br />
Prototype testing was completed and the new production processes introduced were validated. Sim-<br />
plified transformation matrices for assembly at the branches were processed and the company conti-<br />
nued with the development of special models from drawings, in particular applications for the wind<br />
turbine sector.<br />
The company launched the first stage of re-planning aimed at bringing the entire production depart-<br />
ment in line with IE performance limits, in accordance with the provisions contained in the EuP Directive.<br />
<strong>Bonfiglioli</strong> Trasmital<br />
Modular Gearbox range for Multi-purpose Industrial Applications<br />
The current range was expanded with the addition of another 2 larger sizes, with nominal output<br />
torque rates of 800,000 Nm and 1.100.000 Nm respectively. These will be utilised mainly in large<br />
plants operated in sectors such as: mining, chemical, agro-food and metalworking. Special versions<br />
of these sizes were also studied for offshore platform haulage applications.<br />
<strong>2009</strong> <strong>Annual</strong> <strong>Report</strong>
Operations involving wind turbine generators<br />
Management <strong>Report</strong><br />
This sector is in continuous development, keeping pace with the improvements made by various lea-<br />
ding constructors to their machines in order to tackle the increasingly tough competition created by<br />
new market players, particularly from Asia: Chinese, Korean, Indian. This calls for a reduction in the<br />
costs/performance ratio, that also affects the gearboxes in question.<br />
In this area work was carried out to develop a number of consolidated products, introducing con-<br />
structive solutions aimed at cutting industrial production costs, at the same time maintaining perfor-<br />
mance levels or even increasing them.<br />
Along with continuing efforts were made to personalise products in terms of capacity to interface<br />
with the different types of generator and the technical specifications released by the various con-<br />
structors.<br />
Gearboxes for drive tracked machine tools<br />
The design of the gearbox model at the top of the 720C range was reviewed in order to improve its<br />
performance and thereby raise the output torque rate from the former 220,000 Nm to 250,000 Nm,<br />
and thereby be applied on excavators of up to 120 tons in weight.<br />
In addition, a further size was designed to take up the new highest position in the range with an ou-<br />
tput torque rate of 330,000 Nm. It will be adapted to tracked machines, such as drillers and cranes,<br />
with weight class of 250 tons and excavators up to 160 tons. The company proceeded with the deve-<br />
lopment of numerous versions dedicated to special applications, co-designed with leading customers.<br />
Gearboxes for machine tool wheel drives<br />
Models in a number of medium sizes from the current range were designed with the dynamic drive<br />
brake as a means of assisting the hydrostatic transmission during deceleration and shutdown. This<br />
function is additional to the previous static parking and emergency brake system previously adopted.<br />
This feature was introduced to meet safety regulations currently in force applying to approval of<br />
machines circulating on public roads with the maximum speed raised to 50 km/h. The multi disk-oil<br />
bath brake has twin drive, positive under the direct modulated control of the operator, for dynamic<br />
braking, and negative for parking and emergency braking. One of the main applications for which<br />
these products are designed are self-propelled agricultural machines, such as cereal and forage har-<br />
vesters and sprayers, used above all in the continent of North America.<br />
Additional personalised models of the gearbox for rubberised compressor roller wheel drives were<br />
also developed, following the success this product had on the market in the original version.<br />
45<br />
<strong>Annual</strong> <strong>Report</strong> <strong>2009</strong>
46<br />
power<br />
control<br />
green<br />
solutions<br />
Testing and experimentation<br />
Test operations were developed for new and recently developed products as well as consolidated mo-<br />
dels, which were aimed at verifying the validity of projects underway in terms of set performances,<br />
and at checking reliability and durability during simulated working fatigue cycles.<br />
A series of tests were developed in team with the company’s most important customers with a view<br />
to type-approving products to be applied on their machines, in particular in the wind turbine sector<br />
but also mobile e machines (agricultural machinery and roadwork machinery).<br />
Other tests were developed to assess alternative construction solutions offering improvements from<br />
corresponding existing solutions already in use, with a view to increasing the reliability of the product<br />
and reducing production costs.<br />
<strong>Bonfiglioli</strong> Vectron<br />
Expansion of range offered to photovoltaic sector: new modular series “RPS 450TL” >170<br />
kWp<br />
<strong>2009</strong> was another year marked by a notable commitment to photovoltaic products by <strong>Bonfiglioli</strong>.<br />
The dedicated development team defined and developed a new regeneration concept, based on a<br />
modular system with which the power range in the RPS series was extended beyond 170 kWp, up to<br />
a maximum power of 1190 kWp.<br />
The modular platform, the result of the radical redesigning of the system, which kept the team busy<br />
throughout <strong>2009</strong>, allows, amongst other things, the various MPP Trackers to be managed separately,<br />
thereby optimising efficiency in “multi string” plants.<br />
With the new RPS product to offer, <strong>Bonfiglioli</strong> is now able to satisfy the needs of the most up-to-date<br />
photovoltaic farms of any size.<br />
New sensorless Agile series<br />
Efforts made by the electronic technical office also concentrated on the creation of a new innovative<br />
series of high profile three-phase sensorless inverters called “Agile”, produced in 3 sizes and covering<br />
a range of power requirements from 0.25 to 11 kW.<br />
A “tiger team” was chosen to deal with the Agile series, formed by specialised technicians whose<br />
objective is to serve as a stable Group in charge for the constant monitoring of the status of the work<br />
in progress .<br />
The Agile project managed, amongst other things, to increase the value of the <strong>Bonfiglioli</strong> electronic<br />
<strong>2009</strong> <strong>Annual</strong> <strong>Report</strong>
Management <strong>Report</strong><br />
portfolio as a whole, thanks to the various wide-ranging activities conducted. Here are just some of<br />
the results achieved that greatly benefit all the other electronic products series and create greater<br />
impetus and competitive drive for projects to be put together in the future:<br />
• new modular structure of the control software, which will reduce the time taken to develop the<br />
next product series;<br />
• hardware platform common to other product series which allows additional communication mo-<br />
dules to be shared;<br />
• new rules for software development, applied for the first time in the Agile project, ensuring that<br />
software is more readable and easier to maintain;<br />
• a first software prototype for sensorless control of PM synchronous motors;<br />
• a fully revised, expanded and documented version of the VPlus programming software suite, used<br />
by all the existing product series;<br />
• 3 new power hardware boards, focused on typical sizes of sensorless products.<br />
EROD financed project<br />
<strong>Bonfiglioli</strong> Vectron is taking part in a three-year project financed by the Ministry of Economic Deve-<br />
lopment whose aim is to develop and look further into a number of topics relating to energy efficien-<br />
cy. The project is made up of 5 research areas in which 15 companies operate. The objectives set by<br />
the “machine tool” area, in which <strong>Bonfiglioli</strong> is involved, are research, design and prototyping of a<br />
new drive unit for high efficiency spindle applications.<br />
Training activities<br />
Again this year the team at <strong>Bonfiglioli</strong> Vectron “Competence Centre” supplied the <strong>Bonfiglioli</strong> sales<br />
structure with technical-applicative training. The program of courses is divided into “Basic”, “Advan-<br />
ced” and “Expert” sessions, each lasting one week, dedicated to training in the use of drives. The<br />
program also includes the “Photovoltaic Product Training” course, which is aimed at presenting the<br />
fundamental principles of solar technology and provides information on the characteristics of fun-<br />
ctional hardware operated by RPS units.<br />
The technical newsletter was continued, published every quarter.<br />
When presenting the Agile line to the sales network, the team at the Competence Centre handled<br />
the running and contents of the training day dedicated to the product’s technical-functional charac-<br />
teristics following presentation for sales purposes. During the following quarter, the first full course<br />
on the Agile series was made available.<br />
47<br />
<strong>Annual</strong> <strong>Report</strong> <strong>2009</strong>
48<br />
power<br />
control<br />
green<br />
solutions<br />
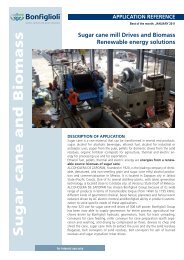
Biomasses<br />
Biomasses are proving, though at growth rates below that experienced by other sectors in the green<br />
economy, to be an important reference sector for the application of planetary gearboxes in the 300<br />
series used in the transformation of raw fuel materials for the production of energy. These new ap-<br />
plications also require the use of the inverters in the Active series, which allow the mixing of these<br />
biomasses to be monitored constantly, thereby optimising the energetic balance between what is<br />
utilised for the transformation process and what is generated in terms of energy capacity.<br />
Quality control<br />
With reference to Quality Control, <strong>Bonfiglioli</strong> Group concentrated in <strong>2009</strong> on a number of projects<br />
aimed at continuing back-up, with ever increasing enthusiasm, for progressive efficiency and custo-<br />
mer satisfaction, both in Italy and abroad.<br />
The following improvement projects are currently underway in <strong>2009</strong>:<br />
• ISO 9001:2008 Certification Project involving the Group;<br />
• Projects for improvement of product quality control and production processes, adopting the phi-<br />
losophy of lean manufacturing;<br />
• Projects for improvement of product quality control and supplier service;<br />
• SQEP Certification (Supplier Quality Excellence Program) with an important North American mul-<br />
tinational customer;<br />
• CQC Certification of the factory premises in Lippo and Ho Chi Minh City in order to obtain autho-<br />
risation to use the CCC mark on electric motors and to export them to the Chinese market;<br />
• Project for the re-engineering of the process set up to develop new products in stage&gate logics<br />
(in line with the best automotive benchmarks).<br />
The main concrete results obtained during <strong>2009</strong> were as follows:<br />
• Involvement within the Certification ISO 9001 for <strong>Bonfiglioli</strong> Group of the following factories and<br />
branches: factory in Sala Bolognese (B2), Tecnoingranaggi, <strong>Bonfiglioli</strong> Vietnam, <strong>Bonfiglioli</strong> Slova-<br />
kia, <strong>Bonfiglioli</strong> Vectron, as well as the sales offices in Italy, France and Germany.<br />
Certification to ISO 9001:2008 continues to represent one of the most important objectives for<br />
the business standard reached at <strong>Bonfiglioli</strong>. The Quality Management System at <strong>Bonfiglioli</strong> Group<br />
is applied at all the factories and branches with the aim of guaranteeing that quality standards<br />
are improved continuously, as well as the rationalisation and integration of internal processes in<br />
<strong>2009</strong> <strong>Annual</strong> <strong>Report</strong>
Management <strong>Report</strong><br />
order to satisfy as best as possible the requirements of customers, both at home and abroad. This<br />
continuous improvement process is supported by constant analysis of a series of KPIs, which are<br />
fundamental to maintaining set standards at high levels, in accordance with the strategic and<br />
market requirements defined by upper management.<br />
SQEP Certification (Supplier Quality Excellence Program) received by an important North American<br />
multinational customer. SQEP certification represents prestigious recognition to <strong>Bonfiglioli</strong> by the<br />
customer after an in-depth assessment of its performance in the fields of sales, manufacturing,<br />
design, logistics and quality. This result was achieved thanks to a thorough process of analysis and<br />
improvement of internal processes. The success of this process is also concrete proof of the com-<br />
pany’s ability to cater for customer requirements and to turn their needs into new opportunities<br />
for growth for the entire Group.<br />
Significant events after year end<br />
With reference to events occurring after the closure of the accounting year, the following comments<br />
are made.<br />
In February 2010 the Parent company gave its approval to a consolidated business plan for the years<br />
2010 - 2014 in which the objectives and industrial actions to be taken by the Group in the mid-term<br />
were set out. This business plan was also used to define agreements reached last March with leading<br />
Italian banks most involved in funding the Group and confirmed the extensive trust that has always<br />
been shown to our Group by the financial system. In fact, in order to maintain the cautious approach<br />
that has always been taken to the financial management of the Group, it was considered advisable,<br />
though not necessary, to sign an agreement with the main banks to regulate indebtedness and credit<br />
facilities used by the Group over the next few years based on the following principal guidelines:<br />
• re-scheduling of due date for mid and long-term debts for a total of 117.4 M€: defining a new<br />
repayment plan up to June 2016;<br />
• remodulation of short-term operating lines for a further 76.3 M€ with due date up to June 2013;<br />
• defining a revolving line of creditor a total of 15 M€ with due date up to June 2013.<br />
Between January and April a number of corporate transactions were completed involving the Turkish<br />
subsidiary (purchase of shares and subsequent increase in share capital) which increased the Group’s<br />
shareholding to 98.01% and was aimed at providing the company with both financial and organi-<br />
sational support.<br />
49<br />
<strong>Annual</strong> <strong>Report</strong> <strong>2009</strong>
50<br />
power<br />
control<br />
green<br />
solutions<br />
During the month of May, the Parent company proceeded with the sale of the majority shareholding<br />
in the company “<strong>Bonfiglioli</strong> Skandinavien AB.” maintaining a minority interest of 10%. After this<br />
sale, the Scandinavian company will continue to distribute Group products in the area as B.E.S.T.<br />
dealer.<br />
Business outlook<br />
Consolidated turnover as at April 2010 stood at 160.9 M€ compared with the 142.8 M€ figure<br />
recorded in April <strong>2009</strong>, increasing by 8.5%. Orders collected during the first few months of 2010<br />
are marked by a positive trend bringing intake levels back to those recorded for April 2008, with im-<br />
provements in both the Business Units and a valid contribution stemming from the renewable energy<br />
sources with which <strong>Bonfiglioli</strong> has confirmed its position as one of the most important players in both<br />
the wind turbine and photovoltaic sectors.<br />
• Despite the comforting results obtained in connection with order intake and turnover, the rationa-<br />
lisation and reorganisation operations already started towards the end of <strong>2009</strong> in response to the<br />
heavy economic situation and defined in the approved Industrial Plans, are still in place. The main<br />
actions aim at the following goalsrecovery of profitability rate to bring EBITDA back to pre-crisis<br />
levels, to be achieved both by an increase in sales (even though it is not estimated that 2008 levels<br />
will be reached for several years) and through rationalisation and cuts in costs at industrial and<br />
operational levels. A particular emphasis has been placed on the cost of materials and out-sourced<br />
works, the recovery of production efficiency and cuts in operating costs not strictly necessary;<br />
• reduction of overall financial debt thanks to the rigorous management of Working Capital and<br />
the tight control on investments and the sale of a number of non strategic assets;<br />
With these results in mind, a large number of rationalisation and reorganisation projects were com-<br />
menced at Group level, some of which have already been successfully completed and others still in<br />
progress and requiring further time for completion by the entire Group. In particular, this has invol-<br />
ved an in-depth revision of the Group’s supply chain processes and the implementation of a single<br />
SAP computer system by all the companies in the Group. In the Industrial and Photovoltaic BU the<br />
revision of supply chain processes requires a drastic decentralization of final assembly operations for<br />
finished products (gearboxes, motors and geared motors) to sales points close to end markets, at<br />
the branches and main international BEST distributors, as well as major simplification of production<br />
processes at Italian and foreign factories by adopting lean production processes and defining new,<br />
more flexible relations with suppliers used. As regards the Mobile and Wind Turbine BU on the other<br />
<strong>2009</strong> <strong>Annual</strong> <strong>Report</strong>
Management <strong>Report</strong><br />
hand, the process of rationalising the supply chain calls for a total revision of planning processes and<br />
a reduction in supply lead times, on the basis of a so-called go to market model applied to the most<br />
important European customers, that, in this way, will be served and followed directly by the factory<br />
in Forlì without unnecessary transfers or storage at the branches in Europe. As regards overseas<br />
markets, on the other hand, flexible production hubs are being created in China and the USA, and<br />
expansion work is going ahead at the Indian factory in Chennai, already heavily focused on the pro-<br />
duction of gearboxes for the wind turbine sector.<br />
2010 will therefore be an important year for the tuning of the new BU management structure,<br />
planned with the adoption of new, more flexible industrial and operative processes. Actions taken<br />
and already underway cannot prevent the year closing with a recorded net loss, even though the<br />
operating profit (EBIT) figure should take a positive course after the heavy losses recorded in <strong>2009</strong>.<br />
Further information<br />
Equity shares<br />
The Parent company does not hold and has never held equity shares, nor does it hold stakes or shares<br />
in controlling companies inasmuch as there is no legal entity that holds a controlling stake in Bonfi-<br />
glioli Riduttori S.p.A. stock.<br />
Calderara di Reno (Bo), 27 th May 2010<br />
on behalf of the Board of Directors<br />
Sonia <strong>Bonfiglioli</strong><br />
51<br />
<strong>Annual</strong> <strong>Report</strong> <strong>2009</strong>
52<br />
power<br />
control<br />
green<br />
solutions<br />
<strong>2009</strong> <strong>Annual</strong> <strong>Report</strong>
Consolidated Financial Statements as of December 31, <strong>2009</strong><br />
(The consolidated financial statements have been translated into the English language<br />
solely for the convenience of international readers)<br />
53<br />
<strong>Annual</strong> <strong>Report</strong> <strong>2009</strong>
54<br />
power<br />
control<br />
green<br />
solutions<br />
Consolidated Financial Statements as of December 31, <strong>2009</strong><br />
Consolidated balance sheet<br />
Assets (Euro Thousand)<br />
B) FIXED ASSETS (NET OF CUMULATED DEPRECIATION)<br />
I. Intangible fixed assets<br />
<strong>2009</strong> <strong>Annual</strong> <strong>Report</strong><br />
<strong>2009</strong> 2008<br />
1) Start up costs 21 33<br />
3) Patents and rights to use intellectual properties 307 444<br />
4) Concession, licenses, trademarks and similar rights 348 91<br />
5) Goodwill<br />
5b) Consolidation differences 3,138 4,587<br />
6) Assets in progress and advances 23 123<br />
7) Other intangible fixed assets 3,466 3,298<br />
Total Intangible fixed assets 7,303 8,576<br />
II. Tangible fixed assets<br />
1) Land and buildings 126,343 126,218<br />
2) Plant and machinery 60,543 60,224<br />
3) Trade and industrial fixtures 14,549 15,673<br />
4) Other tangible fixed assets 4,977 5,651<br />
5) Construction in progress and advances 5,673 8,798<br />
Total Tangible fixed assets 212,085 216,564<br />
III. Financial fixed assets<br />
1) Investments:<br />
b) associated companies 3,528 3,957<br />
d) other companies 28 56<br />
sub total 3,556 4,013<br />
Total Financial fixed assets 3,556 4,013<br />
B) TOTAL FIXED ASSETS (NET OF CUMULATED DEPRECIATION) 222,944 229,153<br />
C) CURRENT ASSETS<br />
I. Inventory<br />
1) Raw materials, supplies and consumables 20,256 33,677<br />
2) Work in progress and semifinished goods 45,409 74,807<br />
4) Finished goods and goods for resale 79,460 95,449<br />
5) Advances 151 114<br />
Total Inventory 145,276 204,047
Consolidated Financial Statements as of December 31, <strong>2009</strong><br />
II. Receivables<br />
1) Trade receivables<br />
(Euro Thousand)<br />
<strong>2009</strong> 2008<br />
- due within 12 months 96,113 136,291<br />
3) Receivables from associated companies<br />
- due within 12 months 4,920 11,760<br />
4bis) Tax receivables<br />
- due within 12 months 6,685 15,568<br />
- due after 12 months 12,523 6,720<br />
4ter) Deferred tax assets<br />
sub total 19,208 22,288<br />
- due within 12 months 9,018 8,761<br />
- due after 12 months 16,556 6,361<br />
5) Other receivables<br />
sub total 25,574 15,122<br />
- due within 12 months 2,183 3,028<br />
- due after 12 months 2,089 1,961<br />
sub total 4,272 4,989<br />
Total Receivables 150,087 190,450<br />
IV. Cash at bank and on hand<br />
1) Banks 65,070 18,076<br />
3) Cash on hand 42 38<br />
Total Cash at bank and on hand 65,112 18,114<br />
C) TOTAL CURRENT ASSETS 360,475 412,611<br />
D) PREPAID EXPENSES AND ACCRUED INCOME<br />
- Other prepaid expenses and accrued income 926 1,049<br />
D) TOTAL PREPAID EXPENSES AND ACCRUED INCOME 926 1,049<br />
TOTALE ASSETS 584,345 642,813<br />
55<br />
<strong>Annual</strong> <strong>Report</strong> <strong>2009</strong>
56<br />
power<br />
control<br />
green<br />
solutions<br />
LIABILITIES AND SHAREHOLDERS’ EQUITY<br />
A) SHAREHOLDERS’ EQUITY<br />
<strong>2009</strong> <strong>Annual</strong> <strong>Report</strong><br />
(Euro Thousand)<br />
<strong>2009</strong> 2008<br />
I. Share capital 30,000 30,000<br />
III. Revaluation reserves 60,195 60,195<br />
IV. Legal reserve 4,240 3,891<br />
VII. Other reserves<br />
-) Extraordinary reserve 89,669 83,046<br />
-) Consolidation reserve 16,263 16,263<br />
-) Foreign exchange currency conversion reserve (5,214) (6,945)<br />
-) Other reserves 5,451 5,451<br />
sub total 106,169 97,815<br />
VIII. Retained earnings (losses) carried forward 34,328 20,383<br />
IX. Net income (loss) of the Group (31,970) 20,917<br />
Group share of shareholders’ equity 202,962 233,201<br />
Minority interests share capital and reserves 3,760 2,849<br />
Minority interests net income(loss) 202 1,282<br />
Minority interests 3,962 4,131<br />
A) CONSOLIDATED SHAREHOLDERS’ EQUITY 206,924 237,332<br />
B) RESERVES FOR RISKS AND CHARGES<br />
1) Termination indemnity and similar liabilities 1,723 1,801<br />
2) Taxes and deferred taxes liabilities 10,629 10,170<br />
3) Other reserves 12,399 8,085<br />
B) TOTAL RESERVES FOR RISKS AND CHARGES 24,751 20,056<br />
C) EMPLOYEE SEVERANCE INDEMNITY RESERVE 16,738 16,902<br />
D) PAYABLES<br />
1) Bonds<br />
- due within 12 months 194 569<br />
- due after 12 months 5,454 5,750<br />
sub total 5,648 6,319<br />
3) Payables t shareholders for financing<br />
- due within 12 months 378 -<br />
- due after 12 months - -<br />
sub total 378 -
4) Banks<br />
Consolidated Financial Statements as of December 31, <strong>2009</strong><br />
(Euro Thousand)<br />
<strong>2009</strong> 2008<br />
- due within 12 months 74,207 63,304<br />
- due after 12 months 135,321 104,000<br />
5) Other financial institutions<br />
sub total 209,528 167,304<br />
- due within 12 months 4,515 4,176<br />
- due after 12 months 15,936 18,227<br />
6) Advances<br />
sub total 20,451 22,403<br />
- due within 12 months 1,249 1,630<br />
7) Trade payables<br />
- due within 12 months 77,603 141,215<br />
10) Payables to associated companies<br />
- due within 12 months 42 16<br />
12) Tax payables<br />
- due within 12 months 3,004 5,163<br />
- due after 12 months 136 715<br />
13) Social security<br />
sub total 3,140 5,878<br />
- due within 12 months 4,375 5,731<br />
14) Other payables<br />
- due within 12 months 11,190 14,080<br />
- due after 12 months 1,439 2,593<br />
sub total 12,629 16,673<br />
D) TOTAL PAYABLES 335,043 367,169<br />
E) ACCRUED EXPENSES AND DEFERRED INCOME<br />
- Other accrued expenses and deferred income 889 1,354<br />
E) TOTAL ACCRUED EXPENSES AND DEFERRED INCOME 889 1,354<br />
TOTAL LIABILITIES AND STOCKHOLDERS’ EQUITY 584,345 642,813<br />
Memorandum accounts <strong>2009</strong> 2008<br />
Guarantees given from third parties in own favour 5,459 5,147<br />
Commitments on investments’ purchase 1,379 1,379<br />
TOTAL MEMORANDUM ACCOUNTS 6,838 6,526<br />
57<br />
<strong>Annual</strong> <strong>Report</strong> <strong>2009</strong>
58<br />
power<br />
control<br />
green<br />
solutions<br />
Consolidated statement of income<br />
A) PRODUCTION VALUE<br />
<strong>2009</strong> <strong>Annual</strong> <strong>Report</strong><br />
(Euro Thousand)<br />
<strong>2009</strong> 2008<br />
1) Net revenue from sales and services 399,750 663,497<br />
2) Change in work in progress, semi-finished and finished goods (48,495) 33,451<br />
5) Other revenues and incomes:<br />
- operating grants 143 -<br />
- others 4,910 6,709<br />
sub total 5,053 6,709<br />
A) TOTAL PRODUCTION VALUE 356,308 703,657<br />
B) PRODUCTION COSTS<br />
6) Raw materials, supplies, consumables & goods for resale 156,837 372,315<br />
7) Services 80,508 150,659<br />
8) Use of third party assets 4,487 4,421<br />
9) Personnel<br />
a) Wages and salaries 65,298 76,595<br />
b) Social contributions 18,555 20,705<br />
c) Severance indemnity 4,135 4,171<br />
e) Other costs 30 92<br />
10) Depreciation, amortization and write-downs<br />
sub total 88,018 101,563<br />
a) Amortization of intangible fixed assets 2,512 2,895<br />
b) Depreciation of tangible fixed assets 22,856 19,840<br />
d) Provision for doubtful account 2,665 1,971<br />
sub total 28,033 24,706<br />
11) Change in raw materials, supplies, consumables & goods for resale 13,584 (2,861)<br />
13) Other provisions 1,085 1,000<br />
14) Other operating expenses 3,780 4,601<br />
B) TOTAL PRODUCTION COSTS 376,332 656,404<br />
DIFFERENCE BETWEEN PRODUCTION VALUE AND COSTS (A–B) (20,024) 47,253<br />
C) FINANCIAL INCOME AND EXPENSES<br />
15) Income from investments<br />
- other investments - 19
16) Other financial income:<br />
(Euro Thousand)<br />
<strong>2009</strong> 2008<br />
- form associated companies 14 -<br />
- other 681 648<br />
17) Interest expenses and other financial charges:<br />
- other (10,170) (11,514)<br />
17bis) Exchange rate gains and losses, net (1,194) (1,800)<br />
C) TOTAL FINANCIAL INCOME AND EXPENSES (10,669) (12,647)<br />
D) ADJUSTMENTS TO FINANCIAL ASSETS<br />
18) Revaluations<br />
a) investments - 891<br />
19) Write-downs<br />
a) investments (457) -<br />
D) TOTAL ADJUSTMENTS TO FINANCIAL ASSETS (457) 891<br />
E) EXTRAORDINARY INCOME AND EXPENSES<br />
20) Income:<br />
Consolidated Financial Statements as of December 31, <strong>2009</strong><br />
- other 986 516<br />
21) Expenses:<br />
- other (8,262) (2,331)<br />
E) TOTAL EXTRAORDINARY ITEMS (7,276) (1,815)<br />
INCOME BEFORE TAXES (A–B±C±D±E) (38,426) 33,682<br />
22) Income taxes<br />
- current (3,321) (16,544)<br />
- deferred 9,979 5,061<br />
TOTAL INCOME TAXES 6,658 (11,483)<br />
23) NET INCOME (LOSS) INCLUDING MINORITY INTEREST (31,768) 22,199<br />
Minority interest income (202) (1,282)<br />
NET INCOME (LOSS) OF THE GROUP (31,970) 20,917<br />
59<br />
<strong>Annual</strong> <strong>Report</strong> <strong>2009</strong>
60<br />
power<br />
control<br />
green<br />
solutions<br />
<strong>2009</strong> <strong>Annual</strong> <strong>Report</strong>
Notes to the consolidated financial statements<br />
(The notes to the consolidated financial statements have been translated into the English language<br />
solely for the convenience of international readers)<br />
61<br />
<strong>Annual</strong> <strong>Report</strong> <strong>2009</strong>
62<br />
power<br />
control<br />
green<br />
solutions<br />
Notes to the consolidated financial statements<br />
Foreword<br />
The consolidated financial statements have been prepared in compliance with Italian Legislative De-<br />
cree no. 127 dated 9 th April 1991.<br />
The Notes include the reconciliation statement between shareholders’ equity and the net income of<br />
the Parent company and the same items in the consolidated financial statements; in addition, the<br />
consolidated cash-flow statement has been annexed to the Notes.<br />
As regards the nature of the activities conducted by the Group and developments occurring, as well<br />
as events arising after the date of the consolidated financial statements, reference is made to the<br />
contents of the Management <strong>Report</strong>.<br />
All figures in the financial statements and the relative Notes are expressed in thousands of Euros<br />
(K€), unless otherwise indicated.<br />
Form and contents of the consolidated financial statements<br />
The consolidated financial statements include the financial statements of companies within Bonfiglio-<br />
li Group, namely the Parent company <strong>Bonfiglioli</strong> Riduttori S.p.A. and the Italian and foreign subsidiari-<br />
es in which the company holds more than 50% of the capital, either directly or indirectly, or exercises<br />
management and control in relation to specific agreements to this effect.<br />
The financial statements of the Group companies utilised for the integral consolidation were appro-<br />
ved at general meetings held by the individual companies concerned, suitably modified wherever<br />
necessary to bring them in line with the accounting principles adopted by the Group, which comply<br />
with the financial principles imposed by law. If the relative financial statements had not yet been<br />
approved by the respective general meetings when the consolidated financial statement was drawn<br />
up, the draft financial statements prepared for approval by the respective Boards of Directors were<br />
utilised.<br />
If the financial year of companies closes on a date other than 31 st December, interim financial state-<br />
ments were drawn up at 31 st December utilising the Group accounting principles.<br />
The Group companies operate exclusively in the manufacture and sale of gear motors, speed varia-<br />
tors, and drive transmission components in general.<br />
<strong>2009</strong> <strong>Annual</strong> <strong>Report</strong>
Notes to the consolidated financial statements<br />
The subsidiaries included in the consolidation area at 31 st December <strong>2009</strong> are as follows:<br />
Denomination Country Currency Share<br />
Capital<br />
Shareholding<br />
<strong>2009</strong> 2008<br />
<strong>Bonfiglioli</strong> Riduttori S.p.A. Italy € 30,000,000 Parent company<br />
<strong>Bonfiglioli</strong> Canada Inc. Canada CAD 4,000,000 100% 100%<br />
<strong>Bonfiglioli</strong> U.S.A. Inc. U.S.A. USD 4,000,000 100% 100%<br />
<strong>Bonfiglioli</strong> Deutschland GmbH Germany € 3,000,000 100% 100%<br />
<strong>Bonfiglioli</strong> Skandinavien AB Sweden SEK 2,985,000 67% 67%<br />
<strong>Bonfiglioli</strong> Transmissions S.A. France € 1,900,000 100% 100%<br />
<strong>Bonfiglioli</strong> Transmission (Aust) Pty Ltd Australia AUD 7,500,004 100% 100%<br />
<strong>Bonfiglioli</strong> U.K. Ltd Great Britain GBP 200,000 100% 100%<br />
<strong>Bonfiglioli</strong> Power Transmission Pty Ltd South Africa ZAR 64,000 75% 75%<br />
<strong>Bonfiglioli</strong> South Africa Pty Ltd (*) South Africa ZAR 10,000,000 56.25% 56.25%<br />
<strong>Bonfiglioli</strong> Transmission Pvt Ltd India INR 400,000,000 100% 100%<br />
<strong>Bonfiglioli</strong> Drives (Shanghai) Co. Ltd China USD 1,000,000 100% 100%<br />
<strong>Bonfiglioli</strong> Vectron Gmbh (**) Germany € 500,000 97% 97%<br />
Tecnoingranaggi Riduttori Srl Unip. Italy € 96,900 100% 100%<br />
<strong>Bonfiglioli</strong> Italia S.p.A. Italy € 16,000,000 100% 100%<br />
<strong>Bonfiglioli</strong> Slovakia Sro Slovakia € 14,937,263 100% 100%<br />
<strong>Bonfiglioli</strong> Power Trasmission Jsc Turkey TRY 500,000 75% 75%<br />
<strong>Bonfiglioli</strong> Vietnam Ltd Vietnam USD 10,000,000 80% 80%<br />
<strong>Bonfiglioli</strong> Redutores do Brasil Brazil BRL 2,000,000 70% 70%<br />
<strong>Bonfiglioli</strong> Österreich GmbH (**) Austria € 35,000 100% –<br />
(*) Subsidiary indirectly controlled through <strong>Bonfiglioli</strong> Power Transmission Pty Ltd<br />
(**) Subsidiary indirectly controlled through <strong>Bonfiglioli</strong> Deutschland GmbH<br />
With reference to the changes during the corporate year, we point out that Slovakia joined the Euro<br />
area with consequent conversion of its accounting and share capital, and the company <strong>Bonfiglioli</strong><br />
Österreich GmbH, fully controlled by <strong>Bonfiglioli</strong> Deutschland GmbH, was established. At 31 st Decem-<br />
ber <strong>2009</strong> that company was still not operating.<br />
63<br />
<strong>Annual</strong> <strong>Report</strong> <strong>2009</strong>
64<br />
power<br />
control<br />
green<br />
solutions<br />
Drafting principles<br />
The structure of the balance sheet and the income statement are as required by Italian Legislative<br />
Decree 127/91.<br />
Items preceded by Arabic numerals having zero contents have been omitted both in the current and<br />
in previous financial statements.<br />
The balance sheet provides separate indication of shareholders’ equity and the minority interests<br />
share of profits. No asset or liability items are recorded under more than one caption in the layout.<br />
Consolidation principles<br />
A. In preparing the financial statements for the consolidated companies, the net assets method is<br />
used (line-by-line), consisting in recording all the captions under assets and liabilities and in the<br />
income statement in their entirety.<br />
B. The book value of consolidated equity investments was written off against the related equity at<br />
the time of first consolidation and the resulting differences, if negative, were classified under a<br />
specific item of consolidated equity denominated “Consolidation Reserve”. Any positive differen-<br />
ces existing at the time of first consolidation were recorded in the consolidated financial state-<br />
ments, where possible, under the items of assets of the companies included in the consolidation<br />
area, or under the assets caption “Consolidation differences” for differences that, despite their<br />
characteristics of deferment affecting more than one year, could not be allocated to specific items<br />
under assets. In contrast, if these items were not considered to be deferred to more than one year,<br />
they were deducted from the consolidation reserve. For companies that were already controlled at<br />
1/1/1994 this date was considered as the moment of initial consolidation, since in 1994 it became<br />
mandatory to draw up a consolidated financial statement.<br />
C. The positive differences recorded were amortised in accordance with the rates utilised for the<br />
assets to which they refer; the consolidation difference is amortised throughout the estimated<br />
future working life of the assets in question.<br />
D. The results achieved, following initial consolidation, were subsequently entered under a specific<br />
caption of consolidated equity denominated “Profits and losses carried forward”.<br />
E. Any profits and losses that have yet to be realised in relation to third parties arising from transac-<br />
tions between Group companies were eliminated, as were the items that give rise to payables,<br />
receivables, costs and revenues.<br />
<strong>2009</strong> <strong>Annual</strong> <strong>Report</strong>
Notes to the consolidated financial statements<br />
F. The dividends distributed by consolidated companies within the Group were properly eliminated.<br />
G. The portions of shareholders’ equity and profit due to minority shareholders of the consolidated<br />
subsidiaries were deducted from the Group portions and recorded separately under specific cap-<br />
tions of consolidated equity and in the income statement.<br />
H. The financial statements of foreign companies were converted to Euro, applying the year-end<br />
exchange rate for all assets and liabilities and the average exchange rate calculated over the full<br />
twelve months for captions in the income statement. The items of equity, existing at the date<br />
of initial consolidation, are converted at the exchange rates effective at that date, while subse-<br />
quent changes are converted at the historic exchange rates effective at the date of the relative<br />
transactions. Conversion differences arising both from the conversion of equity captions to the<br />
year-end rates with respect to the historic rates, and existing between the average exchange rates<br />
and year-end exchange rates for the income statement, are recorded under a specific caption of<br />
consolidated equity denominated “Currency conversion reserve”.<br />
The exchange rates utilised for companies operating outside the Euro area are as follows:<br />
company Currency B.S.<br />
exchange<br />
rate <strong>2009</strong><br />
P.L.<br />
exchange<br />
rate <strong>2009</strong><br />
B.S.<br />
exchange<br />
rate 2008<br />
P.L.<br />
exchange<br />
rate 2008<br />
<strong>Bonfiglioli</strong> U.K. Ltd GBP 0.888 0.891 0.952 0.796<br />
<strong>Bonfiglioli</strong> Canada Inc. CAD 1.513 1.585 1.699 1.559<br />
<strong>Bonfiglioli</strong> Skandinavien Ab SEK 10.252 10.619 10.87 9.615<br />
<strong>Bonfiglioli</strong> USA Inc. USD 1.441 1.395 1.392 1.471<br />
<strong>Bonfiglioli</strong> Transmission (Aust) Pty Ltd AUD 1.601 1.773 2.027 1.742<br />
<strong>Bonfiglioli</strong> Power Transmission Pty Ltd ZAR 10.666 11.674 13.067 12.059<br />
<strong>Bonfiglioli</strong> Transmission Pvt Ltd INR 67.040 67.361 67.636 63.734<br />
<strong>Bonfiglioli</strong> Drives (Shanghai) Co. Ltd CNY 9.835 9.528 9.496 10.224<br />
<strong>Bonfiglioli</strong> Slovakia Sro (*) SKK N/A N/A 30.126 31.262<br />
<strong>Bonfiglioli</strong> Power Trasmission JSC TRY 2.155 2.163 2.149 1.906<br />
<strong>Bonfiglioli</strong> Redutores Do Brasil Ltda BRL 2.511 2.767 3.244 2.674<br />
<strong>Bonfiglioli</strong> Vietnam Ltd VND 26,617.1 24,846.2 24,321.8 24,177.2<br />
(*) transition to Euro during the year<br />
65<br />
<strong>Annual</strong> <strong>Report</strong> <strong>2009</strong>
66<br />
power<br />
control<br />
green<br />
solutions<br />
I. The following company is consolidated using the net equity method:<br />
Denomination Head office Share Capital % stake<br />
Tecnotrans <strong>Bonfiglioli</strong> S.A. Barcelona (Spain) € 2,175,000 33.33%<br />
Valuation criteria<br />
The accounting principles and valuation criteria adopted in drafting the financial statements are in<br />
compliance with the principles of the Italian Civil Code and the accounting standards prescribed by<br />
the National Council of Chartered Accountants (O.I.C.). Where such principles are lacking or insuffi-<br />
cient, the point of reference is provided by international accounting standards (IAS/IFRS) where these<br />
are compatible with Italian legal requirements.<br />
The consolidated financial statements were prepared in accordance with the general principles of<br />
clarity, truthfulness and fairness; specifically:<br />
• the items in the financial statements were valued in accordance with the general principle of pru-<br />
dence and on an accrual basis, applied in expectation that activities will continue;<br />
• account is taken of the risks and losses relating to the year, even when such risks and losses beca-<br />
me known after the end of that year;<br />
• the statements refer exclusively to profits realised at the closing date of the financial year;<br />
• income and expenses are considered to be relative to the year regardless of the effective collection<br />
or payment dates;<br />
• dissimilar components covered by single captions have been valued separately;<br />
• the valuation criteria did not change from those adopted in the previous year. You should remem-<br />
ber that in the previous year, in compliance with Italian Legislative Decree 185/2008, immovable<br />
assets of the Italian companies were revaluated at market value appraised in a technical report<br />
prepared by an external expert, whenever other objective factors on which a calculation could be<br />
based were not available. As illustrated below, the effects of this revaluation have impacted the<br />
income statement of <strong>2009</strong>;<br />
• no exceptional cases occurred that justified a departure from the provisions of legislative enact-<br />
ments.<br />
Specifically, the valuation criteria adopted in the preparation of the financial statements are as spe-<br />
cified below.<br />
<strong>2009</strong> <strong>Annual</strong> <strong>Report</strong>
Intangible fixed assets<br />
Notes to the consolidated financial statements<br />
Intangible fixed assets are recorded at purchasing cost increased by ancillary expenses or, if the as-<br />
sets were internally constructed, on the basis of the costs sustained directly or indirectly, entered in<br />
respect of the attributable portion.<br />
The cost, calculated as illustrated above, may be revaluated in certain cases if this action is permitted<br />
by the relative laws.<br />
Intangible fixed assets were systematically amortised on the basis of the following rates:<br />
Start-up costs 20%<br />
Patents & rights to use intellectual property 33.33% - 50%<br />
Concessions, licences, trademarks and similar rights 33.33%<br />
Goodwill 10 - 20%<br />
Other 20%<br />
Tangible fixed assets<br />
Plant and equipment are recorded in the financial statement at purchasing cost or construction cost,<br />
inclusive of all directly connected ancillary expenses and adjusted in the event that specific laws allow<br />
assets value to be adapted to the changes occurred in the buying power of the currency.<br />
The revaluation figure for an asset does not exceed the value actually attributable to it with reference<br />
to its likely economic use by the company or, if it does exceed this level, with reference to its sale<br />
value.<br />
Assets acquired through leasing contracts are recorded in accordance with the requirements of inter-<br />
national accounting standard IAS no. 17 which is, in turn, implemented by the accounting principle<br />
set down by the Italian National Council of Chartered Accountants with reference to consolidated<br />
financial statements. The financial method is therefore applied, involving the attribution of the histo-<br />
ric cost of the relative goods under assets, recording of the debt under liabilities, and reporting the<br />
financial expenses and depreciation in the income statement.<br />
Provisions made in lieu of depreciation are systematically allocated by the application of rates that<br />
are considered to accurately reflect the residual useful working life of the assets to which they refer.<br />
Ordinary costs for maintenance and repair are treated as operating costs; while extraordinary costs<br />
that extend the useful life or increase production capacity are added to the value of the asset.<br />
67<br />
<strong>Annual</strong> <strong>Report</strong> <strong>2009</strong>
68<br />
power<br />
control<br />
green<br />
solutions<br />
The ordinary annual rates utilised for the depreciation of tangible assets are as follows:<br />
Land and buildings dal 2% al 10%<br />
Plant and machinery dal 10% al 25%<br />
Trade & industrial fixtures dal 10% al 30%<br />
Other assets dal 10% al 30%<br />
Equity investments held as fixed assets<br />
The equity investment in the associated company Tecnotrans <strong>Bonfiglioli</strong> S.A. is entered on the basis of<br />
the net equity criterion, i.e. for an amount equivalent to the corresponding portion of shareholders’<br />
equity resulting from the latest financial statement of the company after deducting dividends and<br />
after recording any further consolidation adjustments having a significant impact.<br />
The other investments are recorded at their purchase cost adjusted, when necessary, for lasting loss in value.<br />
Inventories<br />
Inventories are valued in accordance with the general principle of the lower between purchaseing<br />
cost and market value:<br />
• raw materials are valued adopting the FIFO method;<br />
• work in progress is valued according to the stage of completion reached on the basis of the cost<br />
of materials, labour, industrial depreciation and indirect production costs;<br />
• semi-finished and finished products are valued adopting the FIFO method, on the basis of the cost<br />
of materials, labour, industrial depreciation and other production costs;<br />
• obsolete or slow-moving materials and products are valued according to their estimated useful life<br />
or future market value, by means of an entry under write-down provisions.<br />
Infra-group profits present within the inventories of the consolidated companies are eliminated.<br />
Receivables<br />
Receivables are entered at their presumed collection value through direct provision for bad debts and<br />
entry of a provision for bad debts reserve.<br />
Cash at banks and on hand<br />
Cash at banks and on hand is entered at nominal value, considered to represent the presumed rea-<br />
lisation value.<br />
Accruals and deferments<br />
For multi-year transactions, accruals and deferrals are calculated on a “pro tempore” basis.<br />
<strong>2009</strong> <strong>Annual</strong> <strong>Report</strong>
Notes to the consolidated financial statements<br />
Specifically, accrued income and deferred charges refer to revenues and costs of the year, although<br />
formally recorded in the following year; prepaid expenses and deferred income refer to expenses and<br />
income materially occurred during the current year, but that relate to future years.<br />
Reserves for risks and charges<br />
Reserves for risks and charges consider the provisions allocated to cover losses, or debts of a given<br />
nature and certain or probable existence, for which the exact amount or contingency date was not<br />
known at year-end. The allocations reflect the best possible estimation of the relative amounts based<br />
on available information. Risks for which a liability is only possible and not certain are illustrated in the<br />
Notes to the financial statements, without allocating a specific risks and charges provision.<br />
Employees severance indemnity<br />
The severance indemnity reserve is related to the number of the employees at year end n compliance<br />
with statutory legislation and applicable collective labour contracts.<br />
Payables<br />
Payables are entered at their nominal value with regard to the principal, while are classified as paya-<br />
bles if already due, or under accruals, according to the competence principle, if not yet due.<br />
Cost and revenue recognition<br />
Sales revenues and purchasing costs are recognised at the time of transfer of ownership, which gene-<br />
rally occurs at the time of shipment or at the time of receiving respectively, net of returns, discounts,<br />
allowances and premiums; the other revenues and costs (supplies of services, financial, etc.) are re-<br />
corded in accordance with the accrual principle.<br />
Costs and revenues arising between Group companies and infra-group dividends are eliminated.<br />
Taxes<br />
Income taxes are recorded based on the estimated tax burden for the year with reference to statutory<br />
tax regulations and taking account of exemptions and concessions applicable.<br />
Deferred and pre-paid taxes are recorded to take account of the fiscal effects both in relation to items<br />
of income or costs that concur in forming the profit for the year other than the year in which they<br />
contribute to forming the taxable income and in order to reflect the deferred fiscal effects relative to<br />
the consolidation adjustments<br />
Captions stated in foreign currency<br />
Transactions in foreign currency are converted into Euro at the historic exchange rates applying at<br />
the transaction dates. Exchange rate gains and losses incurred at the time of collection of receivables<br />
69<br />
<strong>Annual</strong> <strong>Report</strong> <strong>2009</strong>
70<br />
power<br />
control<br />
green<br />
solutions<br />
and settlement of payables in foreign currency are recorded in the income statement as specific items<br />
under financial income and expenses.<br />
Receivables and payables existing at year-end expressed in currencies other than Euro were converted<br />
at the exchange rates effective at year-end, also considering existing hedging contracts.<br />
The difference arising from these transactions (gain or loss) was verified and reflected in the income<br />
statement for the year, with the matching receivable or payable entry.<br />
Specifically, with regard to captions in foreign currency for which forward contracts were taken out<br />
to hedge against the relative exchange risk, the following valuation principle was adopted:<br />
• the difference generated between the value in Euro determined by the adoption of the historic ex-<br />
change rate at the time of registration of the transaction and the amount in Euro determined on<br />
the basis of the contractual spot exchange rate established was entered in the income statement<br />
with a matching trade receivable or payable entry;<br />
• the discount or premium involved in the transaction was recorded on an accrual basis with respect<br />
to its duration.<br />
Derivatives<br />
Contracts taken out to hedge exchange risks are measured in relation to the receivable or payable to<br />
which they refer.<br />
Exchange rate or interest rate swap contracts that are not correlated to the receivables and/ or paya-<br />
bles entered at the reference date of the financial statement are valued separately. If, in relation to<br />
the separate valuation, losses are predicted, these are recognised in the income statement and reflec-<br />
ted in a specific risks reserve; if the valuation points to the likelihood of profits, these are deferred to<br />
the moment of their effective realisation.<br />
Derivative contracts are valued in keeping with the hedged asset or liability or with the contractual<br />
undertaking assumed at the date of the financial statements. If the existence of a hedging relation-<br />
ship with the underlying financial transactions is not proven or is insufficiently documented, a fair<br />
value assessment is made of said financial instruments and, also on the basis of this latter valuation,<br />
any possible latent losses are estimated, making a commensurate allocation to the risks and charges<br />
reserve.<br />
Commitments and guarantees<br />
Contractual commitments and guarantees are entered under commitments at the value resulting<br />
from the contractual undertaking after deducting any liabilities that have already been recorded.<br />
<strong>2009</strong> <strong>Annual</strong> <strong>Report</strong>
Notes to the consolidated financial statements<br />
Significant events occurring after the closing of the year<br />
On 31 st March 2010 the Parent company signed a Debt Rescheduling Agreement referring to Italian<br />
companies of the Group and some foreign companies.<br />
The Agreement concerns consolidation and rescheduling of debt exposure to leading financial insti-<br />
tutions as follows:<br />
• extension until June 2016 of term loans with these institutions amounting to M€ 117.4 based<br />
upon a new depreciation plan (pre-depreciation until June 2012);<br />
• grant of short-term operative lines totalling M€ 76.3;<br />
• definition of a revolving line of credit (RCF) totalling M€ 15.<br />
Owing to the fact that the signing of the agreement occurred before approval of the financial state-<br />
ments, the effects of that agreement were taken into account in the debt exposure.<br />
For other relevant events we refer you to the Management report.<br />
71<br />
<strong>Annual</strong> <strong>Report</strong> <strong>2009</strong>
72<br />
power<br />
control<br />
green<br />
solutions<br />
Comments on the individual captions of the financial statements<br />
Balance sheet<br />
Fixed assets<br />
Intangible fixed assets<br />
Description Opening<br />
balance<br />
Historic cost<br />
<strong>2009</strong> <strong>Annual</strong> <strong>Report</strong><br />
Increases Decreases Other<br />
changes<br />
Closing<br />
balance<br />
- Start-up costs 62 - - - 62<br />
- Patents & rights to use intellectual property 15,482 444 - (554) 15,372<br />
- Concessions, licences, trademarks 1,287 196 - 683 2,166<br />
- Consolidation differences 19,995 - - - 19,995<br />
- Assets in progress and advances 123 23 - (123) 23<br />
- Other 3,890 620 (9) (43) 4,458<br />
Total (A) 40,839 1,283 (9) (37) 42,076<br />
Accumulated amortisation<br />
- Start-up costs 29 12 - - 41<br />
- Patents & rights to use intellectual property 15,038 385 - (358) 15,065<br />
- Concessions, licences, trademarks 1,196 262 - 360 1,818<br />
- Consolidation differences 15,408 1,449 - - 16,857<br />
- Other 592 404 (2) (2) 992<br />
Total (B) 32,263 2,512 (2) - 34,773<br />
Net values<br />
- Start-up costs 33 (12) - - 21<br />
- Patents & rights to use intellectual property 444 59 - (196) 307<br />
- Concessions, licences, trademarks 91 (66) - 323 348<br />
- Consolidation differences 4,587 (1,449) - - 3,138<br />
- Assets in progress and advances 123 23 - (123) 23<br />
- Other 3,298 216 (7) (41) 3,466<br />
Total (A-B) 8,576 (1,229) (7) (37) 7,303<br />
The “other changes” column includes cancellations of the fully amortised items and the effect of the<br />
exchange rate fluctuation as well as reclassifications made for a more homogeneous presentation of<br />
various items.
Start-up costs<br />
Notes to the consolidated financial statements<br />
These cover start-up costs and expenses incurred in amending the articles of association of the com-<br />
pany <strong>Bonfiglioli</strong> Italia S.p.A., recorded in the statement with the consent of the Panel of Auditors.<br />
Patents & rights to use intellectual property<br />
This caption includes deferred expenses sustained for the registration of industrial patents and the<br />
costs sustained for application software purchased outright and/or under open term license.<br />
The increase in the year is mainly due to the purchase and implementation of software for IT resource<br />
planning of the companies.<br />
In keeping with art. 10 of Italian Law 72/83 the values resulting from monetary revaluation are indi-<br />
cated below:<br />
Description Rev. L. 342/2000<br />
- Patents & rights to use intellectual property 5,547<br />
Total (A) 5,547<br />
This revaluation had no effect on the income statement for the year since it had already been fully<br />
amortised.<br />
Concessions, licences, trademarks and similar rights<br />
In the most part these costs are constituted by trademark registration charges.<br />
Goodwill and consolidation differences<br />
The value recorded stems from differences upon consolidation, amounting to goodwill, recorded in<br />
the financial statement with the consent of the Panel of Auditors, namely:<br />
company Goodwill Amortisation<br />
Tecnoingranaggi Srl 2,994 10%<br />
<strong>Bonfiglioli</strong> Transmission France S.A. 40 20%<br />
<strong>Bonfiglioli</strong> Redutores Do Brasil Ltda 104 20%<br />
Total 3,138<br />
The consolidation difference relative to the investments in the subsidiaries <strong>Bonfiglioli</strong> Vectron GmbH<br />
(Germany) and <strong>Bonfiglioli</strong> Power Transmission JSC (Turkey) were fully amortised at the end of <strong>2009</strong>.<br />
73<br />
<strong>Annual</strong> <strong>Report</strong> <strong>2009</strong>
74<br />
power<br />
control<br />
green<br />
solutions<br />
Assets in progress and advances<br />
The decrease in the year in assets in progress and advances is mainly due to completion by the Parent<br />
company of implementation of new software, which began during the previous year.<br />
Other<br />
In the most part these costs are composed of maintenance increases in the value of third parties assets.<br />
Tangible fixed assets<br />
Description Opening<br />
balance<br />
Historic cost<br />
<strong>2009</strong> <strong>Annual</strong> <strong>Report</strong><br />
Increases Decreases Other<br />
changes<br />
Closing<br />
balance<br />
- Land and buildings 134,323 2,413 (7) 1,051 137,780<br />
- Plant and machinery 185,255 9,208 (4,165) 4,622 194,920<br />
- Trade & industrial fixtures 58,957 5,119 (2,066) (29) 61,981<br />
- Other assets 15,720 891 (443) 410 16,578<br />
- Assets in progress and advances 8,798 2,868 (733) (5,260) 5,673<br />
Total (A) 403,053 20,499 (7,414) 794 416,932<br />
Accumulated amortisation<br />
- Land and buildings 8,105 3,218 53 61 11,437<br />
- Plant and machinery 125,031 12,129 (2,970) 187 134,377<br />
- Trade & industrial fixtures 43,284 5,963 (1,617) (198) 47,432<br />
- Other assets 10,069 1,546 (369) 355 11,601<br />
Total (B) 186,489 22,856 (4,903) 405 204,847<br />
Net values<br />
- Land and buildings 126,218 (805) (60) 990 126,343<br />
- Plant and machinery 60,224 (2,921) (1,195) 4,435 60,543<br />
- Trade & industrial fixtures 15,673 (844) (449) 169 14,549<br />
- Other assets 5,651 (655) (74) 55 4,977<br />
- Assets in progress and advances 8,798 2,868 (733) (5,260) 5,673<br />
Total (A-B) 216,564 (2,357) (2,511) 389 212,085<br />
The column “other changes” includes exchange rate differences and reclassification of individual<br />
captions.
Notes to the consolidated financial statements<br />
For an analysis of the investments made during the year we refer you to the Management report.<br />
Within the meaning and for the purposes envisaged in article 10 of Italian Law no. 72 dated 19/03/1983<br />
and subsequent amendments and additions thereto, an indication is provided of assets still recognised<br />
in equity for which monetary revaluation has been carried out, specifying the relative amounts:<br />
Description Rev.<br />
L. 72/83<br />
Rev.<br />
L. 413/91<br />
Rev.<br />
L. 342/00<br />
Rev.<br />
L. 2/09<br />
Other Total<br />
- Land and buildings 406 2,264 - 45,731 686 49,087<br />
- Plant and machinery 354 - 21,824 - 310 22,488<br />
- Trade & industrial fixtures 352 - - - - 352<br />
- Other assets 33 - - - - 33<br />
Total (A) 1,145 2,264 21,824 45,731 996 71,960<br />
It is clarified that the revaluation pursuant to Italian Law 2/<strong>2009</strong> has led to a K€ 287 increase in de-<br />
preciation on the income statement.<br />
Financial fixed assets<br />
Investments<br />
The following table provides a breakdown of the “Investments” item and the changes that occurred<br />
during the year:<br />
Description<br />
INVESTMENTS<br />
Opening<br />
balance<br />
Increases Decreases<br />
Other<br />
changes<br />
Closing<br />
balance<br />
- in associated companies 3,957 - - (429) 3,528<br />
- in other companies 56 - (28) -- 28<br />
Total 4,013 - (28) (429) 3,556<br />
Decreases during the year refer to elimination of the book value of the investment, amounting to<br />
15% of the share capital of the Turkish company Omega Endustriel Ltd, a company that in turn has<br />
an interest in the share capital of the Turkish subsidiary <strong>Bonfiglioli</strong> Power Transmission JSC, made<br />
necessary following a loss in value of the Turkish subsidiary.<br />
75<br />
<strong>Annual</strong> <strong>Report</strong> <strong>2009</strong>
76<br />
power<br />
control<br />
green<br />
solutions<br />
The “other changes” entry refers to the portion of loss for the year attributable to the associated<br />
company Tecnotrans <strong>Bonfiglioli</strong> S.A. (K€ 429).<br />
The following table gives details of the associated shareholding:<br />
company Tecnotrans <strong>Bonfiglioli</strong> S.A.<br />
Head office Barcelona (Spain)<br />
Share Capital 2,175 K€<br />
Share held 33,33%<br />
Shareholders’ equity at 31/12/<strong>2009</strong> 10,583 K€<br />
Loss at 31/12/<strong>2009</strong> (1,169) K€<br />
Book value 3,528 K€<br />
Working capital<br />
Inventory<br />
<strong>2009</strong> 2008 Changes<br />
Raw materials, supplies and consumables 20,256 33,677 (13,421)<br />
Work in progress and semi-finished goods 45,409 74,807 (29,398)<br />
Finished goods and goods for resale 79,460 95,449 (15,989)<br />
Advances 151 114 37<br />
Total 145,276 204,047 (58,771)<br />
The foregoing amounts are net of obsolescence reserve, made up as follows:<br />
<strong>2009</strong> 2008 Changes<br />
Raw materials, supplies and consumables 4,770 3,829 941<br />
Semi-finished products 9,153 7,066 2,087<br />
Finished goods 7,063 3,937 3,126<br />
Total 20,986 14,832 6,154<br />
Changes in the provision are shown below:<br />
Provision for inventory obsolescence <strong>2009</strong> 2008<br />
Opening value 14,832 13,338<br />
Increases 5,932 1,752<br />
Decreases (16) -<br />
Other changes 238 (258)<br />
Closing value 20,986 14,832<br />
<strong>2009</strong> <strong>Annual</strong> <strong>Report</strong>
Notes to the consolidated financial statements<br />
The decrease in stock from 2008 is connected to stock reduction policy carried out throughout the<br />
Group. The increase in the provision for inventory obsolescence led to the worsening of the stock<br />
rotation index (from an average of 111 days in 2008 to an average of 131 days in <strong>2009</strong>).<br />
Receivables<br />
Trade receivables<br />
<strong>2009</strong> 2008 Changes<br />
Trade receivables from customers 105,068 143,137 (38,069)<br />
Receivables from associated companies 4,920 11,760 (6,840)<br />
(minus) Bad debt reserve (8,955) (6,846) (2,109)<br />
Total 101,033 148,051 (47,018)<br />
The reduction in trade receivables is attributable mainly to reduced growth in turnover from last year<br />
(-40% compared to he 2008 figure).<br />
Receivables from the associated company Tecnotrans <strong>Bonfiglioli</strong> S.A. relate to amounts due from the<br />
sale of goods and services, which was conducted at arm’s length conditions.<br />
Receivables from customers are recorded net of provision for bad debts, a breakdown of which is<br />
given below:<br />
Provision for bad debts <strong>2009</strong> 2008<br />
Opening value 6,846 5,512<br />
Provisions 2,665 1,971<br />
Applications (555) (622)<br />
Change in consolidation area - 12<br />
Other changes (1) (27)<br />
Closing value 8,955 6,846<br />
Breakdown of trade receivables by geographical area:<br />
Trade receivables <strong>2009</strong> 2008<br />
Italy 31,322 58,112<br />
Europe 28,573 51,209<br />
Overseas 41,138 38,730<br />
Total 101,033 148,051<br />
77<br />
<strong>Annual</strong> <strong>Report</strong> <strong>2009</strong>
78<br />
power<br />
control<br />
green<br />
solutions<br />
Other receivables<br />
<strong>2009</strong> <strong>Annual</strong> <strong>Report</strong><br />
<strong>2009</strong> 2008 Changes<br />
Tax receivables 19,208 22,288 (3,080)<br />
Prepaid taxes 25,574 15,122 10,452<br />
Receivables from others 4,272 4,989 (717)<br />
Total 49,054 42,399 6,655<br />
Tax receivables can be broken down as follows:<br />
Tax Receivables <strong>2009</strong> 2008<br />
Short-term receivables<br />
VAT credits 4,790 15,442<br />
Direct tax credits 1,833 -<br />
Other 62 126<br />
Total short-term tax credits 6,685 15,568<br />
Mid-long-term receivables<br />
VAT refunds 12,394 6,438<br />
Direct tax refunds 110 282<br />
Other tax refunds 19 -<br />
Total mid-long-term tax credits 12,523 6,720<br />
Total 19,208 22,288<br />
The increase in VAT refunds under mid-long-term receivables is attributable to the <strong>2009</strong> VAT credit of<br />
the Parent company, which is to be refunded over the next five years.<br />
Changes in pre-paid taxes are as follows:<br />
<strong>2009</strong> 2008<br />
Opening balance 15,122 12,618<br />
Provisions 11,213 3,401<br />
Applications (788) (889)<br />
Change in mean share - -<br />
Other changes 27 (8)<br />
Closing Balance 25,574 15,122<br />
The increase during the year is attributable to the allocation of prepaid taxes for losses of the Parent<br />
company which led to provisions for deferred taxes of 6.3 M€.
Other receivables can be broken down as follows:<br />
Notes to the consolidated financial statements<br />
Other receivables <strong>2009</strong> 2008<br />
Short-term receivables<br />
Receivables from employees 115 102<br />
Advances to suppliers 561 839<br />
Deposits 44 -<br />
Receivables for customs duties 210 161<br />
Receivables from social security institutions 1,116 142<br />
Currency exchange gains - 1,440<br />
Other 137 344<br />
Total other short-term receivables 2,183 3,028<br />
Mid-long-term receivables<br />
Receivables for pensions fund insurance 1,746 1,608<br />
Guarantee deposits 307 323<br />
Other 36 30<br />
Total other mid-long-term receivables 2,089 1,961<br />
Total 4,272 4,989<br />
The increase in the item receivables from social security institutions originates from a social security<br />
credit claimed by the Parent company for advances on the Layoff Benefits Fund.<br />
No receivables having a term exceeding five years were recorded.<br />
Cash at banks and on hand<br />
<strong>2009</strong> 2008 Changes<br />
Bank and post office deposits 65,070 18,076 46,994<br />
Cash and cash equivalents 42 38 4<br />
Total 65,112 18,114 46,998<br />
For a comprehensive evaluation of the change in the Group net cash position we invite you to refer<br />
to the section in which the company’s debts are analysed and to the cash-flow statement.<br />
79<br />
<strong>Annual</strong> <strong>Report</strong> <strong>2009</strong>
80<br />
power<br />
control<br />
green<br />
solutions<br />
Accrued income and deferred charges<br />
<strong>2009</strong> <strong>Annual</strong> <strong>Report</strong><br />
<strong>2009</strong> 2008 Changes<br />
Total 926 1,049 (123)<br />
Breakdown:<br />
<strong>2009</strong> 2008<br />
Advertising 71 17<br />
Insurance policies 123 67<br />
Hire charges and rentals 125 191<br />
Non competition outgoing shareholder Turkey 223 335<br />
Other 384 439<br />
Total 926 1,049<br />
Shareholders’ equity<br />
As at 31/12/<strong>2009</strong> the overall share capital of € 30,000,000.00 was represented by 30,000,000 ordi-<br />
nary shares with par value of € 1.00 each.<br />
Reconciliation statement between shareholders equity and income for the year<br />
at 31st december <strong>2009</strong> of Parent company <strong>Bonfiglioli</strong> Riduttori S.p.A.<br />
Result<br />
for the year<br />
Shareholders’<br />
equity<br />
<strong>Bonfiglioli</strong> Riduttori S.p.A. statutory financial statement (29,522) 180,250<br />
Accounting of the shareholders’ equity and results of consolidated and associated<br />
equity investments to replace book value in the financial statement<br />
of the Parent company, net of infra-group dividends<br />
(2,468) 43,729<br />
Shareholders’ equity and profit attributable to minority interests (202) (3,962)<br />
Elimination of infra-group profits on stock (748) (19,768)<br />
Reversal of infra-group contribution 363 (2,733)<br />
Leasing agreement recorded using financial method 1,134 5,493<br />
Other minor items (527) (47)<br />
Consolidated Group financial statement (31,970) 202,962
Statement of changes in consolidated shareholders’ equity as at 31st december <strong>2009</strong><br />
Other reserves Retained Net<br />
Share Legal Revaluation<br />
earnings income<br />
Consolidation Currency Other<br />
Total<br />
Capital reserve reserve<br />
carried (Net<br />
reserve conversion<br />
forward loss)<br />
reserve<br />
Balance as at 31/12/2006 15,000 3,000 35,847 16,395 (3,314) 57,876 11,745 17,193 153,742<br />
Allocation of net income for 2006 - - - - - 15,187 2,006 (17,193) -<br />
Notes to the consolidated financial statements<br />
Increase in share capital of Parent company 15,000 - (15,000) - - - - - -<br />
Distribution of Parent company dividends - - - - - (1,500) - - (1,500)<br />
Deconsolidation of <strong>Bonfiglioli</strong> Hellas S.A. - - - (132) 56 - 76 - -<br />
Currency conversion differences - - - - (829) - - - (829)<br />
Net income (Loss) of the Group for 2007 - - - - - - - 25,645 25,645<br />
Balance as at 31/12/2007 30,000 3,000 20,847 16,263 (4,087) 71,563 13,827 25,645 177,058<br />
Allocation of net income for 2007 - 891 - - - 16,934 7,820 (25,645) -<br />
Monetary revaluation pursuant to Italian Law 2/<strong>2009</strong> - - 39,348 - - - (1,264) - 38,084<br />
Currency conversion differences - - - - (2,858) - - - (2,858)<br />
Net income (Loss) of the Group for 2008 - - - - - - - 20,917 20,917<br />
Balance as at 31/12/2008 30,000 3,891 60,195 16,263 (6,945) 88,497 20,383 20,917 233,201<br />
Allocation of net income for 2008 - 349 - - - 6,623 13,945 (20,917) -<br />
Currency conversion differences - - - - 1,731 - - - 1,731<br />
Net income (Loss) of the Group for <strong>2009</strong> - - - - - - - (31,970) (31,970)<br />
Balance as at 31/12/<strong>2009</strong> 30,000 4,240 60,195 16,263 (5,214) 95,120 34,328 (31,970) 202,962<br />
The change in the currency conversion reserve is due mainly to the strengthening of the Australian Dollar, the South African Rand and the Brazilian Real with<br />
respect to the Euro.<br />
81<br />
<strong>Annual</strong> <strong>Report</strong> <strong>2009</strong>
82<br />
power<br />
control<br />
green<br />
solutions<br />
Minority shareholders’ equity<br />
<strong>2009</strong> <strong>Annual</strong> <strong>Report</strong><br />
Minority<br />
profit/loss<br />
Minority<br />
capital and<br />
reserves<br />
Minority<br />
interests<br />
shareholders’<br />
equity<br />
Balance as at 31/12/2008 1,282 2,849 4,131<br />
Allocation of net income for 2008 (1,282) 1,282 -<br />
Distribution of dividends - (787) (787)<br />
Currency conversion differences - 416 416<br />
Net income for <strong>2009</strong> attributable to minority interests 202 - 202<br />
Balance as at 31/12/<strong>2009</strong> 202 3,760 2,962<br />
The caption originates from the attribution to minority shareholders of the portion of shareholders’<br />
equity and net income deriving from the full consolidation of the following companies:<br />
company<br />
Profit Capital<br />
and<br />
reserves<br />
<strong>2009</strong> 2008<br />
Total Profit Capital<br />
and<br />
reserves<br />
<strong>Bonfiglioli</strong> Vectron GmbH (7) 172 165 - 172 172<br />
<strong>Bonfiglioli</strong> Power Transmission Pty Ltd (*) 519 1,748 2,267 499 1,041 1,540<br />
<strong>Bonfiglioli</strong> Skandinavien AB 38 89 127 (29) 112 83<br />
<strong>Bonfiglioli</strong> Power Trasmission JSC (381) 134 (247) (90) 225 135<br />
<strong>Bonfiglioli</strong> Do Brasil Ltda 33 280 313 902 (38) 864<br />
<strong>Bonfiglioli</strong> Vietnam Ltd - 1,337 1,337 - 1,337 1,337<br />
Total 202 3,760 3,962 1,282 2,849 4,131<br />
(*) Also includes the results recorded by <strong>Bonfiglioli</strong> South Africa Pty Ltd.<br />
As highlighted on the table above, the Turkish company has generated a negative shareholders’ equi-<br />
ty, which led to a reduction of the minority shareholders’ equity. Owing to the fact that during the<br />
month of April 2010, the Parent company alone had made good the losses of the Turkish company by<br />
subscribing the entire increase in the share capital of 4.0 MTRY, the “receivable” from Turkish mino-<br />
rity shareholders has been compensated by recording a suitable investment risk fund on the balance<br />
sheet, which will be discussed in the next section.<br />
Total
Reserves for risks and charges<br />
Notes to the consolidated financial statements<br />
<strong>2009</strong> 2008 Changes<br />
Statutory retirement pay fund and similar obligations 1,723 1,801 (78)<br />
Tax fund 10,629 10,170 459<br />
Other provisions 12,399 8,085 4,314<br />
Total 24,751 20,056 4,695<br />
Statutory retirement pay fund and similar obligations<br />
This item shows the sales agents’ indemnity reserve, which saw the following changes:<br />
<strong>2009</strong> 2008<br />
Opening value 1,801 1,787<br />
Provisions 80 153<br />
Applications (159) (139)<br />
Other changes 1 -<br />
Closing value 1,723 1,801<br />
Deferred taxes<br />
With reference to the deferred tax provision, changes in the year are broken down as follows:<br />
Deferred Tax Provision <strong>2009</strong> 2008<br />
Opening value 10,170 7,115<br />
Provision for deferred taxation 832 1,300<br />
Applications/releases (386) (3,970)<br />
Other changes 13 5,725<br />
Closing value 10,629 10,170<br />
83<br />
<strong>Annual</strong> <strong>Report</strong> <strong>2009</strong>
84<br />
power<br />
control<br />
green<br />
solutions<br />
Other reserves for risks and charges<br />
This caption can be broken down as follows:<br />
Description<br />
<strong>2009</strong> <strong>Annual</strong> <strong>Report</strong><br />
Opening<br />
balance<br />
Provisions Applications Other changes<br />
Balance<br />
closing<br />
Warranty reserve 4,481 1,078 (158) 7 5,408<br />
Legal risks reserve 536 - (36) - 500<br />
Other 3,068 4,681 (1,249) (9) 6,491<br />
Total 8,085 5,759 (1,443) (2) 12,399<br />
Following a great reduction in the Group’s turnover, attributable mainly to the economic and financial<br />
crisis, during <strong>2009</strong> review of the Group’s organisational structure, which began in previous years, was<br />
accelerated in order to tackle the changed market scenario in a more efficient way. Owing to this pro-<br />
cess the Group considered it opportune to set aside the relevant expected charges, confirmed by the<br />
new Industrial Plan for 2010-2014. These charges are recorded by the Parent company on the income<br />
statement among extraordinary items.<br />
The item “Other” includes a “Business reorganisation fund” set up by the Parent company and total-<br />
ling 5.1 M€ and the remainder of a customs duties fund created by the American subsidiary for a total<br />
of 0.7 M€. Also entered among other provisions are provisions for investment risks totalling 345 K€<br />
determined by considering the following items :<br />
• amounts due to minority shareholders due to the capital increase subscribed in the Turkish branch<br />
amounting to 264 K€;<br />
• a loss on transfer of 57% of the share capital of <strong>Bonfiglioli</strong> Skandinavien AB to be completed by<br />
mid-May 2010, the price of which has already been finalised by the parties.<br />
Employees’ severance indemnity reserve<br />
Changes in the severance indemnity fund in <strong>2009</strong> were as follows:<br />
<strong>2009</strong> 2008<br />
Opening balance 16,902 17,191<br />
Provisions 4,135 4,171<br />
Applications (4,371) (4,391)<br />
Other changes 72 (69)<br />
Closing balance 16,738 16,902
Notes to the consolidated financial statements<br />
In keeping with the provisions of Italian legislation relating to companies with an employed work<br />
force exceeding fifty, with effect from January 1 st 2007, sums allocated to the severance indemnity<br />
reserve are paid by the company into the individual pension funds held by the organisations indica-<br />
ted by each employee or by welfare bodies; the provisions caption therefore reflects increases in the<br />
severance indemnity reserve relating to members of the Group for which a reserve of this kind is still<br />
held by the company.<br />
The number of employees in the workforce during the year was as follows (spot and average data):<br />
31/12/<strong>2009</strong> 31/12/2008 <strong>2009</strong> average 2008 average<br />
- executives and managers 120 116 118 105<br />
- white collar and middle management 1,076 1,016 1,056 994<br />
- direct and indirect blue collar 1,612 1,572 1,594 1,465<br />
- temporary staff 15 108 19 104<br />
Total 2,823 2,812 2,787 2,668<br />
Payables<br />
Bonds<br />
<strong>2009</strong> 2008 Changes<br />
Bonds 5,648 6,319 (671)<br />
This item shows the following payables:<br />
• a bond issued by the Parent company on 8 th September 2005 maturing on 31 st December 2020,<br />
which is liable to interest at an annual rate of 3.2%. The foregoing loan, issued for a total of K€<br />
3,750, is recorded in the financial statement as at end of <strong>2009</strong> for K€ 2,750. As agreed in the<br />
Rescheduling Agreement, repayment of the bond has been deferred until repayment of the re-<br />
scheduled financial debt. The entire amount of the remaining debt recorded is collectable in full<br />
after five years;<br />
• a bond issued by the subsidiary “<strong>Bonfiglioli</strong> USA Inc.” for a total of KUSD 5,000 to support the<br />
investment made for the construction of the new factory premises completed during the year.<br />
At the end of <strong>2009</strong> the residual value recorded for the loan is KUSD 4,175. The amount due<br />
next year totals KUSD 280 (K€ 194), the debt falling due beyond next year but within a period<br />
85<br />
<strong>Annual</strong> <strong>Report</strong> <strong>2009</strong>
86<br />
power<br />
control<br />
green<br />
solutions<br />
of 5 years is KUSD 1,125 (K€ 781), while the portion due beyond five years totals KUSD 2,770<br />
(K€1,923). It is pointed out that the loan issued by “<strong>Bonfiglioli</strong> USA Inc.” is secured by a pledge<br />
n the company’s assets.<br />
Due to shareholders for financing<br />
<strong>2009</strong> <strong>Annual</strong> <strong>Report</strong><br />
<strong>2009</strong> 2008 Changes<br />
Amounts due to shareholders 378 - 378<br />
This item concerns a short-term financing granted to the Brazilian branch by the minority sharehol-<br />
der. This debt, which is interest-bearing at Brazilian market rates, will be repaid in full by the branch<br />
by next year.<br />
Short-term borrowings<br />
<strong>2009</strong> 2008 Changes<br />
Overdrafts, advances and financing < 12 months 66,090 37,535 28,555<br />
Financing with term > 12 months 143,438 129,769 13,669<br />
Total due to banks 209,528 167,304 42,224<br />
Amounts due to shareholders 378 - 378<br />
Amounts due to other financial institutions 20,451 22,403 (1,952)<br />
Bonds 5,648 6,319 (671)<br />
(minus) Cash at banks and on hand (65,112) (18,114) (46,998)<br />
Net Cash Position 170,893 177,912 (7,019)<br />
As shown also by the cash-flow statement, to which we invite you to refer, the improvement in net<br />
cash position is attributable to the reduction in net working capital as well as to the lesser impact of<br />
investment activities.<br />
The caption “due to other financial institutions” includes both the medium/long-term loans received<br />
from institutions other than banks (Ministry of Industry pursuant to Italian Law 46 - SIMEST Law 394)<br />
and also the residual portions of capital of leasing contracts recorded in accordance with IAS no. 17.<br />
The figure is recorded at face value with regard to the principal, whilst the interest due at the end of<br />
the year is recorded on an accrual basis.<br />
Changes occurring during the year with reference to bank loans with a term of over 12 months and<br />
amounts due to other financial institutions are detailed in the following table:
Guarantees<br />
Beyond<br />
5 years<br />
Beyond<br />
12 months<br />
Within<br />
12 months<br />
Balance as at<br />
31/12/<strong>2009</strong><br />
Exchange<br />
rate delta<br />
Amounts<br />
repaid<br />
Amounts<br />
loaned<br />
Balance as at<br />
31/12/2008<br />
company<br />
Financing with term > 12 months<br />
<strong>Bonfiglioli</strong> Riduttori S.p.A. 103,632 26,000 (16,135) - 113,497 2,068 62,518 48,911<br />
Tecnoingranaggi Riduttori Srl 662 - (90) - 572 - 309 263 (*)<br />
<strong>Bonfiglioli</strong> Trans. (Aust.) Pty Ltd 4,260 102 (377) 1,034 5,109 2,873 1,212 934 (*)<br />
<strong>Bonfiglioli</strong> Deutschland GmbH (**) 5,500 (275) - 5,225 290 1,327 3,608 (*)<br />
<strong>Bonfiglioli</strong> Transmission France S.A. 360 410 (24) - 746 - 403 343<br />
Notes to the consolidated financial statements<br />
<strong>Bonfiglioli</strong> Transmission PVT LTD (***) 4,276 2,550 (1,558) 23 5,291 1,770 2,629 892 (*)<br />
<strong>Bonfiglioli</strong> Slovakia Sro 8,500 - (1,372) - 7,128 873 3,927 2,328 (*)<br />
<strong>Bonfiglioli</strong> Power Trasmission JSC 1,518 3,873 (1,564) - 3,827 234 2,158 1,435 (*)<br />
<strong>Bonfiglioli</strong> Vietnam Ltd 1,061 1,147 - (92) 2,116 - 1,143 973 (*)<br />
<strong>Bonfiglioli</strong> Power Transmission Pty Ltd - 29 (10) (2) 17 9 8 -<br />
Total Financing with term > 12 months 129,769 34,111 (21,405) 963 143,438 8,117 75,634 59,687<br />
Due to other financial institutions<br />
<strong>Bonfiglioli</strong> Riduttori S.p.A. 18,799 3,740 (5,255) - 17,284 4,024 10,279 2,981<br />
<strong>Bonfiglioli</strong> Italia S.p.A. 843 - (358) - 485 369 116 -<br />
<strong>Bonfiglioli</strong> Transmission PVT LTD 2,032 - - 18 2,050 - 891 1,159<br />
<strong>Bonfiglioli</strong> USA Inc. - 17 (3) (1) 13 4 9 -<br />
<strong>Bonfiglioli</strong> Deutschland GmbH 729 - (110) - 619 118 474 27<br />
Total due to other financial institutions 22,403 3,757 (5,276) 17 20,451 4,515 11,769 4,167<br />
(*) Parent company Sureties<br />
(**) 5.8 M€ loan secured by pledge on owned factory premises<br />
(***) 9.7 M€ credit lines (short- and M/L-term) secured by pledge on assets of the company<br />
87<br />
<strong>Annual</strong> <strong>Report</strong> <strong>2009</strong>
88<br />
power<br />
control<br />
green<br />
solutions<br />
Trade payables<br />
<strong>2009</strong> <strong>Annual</strong> <strong>Report</strong><br />
<strong>2009</strong> 2008 Changes<br />
Advances 1,249 1,630 (381)<br />
Trade payables due to suppliers 77,603 141,215 (63,612)<br />
Amounts due to associated companies 42 16 26<br />
Total 78,894 142,861 (63,967)<br />
Breakdown of trade payables by geographical area:<br />
<strong>2009</strong> 2008<br />
Italy 55,636 108,733<br />
Europe 11,805 17,107<br />
Overseas 11,453 17,021<br />
Total 78,894 142,861<br />
The reduction in trade payables is attributable to a fall in volumes of production during the year as<br />
well as to stock reductionhroughout the Group.<br />
Other payables<br />
<strong>2009</strong> 2008 Changes<br />
Tax payables 3,140 5,878 (2,738)<br />
Amounts due to welfare and social security institutions 4,375 5,731 (1,356)<br />
Other payables 12,629 16,673 (4,044)<br />
Total 20,144 28,282 (8,138)<br />
Tax payables include the following items:<br />
Tax Payables <strong>2009</strong> 2008<br />
Short-term payables<br />
Direct taxes payable - 2,211<br />
Employees’ taxes 2,264 1,735<br />
Substitution tax 565 726<br />
Other 175 491<br />
Total short-term tax payables 3,004 5,163<br />
Mid-long-term payables<br />
Substitution tax 136 715<br />
Total mid-long-term tax payables 136 715<br />
Total 3,140 5,878
“Other payables” can be broken down as follows:<br />
Notes to the consolidated financial statements<br />
Other payables <strong>2009</strong> 2008<br />
Short-term payables<br />
Amounts due on acquisition of shareholdings 1,915 2,034<br />
Amounts due to employees 7,897 10,358<br />
Right to use land - Vietnam 211 419<br />
Currency exchange losses 164 -<br />
Other 1,003 1,269<br />
Total other short-term payables 11,190 14,080<br />
Mid-long-term payables<br />
Amounts due on acquisition of shareholdings 961 1,876<br />
Right to use land - Vietnam 428 642<br />
Other 50 75<br />
Total other mid-long-term liabilities 1,439 2,593<br />
Total 12,629 16,673<br />
Accrued expenses and deferred income<br />
<strong>2009</strong> 2008 Changes<br />
Total 889 1,354 (465)<br />
This item can be broken down as follows:<br />
<strong>2009</strong> 2008<br />
Interest payable on loans 575 1,110<br />
Insurance policies 45 89<br />
Exchange rate fluctuations 116 108<br />
Other 153 47<br />
Totale 889 1,354<br />
89<br />
<strong>Annual</strong> <strong>Report</strong> <strong>2009</strong>
90<br />
power<br />
control<br />
green<br />
solutions<br />
Memorandum accounts<br />
The following memorandum accounts are included at the foot of the balance sheet:<br />
<strong>2009</strong> <strong>Annual</strong> <strong>Report</strong><br />
<strong>2009</strong> 2008 Changes<br />
Total 6,838 6,526 312<br />
Guarantees granted by third parties refer to sureties issued on behalf of the Group by banks for tax<br />
rebate applications, medium/long-term guarantees in favour of banks for the concession of loans and<br />
in favour of third parties in relation to contractual undertakings or debts. To this 1.4 M€ is added,<br />
representing commitments for the acquisition of shareholdings (Vietnam) taken up by the Parent<br />
company.<br />
Income statement<br />
Net revenues from sales and services<br />
<strong>2009</strong> 2008 Changes<br />
Total 399,750 663,497 (263,747)<br />
Sales, which fell by 39.8% compared to the previous year, were made in the following geographical<br />
areas:<br />
Values in M€ <strong>2009</strong> % 2008 %<br />
Italy 74,0 18,5 166,6 25,1<br />
Europe 151,9 38,0 283,8 42,8<br />
Overseas 173,9 43,5 213,1 32,1<br />
Total 399,8 100,0 663,5 100,0<br />
For more details on the trend of the Group, we refer you to the Management report.<br />
Other revenues and income<br />
<strong>2009</strong> 2008 Changes<br />
Total 5,053 6,709 (1,656)
This item can be broken down as follows:<br />
Notes to the consolidated financial statements<br />
<strong>2009</strong> 2008<br />
Operating grants 143 -<br />
Refund for packaging and transport costs 1,374 2,215<br />
Refunds for defective processing/material 647 1,341<br />
Scrap sales 1,190 1,349<br />
Minor sales 626 682<br />
Capital gains and contingent assets 807 826<br />
Other 266 296<br />
Total 5,053 6,709<br />
Costs for raw materials, supplies, consumables and goods for resale<br />
<strong>2009</strong> 2008 Changes<br />
Total 156,837 372,315 (215,478)<br />
Costs for services<br />
<strong>2009</strong> 2008 Changes<br />
Total 80,508 150,659 (70,151)<br />
This caption includes outsourced processes totalling K€ 31,901 (K€ 75,602 in 2008), costs for com-<br />
mission, transport, advertising and other commercial services, remuneration of the Board of Directors<br />
and auditing bodies, insurance policies, consultancy, bank charges, electrical power, external labour,<br />
logistics and security services, travel expenses and other minor items.<br />
Costs for third parties assets use<br />
<strong>2009</strong> 2008 Changes<br />
Total 4,487 4,421 66<br />
This item mainly concerns the hiring of IT systems and motor vehicles, rentals for the lease of indu-<br />
strial plants and external depots, and royalties paid to third parties.<br />
91<br />
<strong>Annual</strong> <strong>Report</strong> <strong>2009</strong>
92<br />
power<br />
control<br />
green<br />
solutions<br />
Personnel costs<br />
<strong>2009</strong> <strong>Annual</strong> <strong>Report</strong><br />
<strong>2009</strong> 2008 Changes<br />
Salaries and wages 65,298 76,595 (11,297)<br />
Social security contributions 18,555 20,705 (2,150)<br />
Employees severance indemnity 4,135 4,171 (36)<br />
Other costs 30 92 (62)<br />
Total 88,018 101,563 (13,545)<br />
Amortisation/depreciation and write-downs<br />
<strong>2009</strong> 2008 Changes<br />
Amortisation of intangible fixed assets 2,512 2,895 (383)<br />
Depreciation of tangible fixed assets 22,856 19,840 3,016<br />
Bad debts provision 2,665 1,971 694<br />
Total 28,033 24,706 3,327<br />
Other provisions<br />
<strong>2009</strong> 2008 Changes<br />
Total 1,085 1,000 85<br />
This mainly reflects allocations made during the year to warranty reserve provisions.<br />
Other operating costs<br />
<strong>2009</strong> 2008 Changes<br />
Total 3,780 4,601 (821)<br />
This caption is a residual item and includes expenses and charges that cannot be classified under the<br />
previous headings. It relates to local taxes, general production, commercial, and minor administrative<br />
expenses, capital losses of an ordinary nature, and other minor items.
Interest receivable and financial income<br />
Notes to the consolidated financial statements<br />
<strong>2009</strong> 2008 Changes<br />
Total 695 667 28<br />
This caption can be broken down as follows:<br />
<strong>2009</strong> 2008<br />
Dividends from BEST Hellas S.A. - 19<br />
Interest receivable from associated companies 14 -<br />
Bank interest receivable 313 483<br />
Leasing rentals indexation 229 -<br />
Financial income from hedging transactions 20 62<br />
Commercial and other interest receivable 119 103<br />
Total 695 667<br />
Interest payable and financial expenses<br />
<strong>2009</strong> 2008 Changes<br />
Total 10,170 11,514 (1,344)<br />
This caption can be broken down as follows:<br />
<strong>2009</strong> 2008<br />
Interest on amounts due to banks 1,651 2,040<br />
Interest payable on loans 6,841 7,931<br />
Interest payable on leasing/business contracts 809 873<br />
Interest payable on bonds 94 102<br />
Discounts, premiums and expenses on derivatives (IRS and forward contracts) 647 525<br />
Other 128 43<br />
Total 10,170 11,514<br />
Exchange rate gains/losses<br />
<strong>2009</strong> 2008 Changes<br />
Total (1,194) (1,800) 606<br />
93<br />
<strong>Annual</strong> <strong>Report</strong> <strong>2009</strong>
94<br />
power<br />
control<br />
green<br />
solutions<br />
This amount can be broken down as follows:<br />
<strong>2009</strong> <strong>Annual</strong> <strong>Report</strong><br />
<strong>2009</strong> 2008<br />
Currency exchange gains 9,186 3,469<br />
Currency exchange losses (10,380) (5,269)<br />
Total (1,194) (1,800)<br />
Adjustments to financial assets<br />
<strong>2009</strong> 2008 Changes<br />
Total (457) 891 (1,348)<br />
This caption includes, in particular, the following items:<br />
<strong>2009</strong> 2008<br />
Share of the result of the associated company Tecnotrans (429) 891<br />
Write-down of investment in OMEGA (28)<br />
Total (457) 891<br />
Extraordinary income and expenses<br />
<strong>2009</strong> 2008 Changes<br />
Net total (7,276) (1,815) (5,461)<br />
This caption includes, in particular, the following items:<br />
<strong>2009</strong> 2008<br />
Insurance refunds 260 44<br />
Tax refunds from past years 262 -<br />
Contingent assets 464 467<br />
Contingent liabilities (574) (88)<br />
Taxes from past years (134) (160)<br />
Extraordinary restructuring expenses (3,000) -<br />
Provision to funds (4,554) (2,083)<br />
Total (7,276) (1,815)
Notes to the consolidated financial statements<br />
The item extraordinary restructuring expenses essentially consists of costs incurred by the Parent<br />
company in <strong>2009</strong> for restructuring debts and employees early retirement incentives. Costs related to<br />
these operations to incur during 2010 have been allocated by the Parent company in suitable restruc-<br />
turing funds totalling 4.1 M€.<br />
Current, deferred and prepaid taxes<br />
<strong>2009</strong> 2008 Changes<br />
Current taxes (3,321) (16,544) 13,223<br />
Deferred taxes (446) 2,670 (3,116)<br />
Prepaid taxes 10,425 2,391 8,034<br />
Total 6,658 (11,483) 18,141<br />
Further information<br />
Before closing this report, in order to complete the information required by article 38 of Italian Legi-<br />
slative Decree 127/1991 and other provisions of the Italian Civil Code, the following further informa-<br />
tion is set out below:<br />
Remuneration paid to directors and statutory auditors<br />
During the year the following amounts were paid out as remuneration to Group Directors and audi-<br />
ting bodies:<br />
<strong>2009</strong> 2008<br />
Directors 195 1,357<br />
Auditors 426 415<br />
Total 621 1,772<br />
The reduction in the remuneration to Directors recorded in the year came after the decision of the<br />
Board of Directors of the Parent company to give up their pay for <strong>2009</strong> in order to reduce the losses<br />
for the year and to make their contribution to the success of cost reduction plans.<br />
95<br />
<strong>Annual</strong> <strong>Report</strong> <strong>2009</strong>
96<br />
power<br />
control<br />
green<br />
solutions<br />
Operations with -related parties<br />
The Group has business relations with B.R.T. S.p.A., owned by shareholders and Directors of Bonfi-<br />
glioli Riduttori S.p.A..<br />
The company B.R.T. S.p.A. supplies spare parts in Italy on behalf of <strong>Bonfiglioli</strong> Riduttori S.p.A. and,<br />
partly, abroad.<br />
The business relations relate to the sale of components and products of <strong>Bonfiglioli</strong> Riduttori S.p.A.<br />
under normal market conditions and, taken as a whole, do not account for a significant figure, con-<br />
sidering the size of the Group.<br />
It is also pointed out that B.R.T. S.p.A. rents out 2 factory premises adjacent to the main factory pre-<br />
mises to <strong>Bonfiglioli</strong> Riduttori S.p.A., all under normal market conditions.<br />
Derivative financial instruments<br />
Derivatives<br />
In the drive to hedge financial risks the Group has entered into the following derivative contracts:<br />
Type of transaction<br />
Unlisted financial derivatives<br />
- Forward contracts<br />
<strong>2009</strong> <strong>Annual</strong> <strong>Report</strong><br />
Underlying<br />
Interest rates<br />
and debt instruments<br />
Notional<br />
value<br />
Fair value<br />
Exchange rates<br />
Notional<br />
value<br />
Fair value<br />
Pos. Neg Pos. Neg<br />
Sale of USD MUSD 7,4 n/a n/a<br />
Sale of GBP MGBP 4,4 n/a n/a<br />
Sale of AUD MAUD 8,6 n/a n/a<br />
Purchase of Yen MYEN 35,3 n/a n/a<br />
Purchase of USD MUSD 0,7 n/a n/a<br />
IRS M€ 29.0 K€ 331<br />
USD Put option MUSD 3,0 K€ 62<br />
USD Call option MUSD 1,5 K€ 17
Notes to the consolidated financial statements<br />
The exchange rate hedging operations relate exclusively to ordinary non-speculative hedging mana-<br />
gement operations involving credits and debts expressed in foreign currency.<br />
Calderara di Reno (Bo), 27 th May 2010<br />
On behalf of the BOARD OF DIRECTORS<br />
Sonia <strong>Bonfiglioli</strong><br />
97<br />
<strong>Annual</strong> <strong>Report</strong> <strong>2009</strong>
98<br />
power<br />
control<br />
green<br />
solutions<br />
Consolidated cash flow statement<br />
<strong>2009</strong> <strong>Annual</strong> <strong>Report</strong><br />
(in K€)<br />
<strong>2009</strong> 2008<br />
A. OPENING NET CASH POSITION (177,912) (140,255)<br />
B. OPERATING ACTIVITIES<br />
Net result of the Group (31,970) 20,917<br />
Minority interest net result 202 1,282<br />
Depreciation and write-downs 28,061 24,706<br />
Provisions for employee severance indemnity reserve and other reserves 5,220 5,171<br />
Share of results of associated companies 429 (644)<br />
Cash flow from operating activities before changes in working capital 1,942 51,432<br />
Decrease (Increase) in trade receivables 44,353 5,021<br />
Decrease (Increase) in inventory 58,771 (30,982)<br />
Decrease (Increase) in other assets (6,532) (12,650)<br />
(Decrease) Increase in trade payables (63,586) 5,002<br />
(Decrease) Increase in other liabilities (7,491) (2,189)<br />
(Payments) of employee severance indemnity and other reserves (1,148) (2,955)<br />
B. Cash flow from (for) operating activities 26,309 12,679<br />
C. INVESTING ACTIVITIES<br />
Net investments in tangible and intangible assets (18,830) (49,856)<br />
C. Cash flow from (for) investing activities (18,830) (49,856)<br />
D. FINANCING ACTIVITIES<br />
Net effect of exchange rate change 1,731 (2,858)<br />
Change in minority interests (1,405) 965<br />
Exchange rate (gains) losses on fixed assets (786) 1,413<br />
D. Cash flow from (for) financing activities (460) (480)<br />
E. CASH FLOW FOR THE YEAR (B+C+D) 7,019 (37,657)<br />
F. CLOSING NET CASH POSITION (A+E) (170,893) (177,912)
Notes to the consolidated financial statements<br />
99<br />
<strong>Annual</strong> <strong>Report</strong> <strong>2009</strong>
100<br />
power<br />
control<br />
green<br />
solutions<br />
<strong>2009</strong> <strong>Annual</strong> <strong>Report</strong>
Independent Auditors’ <strong>Report</strong><br />
101<br />
<strong>Annual</strong> <strong>Report</strong> <strong>2009</strong>
102<br />
power<br />
control<br />
green<br />
solutions<br />
Independent Auditors’ <strong>Report</strong><br />
<strong>2009</strong> <strong>Annual</strong> <strong>Report</strong><br />
AUDITORS’ REPORT IN ACCORDANCE WITH ARTICLE 2409-TER OF THE<br />
CIVIL CODE (NOW ARTICLE 14 OF THE LEGISLATIVE DECREE N. 39,<br />
JANUARY 27, 2010)<br />
To the Shareholders of<br />
<strong>Bonfiglioli</strong> Riduttori SpA<br />
1 We have audited the consolidated financial statements of <strong>Bonfiglioli</strong><br />
Riduttori SpA (hereinafter also the “<strong>Bonfiglioli</strong> Group”) as of December 31,<br />
<strong>2009</strong> and for the year then ended. <strong>Bonfiglioli</strong> Riduttori SpA’s Directors are<br />
responsible for the preparation of these consolidated financial statements in<br />
compliance with the laws governing the criteria for their preparation. Our<br />
responsibility is to express an opinion on these consolidated financial<br />
statements based on our audit.<br />
2 We conducted our audit in accordance with the auditing standards issued<br />
by the Italian Accounting Profession (CNDCEC) and recommended by<br />
Consob. Those standards require that we plan and perform the audit to<br />
obtain the necessary assurance about whether the consolidated financial<br />
statements are free of material misstatement and, taken as a whole, are<br />
presented fairly. An audit includes examining, on a test basis, evidence<br />
supporting the amounts and disclosures in the consolidated financial<br />
statements. An audit also includes assessing the accounting principles<br />
used and significant estimates made by the Directors. We believe that our<br />
audit provides a reasonable basis for our opinion.<br />
The audit of the consolidated financial statements as of December 31, <strong>2009</strong><br />
has been carried out in compliance with the law in force during such<br />
financial year.<br />
For the opinion on the consolidated financial statements of the prior period,<br />
which are presented for comparative purposes as required by law,<br />
reference is made to our report dated June 9, <strong>2009</strong>.<br />
3 In our opinion, the consolidated financial statements of <strong>Bonfiglioli</strong> Group as<br />
of December 31, <strong>2009</strong> comply with the laws governing the criteria for their<br />
preparation; accordingly, they give a true and fair view of the financial<br />
position and of the results of operations of the Group for the year then<br />
ended.<br />
Sede legale e amministrativa: Milano 20149 Via Monte Rosa 91 Tel. 0277851 Fax 027785240 Cap. Soc. 3.754.400,00 Euro i.v., C.F. e P.IVA<br />
e Reg. Imp. Milano 12979880155 Iscritta al n. 43 dell’Albo Consob – Altri Uffici: Bari 70124 Via Don Luigi Guanella 17 Tel.<br />
0805640211 – Bologna Zola Predosa 40069 Via Tevere 18 Tel. 0516186211 – Brescia 25123 Via Borgo Pietro Wuhrer 23 Tel. 0303697501<br />
– Firenze 50121 Viale Gramsci 15 Tel. 0552482811 – Genova 16121 Piazza Dante 7 Tel. 01029041 – Napoli 80121 Piazza dei<br />
Martiri 58 Tel. 08136181 – Padova 35138 Via Vicenza 4 Tel. 049873481 – Palermo 90141 Via Marchese Ugo 60 Tel. 091349737 – Parma<br />
43100 Viale Tanara 20/A Tel. 0521242848 – Roma 00154 Largo Fochetti 29 Tel. 06570251 – Torino 10129 Corso Montevecchio 37 Tel.<br />
011556771 – Trento 38122 Via Grazioli 73 Tel. 0461237004 - Treviso 31100 Viale Felissent 90 Tel. 0422696911 – Trieste 34125 Via Cesare<br />
Battisti 18 Tel. 0403480781 - Udine 33100 Via Poscolle 43 Tel. 043225789 – Verona 37122 Corso Porta Nuova 125 Tel.0458002561
Independent Auditors’ <strong>Report</strong><br />
4 The Directors of <strong>Bonfiglioli</strong> Riduttori SpA are responsible for the preparation<br />
of the <strong>Report</strong> on Operations in accordance with the applicable laws. Our<br />
responsibility is to express an opinion on the consistency of the <strong>Report</strong> on<br />
Operations with the consolidated financial statements, as required by the<br />
law. For this purpose, we have performed the procedures required under<br />
Auditing Standard PR 001 issued by the Italian Accounting Profession<br />
(CNDCEC). In our opinion, the <strong>Report</strong> on Operations is consistent with the<br />
consolidated financial statements of <strong>Bonfiglioli</strong> Group as of December 31,<br />
<strong>2009</strong>.<br />
Bologna, June 10, 2010<br />
PricewaterhouseCoopers SpA<br />
Signed by<br />
Roberto Sollevanti<br />
(Partner)<br />
This report has been translated into the English language from the original, which<br />
was issued in Italian language, solely for the convenience of international readers.<br />
(2)<br />
103<br />
<strong>Annual</strong> <strong>Report</strong> <strong>2009</strong>
power<br />
control<br />
green<br />
solutions
BONFIGLIOLI RIDUTTORI S.p.A.<br />
Via Giovanni XXIII, 7/A<br />
40012 Lippo di Calderara di Reno - Bologna (Italy)<br />
Tel. (+39) 051 6473111 - Fax (+39) 051 6473126<br />
bonfiglioli@bonfiglioli.com<br />
www.bonfiglioli.com<br />
Cod. 4001 R5