Annual Report 2012.pdf - Karo Bio
Annual Report 2012.pdf - Karo Bio
Annual Report 2012.pdf - Karo Bio

Create successful ePaper yourself
Turn your PDF publications into a flip-book with our unique Google optimized e-Paper software.
The share<br />
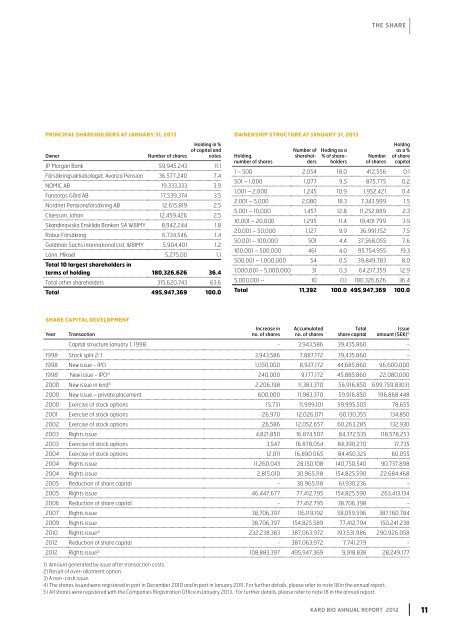
PRINCIPAL SHAREHOLDERS AT JANUARY 31, 2013<br />
Owner<br />
Number of shares<br />
Holding in %<br />
of capital and<br />
votes<br />
JP Morgan Bank 59,945,243 11.1<br />
Försäkringsaktiebolaget, Avanza Pension 36,577,240 7.4<br />
NOMIC AB 19,333,333 3.9<br />
Farstorps Gård AB 17,539,374 3.5<br />
Nordnet Pensionsförsäkring AB 12,615,819 2.5<br />
Claesson, Johan 12,459,426 2.5<br />
Skandinaviska Ensklida Banken SA W8IMY 8,942,244 1.8<br />
Robur Försäkring 6,734,546 1.4<br />
Goldman Sachs International Ltd, W8IMY 5,904,401 1.2<br />
Lönn, Mikael 5,275,00 1.1<br />
Total 10 largest shareholders in<br />
terms of holding 180,326,626 36.4<br />
Total other shareholders 315,620,743 63.6<br />
Total 495,947,369 100.0<br />
OWNERSHIP STRUCTURE AT JANUARY 31, 2013<br />
Holding,<br />
number of shares<br />
Number of<br />
shareholders<br />
Hoding as a<br />
% of shareholders<br />
Number<br />
of shares<br />
Holdng<br />
as a %<br />
of share<br />
capital<br />
1 – 500 2,054 18.0 412,556 0.1<br />
501 – 1,000 1,077 9.5 875,775 0.2<br />
1,001 – 2,000 1,245 10.9 1,952,421 0.4<br />
2,001 – 5,000 2,080 18.3 7,343,999 1.5<br />
5,001 – 10,000 1,457 12.8 11,252,889 2.3<br />
10,001 – 20,000 1,295 11.4 19,401 799 3.9<br />
20,001 – 50,000 1,127 9.9 36,991,152 7.5<br />
50,001 – 100,000 501 4.4 37,568,055 7.6<br />
100,001 – 500,000 461 4.0 95,754,955 19.3<br />
500,001 – 1,000,000 54 0.5 39,849,783 8.0<br />
1,000,001 – 5,000,000 31 0.3 64,217,359 12.9<br />
5,000,001 – 10 0.1 180,326,626 36.4<br />
Total 11,392 100.0 495,947,369 100.0<br />
SHARE CAPITAL DEVELOPMENT<br />
Year<br />
Transaction<br />
Increase in<br />
no. of shares<br />
Accumulated<br />
no. of shares<br />
Total<br />
share capital<br />
Issue<br />
amount (SEK) 1)<br />
Capital structure January 1, 1998 - 3,943,586 39,435,860 -<br />
1998 Stock split 2: 1 3,943,586 7,887,172 39,435,860 -<br />
1998 New issue - IPO 1,050,000 8,937,172 44,685,860 96,600,000<br />
1998 New issue - IPO 2) 240,000 9,177,172 45,885,860 22,080,000<br />
2000 New issue in kind 3) 2,206,198 11,383,370 56,916,850 699,759,8303)<br />
2000 New issue – private placement 600,000 11,983,370 59,916,850 196,868,448<br />
2000 Exercise of stock options 15,731 11,999,101 59,995,505 78,655<br />
2001 Exercise of stock options 26,970 12,026,071 60,130,355 134,850<br />
2002 Exercise of stock options 26,586 12,052,657 60,263,285 132,930<br />
2003 Rights issue 4,821,850 16,874,507 84,372,535 118,578,253<br />
2003 Exercise of stock options 3,547 16 878,054 84,390,270 17,735<br />
2004 Exercise of stock options 12,011 16,890 065 84,450,325 60,055<br />
2004 Rights issue 11,260,043 28,150,108 140,750,540 90,737,898<br />
2004 Rights issue 2,815,010 30,965,118 154,825,590 22,684,468<br />
2005 Reduction of share capital - 30,965,118 61,930,236 -<br />
2005 Rights issue 46,447,677 77,412,795 154,825,590 263,413,134<br />
2006 Reduction of share capital - 77,412,795 38,706,398 -<br />
2007 Rights issue 38,706,397 116,119,192 58,059,596 387,160,784<br />
2009 Rights issue 38,706,397 154,825,589 77,412,794 150,241,238<br />
2010 Rights issue 4) 232,238,383 387,063,972 193,531,986 290,926,058<br />
2012 Reduction of share capital - 387,063,972 7,741,279 -<br />
2012 Rights issue 5) 108,883,397 495,947,369 9,918,838 28,249,177<br />
1) Amount generated by issue after transaction costs.<br />
2) Result of over-allotment option.<br />
3) A non-cash issue.<br />
4) The shares issued were registered in part in December 2010 and in part in January 2011. For further details, please refer to note 18 in the annual report.<br />
5) All shares were registered with the Companies Registration Office in January 2013. For further details, please refer to note 18 in the annual report.<br />
KARO BIO <strong>Annual</strong> <strong>Report</strong> 2012 11