Annual Report 2012.pdf - Karo Bio
Annual Report 2012.pdf - Karo Bio
Annual Report 2012.pdf - Karo Bio

You also want an ePaper? Increase the reach of your titles
YUMPU automatically turns print PDFs into web optimized ePapers that Google loves.
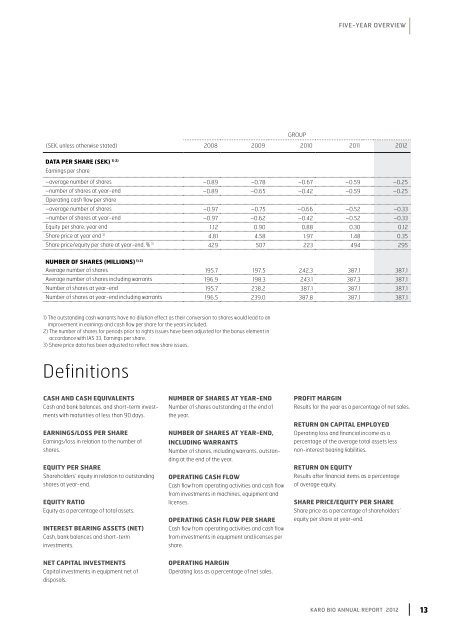
Five-year overview<br />
(SEK, unless otherwise stated) 2008 2009 2010 2011 2012<br />
GROUP<br />
1) 2)<br />
DATA PER SHARE (SEK)<br />
Earnings per share<br />
–average number of shares –0.89 –0.78 –0.67 –0.59 –0.25<br />
–number of shares at year-end –0.89 –0.65 –0.42 –0.59 –0.25<br />
Operating cash flow per share<br />
–average number of shares –0.97 –0.75 –0.66 –0.52 –0.33<br />
–number of shares at year-end –0.97 –0.62 –0.42 –0.52 –0.33<br />
Equity per share, year end 1.12 0.90 0.88 0.30 0.12<br />
Share price at year end 3) 4.81 4.58 1.97 1.48 0.35<br />
Share price/equity per share at year-end, % 3) 429 507 223 494 295<br />
1) 2)<br />
NUMBER OF SHARES (MILLIONS)<br />
Average number of shares 195.7 197.5 242.3 387.1 387.1<br />
Average number of shares including warrants 196.9 198.3 243.1 387.3 387.1<br />
Number of shares at year-end 195.7 238.2 387.1 387.1 387.1<br />
Number of shares at year-end including warrants 196.5 239.0 387.8 387.1 387.1<br />
1) The outstanding cash warrants have no dilution effect as their conversion to shares would lead to an<br />
improvement in earnings and cash flow per share for the years included.<br />
2) The number of shares for periods prior to rights issues have been adjusted for the bonus element in<br />
accordance with IAS 33, Earnings per share.<br />
3) Share price data has been adjusted to reflect new share issues.<br />
Definitions<br />
CASH AND CASH EQUIVALENTS<br />
Cash and bank balances, and short-term investments<br />
with maturities of less than 90 days.<br />
EARNINGS/LOSS PER SHARE<br />
Earnings/loss in relation to the number of<br />
shares.<br />
EQUITY PER SHARE<br />
Shareholders’ equity in relation to outstanding<br />
shares at year-end.<br />
EQUITY RATIO<br />
Equity as a percentage of total assets.<br />
INTEREST BEARING ASSETS (NET)<br />
Cash, bank balances and short-term<br />
investments.<br />
NUMBER OF SHARES AT YEAR-END<br />
Number of shares outstanding at the end of<br />
the year.<br />
NUMBER OF SHARES AT YEAR-END,<br />
INCLUDING WARRANTS<br />
Number of shares, including warrants, outstanding<br />
at the end of the year.<br />
OPERATING CASH FLOW<br />
Cash flow from operating activities and cash flow<br />
from investments in machines, equipment and<br />
licenses.<br />
OPERATING CASH FLOW PER SHARE<br />
Cash flow from operating activities and cash flow<br />
from investments in equipment and licenses per<br />
share.<br />
PROFIT MARGIN<br />
Results for the year as a percentage of net sales.<br />
RETURN ON CAPITAL EMPLOYED<br />
Operating loss and financial income as a<br />
percentage of the average total assets less<br />
non-interest bearing liabilities.<br />
RETURN ON EQUITY<br />
Results after financial items as a percentage<br />
of average equity.<br />
SHARE PRICE/EQUITY PER SHARE<br />
Share price as a percentage of shareholders’<br />
equity per share at year-end.<br />
NET CAPITAL INVESTMENTS<br />
Capital investments in equipment net of<br />
disposals.<br />
OPERATING MARGIN<br />
Operating loss as a percentage of net sales.<br />
KARO BIO <strong>Annual</strong> <strong>Report</strong> 2012 13