Annual Report 2012.pdf - Karo Bio
Annual Report 2012.pdf - Karo Bio
Annual Report 2012.pdf - Karo Bio

You also want an ePaper? Increase the reach of your titles
YUMPU automatically turns print PDFs into web optimized ePapers that Google loves.
Notes<br />
NOTE 8 INTEREST EXPENSE AND OTHER SIMILAR EXPENSES<br />
Interest expense and other similar expenses amounted to KSEK 15 (1,388 and<br />
2,500, respectively) for the Group. Of the amount, KSEK 1,370 was a cost for the<br />
adjustment for the Equity Credit Facility (EFC) agreement that the company entered<br />
into in 2010. Of the amount for 2011, KSEK 2,440 was an upfront payment<br />
of 1% of the ECF agreement that the Company entered into in 2010. Since the<br />
utilization of the ECF is conditional upon future resolutions of general meetings,<br />
this upfront payment is accounted for as a financial expense in the income<br />
statement. The remaining part of KSEK 15 (18 and 60, respectively) consists of<br />
interest charges on banking accounts and financial leasing (see also note 20).<br />
Also for the Parent Company KSEK 3 (1,370) is an upfront payment of the ECF<br />
agreement while the remaining amount of KSEK 4 is interest charges on bank<br />
accounts. For 2012, the amount refers to interest charges on bank accounts.<br />
NOTE 9 TAXES<br />
Since <strong>Karo</strong> <strong>Bio</strong> is reporting losses for income taxation it is currently not paying<br />
any income taxes. <strong>Karo</strong> <strong>Bio</strong> has not recognized any deferred tax assets in<br />
relation to the unutilized tax losses carried forward as there is no convincing<br />
evidence, according to the definition in IAS 12, that sufficient future taxable<br />
profits will be available.<br />
At year-end, the Parent Company’s unutilized tax losses carried forward amounted<br />
to MSEK 2,238 (2,136 and 1,909, respectively). There is no statutory time<br />
limit for Swedish companies to utilize tax losses.<br />
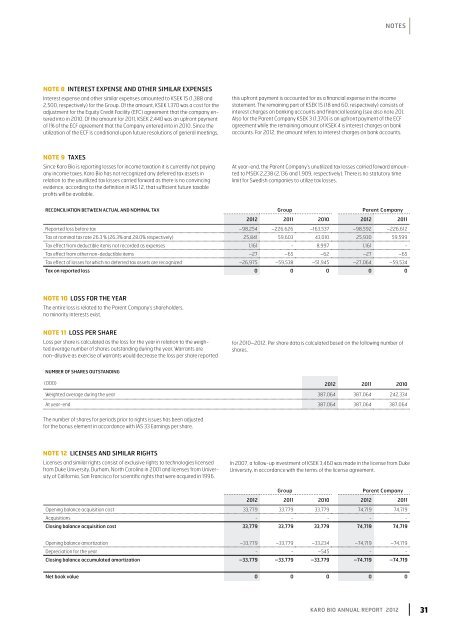
RECONCILIATION BETWEEN ACTUAL AND NOMINAL TAX Group Parent Company<br />
2012 2011 2010 2012 2011<br />
<strong>Report</strong>ed loss before tax –98,254 –226,626 –163,537 –98,592 –226,612<br />
Tax at nominal tax rate 26.3 % (26.3% and 28.0% respectively) 25,841 59,603 43,010 25,930 59,599<br />
Tax effect from deductible items not recorded as expenses 1,161 - 8,997 1,161 -<br />
Tax effect from other non-deductible items –27 –65 –62 –27 –65<br />
Tax effect of losses for which no deferred tax assets are recognized –26,975 –59,538 –51,945 –27,064 –59,534<br />
Tax on reported loss 0 0 0 0 0<br />
NOTE 10 LOSS FOR THE YEAR<br />
The entire loss is related to the Parent Company’s shareholders,<br />
no minority interests exist.<br />
NOTE 11 LOSS PER SHARE<br />
Loss per share is calculated as the loss for the year in relation to the weighted<br />
average number of shares outstanding during the year. Warrants are<br />
non-dilutive as exercise of warrants would decrease the loss per share reported<br />
for 2010–2012. Per share data is calculated based on the following number of<br />
shares.<br />
NUMBER OF SHARES OUTSTANDING<br />
(000) 2012 2011 2010<br />
Weighted average during the year 387,064 387,064 242,334<br />
At year-end 387,064 387,064 387,064<br />
The number of shares for periods prior to rights issues has been adjusted<br />
for the bonus element in accordance with IAS 33 Earnings per share.<br />
NOTe 12 LICENSES AND SIMILAR RIGHTS<br />
Licenses and similar rights consist of exclusive rights to technologies licensed<br />
from Duke University, Durham, North Carolina in 2001 and licenses from University<br />
of California, San Francisco for scientific rights that were acquired in 1996.<br />
In 2007, a follow-up investment of KSEK 3,460 was made in the license from Duke<br />
University, in accordance with the terms of the license agreement.<br />
Group Parent Company<br />
2012 2011 2010 2012 2011<br />
Opening balance acquisition cost 33,779 33,779 33,779 74,719 74,719<br />
Acquisitions - - - - -<br />
Closing balance acquisition cost 33,779 33,779 33,779 74,719 74,719<br />
Opening balance amortization –33,779 –33,779 –33,234 –74,719 –74,719<br />
Depreciation for the year - - –545 - -<br />
Closing balance accumulated amortization –33,779 –33,779 –33,779 –74,719 –74,719<br />
Net book value 0 0 0 0 0<br />
KARO BIO <strong>Annual</strong> <strong>Report</strong> 2012 31