NITRIFICATION AND ACTIVATED SLUDGE FOAMING ...
NITRIFICATION AND ACTIVATED SLUDGE FOAMING ...
NITRIFICATION AND ACTIVATED SLUDGE FOAMING ...

Create successful ePaper yourself
Turn your PDF publications into a flip-book with our unique Google optimized e-Paper software.
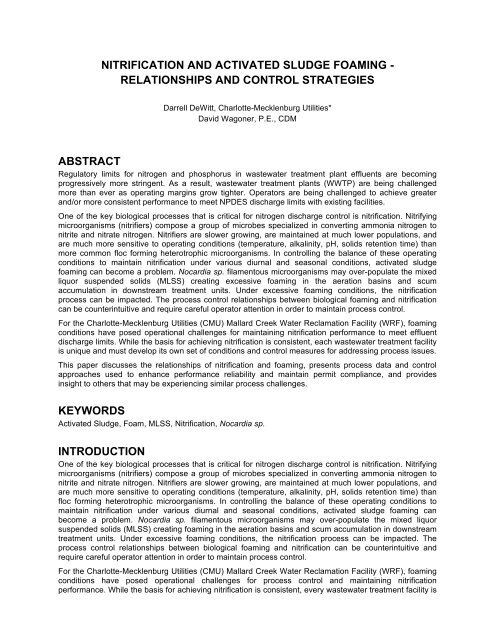
<strong>NITRIFICATION</strong> <strong>AND</strong> <strong>ACTIVATED</strong> <strong>SLUDGE</strong> <strong>FOAMING</strong> -<br />
RELATIONSHIPS <strong>AND</strong> CONTROL STRATEGIES<br />
Darrell DeWitt, Charlotte-Mecklenburg Utilities*<br />
David Wagoner, P.E., CDM<br />
ABSTRACT<br />
Regulatory limits for nitrogen and phosphorus in wastewater treatment plant effluents are becoming<br />
progressively more stringent. As a result, wastewater treatment plants (WWTP) are being challenged<br />
more than ever as operating margins grow tighter. Operators are being challenged to achieve greater<br />
and/or more consistent performance to meet NPDES discharge limits with existing facilities.<br />
One of the key biological processes that is critical for nitrogen discharge control is nitrification. Nitrifying<br />
microorganisms (nitrifiers) compose a group of microbes specialized in converting ammonia nitrogen to<br />
nitrite and nitrate nitrogen. Nitrifiers are slower growing, are maintained at much lower populations, and<br />
are much more sensitive to operating conditions (temperature, alkalinity, pH, solids retention time) than<br />
more common floc forming heterotrophic microorganisms. In controlling the balance of these operating<br />
conditions to maintain nitrification under various diurnal and seasonal conditions, activated sludge<br />
foaming can become a problem. Nocardia sp. filamentous microorganisms may over-populate the mixed<br />
liquor suspended solids (MLSS) creating excessive foaming in the aeration basins and scum<br />
accumulation in downstream treatment units. Under excessive foaming conditions, the nitrification<br />
process can be impacted. The process control relationships between biological foaming and nitrification<br />
can be counterintuitive and require careful operator attention in order to maintain process control.<br />
For the Charlotte-Mecklenburg Utilities (CMU) Mallard Creek Water Reclamation Facility (WRF), foaming<br />
conditions have posed operational challenges for maintaining nitrification performance to meet effluent<br />
discharge limits. While the basis for achieving nitrification is consistent, each wastewater treatment facility<br />
is unique and must develop its own set of conditions and control measures for addressing process issues.<br />
This paper discusses the relationships of nitrification and foaming, presents process data and control<br />
approaches used to enhance performance reliability and maintain permit compliance, and provides<br />
insight to others that may be experiencing similar process challenges.<br />
KEYWORDS<br />
Activated Sludge, Foam, MLSS, Nitrification, Nocardia sp.<br />
INTRODUCTION<br />
One of the key biological processes that is critical for nitrogen discharge control is nitrification. Nitrifying<br />
microorganisms (nitrifiers) compose a group of microbes specialized in converting ammonia nitrogen to<br />
nitrite and nitrate nitrogen. Nitrifiers are slower growing, are maintained at much lower populations, and<br />
are much more sensitive to operating conditions (temperature, alkalinity, pH, solids retention time) than<br />
floc forming heterotrophic microorganisms. In controlling the balance of these operating conditions to<br />
maintain nitrification under various diurnal and seasonal conditions, activated sludge foaming can<br />
become a problem. Nocardia sp. filamentous microorganisms may over-populate the mixed liquor<br />
suspended solids (MLSS) creating foaming in the aeration basins and scum accumulation in downstream<br />
treatment units. Under excessive foaming conditions, the nitrification process can be impacted. The<br />
process control relationships between biological foaming and nitrification can be counterintuitive and<br />
require careful operator attention in order to maintain process control.<br />
For the Charlotte-Mecklenburg Utilities (CMU) Mallard Creek Water Reclamation Facility (WRF), foaming<br />
conditions have posed operational challenges for process control and maintaining nitrification<br />
performance. While the basis for achieving nitrification is consistent, every wastewater treatment facility is
unique and must develop its own set of conditions and control measures for addressing relative process<br />
issues. The work effort described and the resulting information presented in this paper is part of a<br />
program to promote continuous improvement at the WRF - a key initiative throughout CMU.<br />
The WRF treatment system includes flow equalization, primary clarifiers, Modified Ludzack-Ettinger<br />
(MLE) activated sludge system, tertiary sand filters, and anaerobic digesters. Historically, the WRF has<br />
had issues with foaming conditions which caused issues in the aeration basins and in downstream unit<br />
processes - conveyance foaming, secondary clarifier excessive scum, excessive blinding of final filters,<br />
and impacts to water reuse program. Figures 1 and 2 present typical nocardial foam and scum<br />
conditions.<br />
Figure 1 – Nocardial foam on aeration basin surface<br />
Figure 2 – Nocardial scum on secondary clarifier surface<br />
Compliance with ammonia nitrogen limits is challenged at times by periodic ammonia pass-through of the<br />
aeration basins particularly during winter operating conditions.<br />
This paper discusses the relationships of nitrification and foaming, presents the results of process data<br />
evaluations, presents control approaches used to control foaming and to enhance nitrification reliability<br />
and overall plant operations, and provides insight to others that may be experiencing similar process<br />
challenges.
METHODOLOGY<br />
An integrated, hands-on operations approach was used to evaluate the issues of foaming and nitrification<br />
performance at the WRF. The steps included:<br />
• Defining the situation at the facility with regard to foaming and nitrification issues<br />
• Understanding background information - assimilating process data and information resources<br />
• Assessing the information, and<br />
• Developing recommendations to address the issues<br />
Background data used for the evaluation were historical operations and process data from operator<br />
sampling, and archived and real-time data from SCADA via on-line analyzers. Key on-line monitoring<br />
includes ammonia, pH and dissolved oxygen (DO). As the evaluation program progressed, additional online<br />
analyzers for ammonia (primary effluent and aeration basins) and TSS (aeration basins and<br />
secondary effluent) were installed for process/performance monitoring and data trending. To fully<br />
understand the components of the foam to help establish the root causes, microscopic analyses of MLSS<br />
and foam were conducted.<br />
The initial review of historical data from periods of ammonia pass-through of the aeration basins was<br />
somewhat puzzling as no critical process factors seemed to be askew – DO, MLSS/MCRT, alkalinity, and<br />
temperature all appeared to be in good range for providing complete nitrification based on the flows and<br />
loading conditions to the WRF. Short circuiting through the aeration basins was not a factor. From this<br />
review, sample collection points were examined and additional MLSS sampling points along with<br />
additional auto samplers for TSS (MLSS) were implemented to help with understanding the MLSS<br />
concentration and profiles in the aeration basins and in aeration basin effluent. Grab samples from the<br />
aeration basin were collected and analyzed for ammonia nitrogen to develop a nitrification profile along<br />
the length of the aeration basins. From this work, additional ammonia on-line analyzers were installed to<br />
track ammonia levels in the influent to and through the aeration basins, see Figure 3.<br />
Figure 3 – On-line ammonia analyzer for secondary influent monitoring<br />
RESULTS<br />
The microscopic analyses of the MLSS and associated foam identified Nocardia sp. bacteria as the<br />
agents promoting the foaming conditions. Figure 4 presents an example micrograph of Nocardia sp.<br />
bacteria. Nocardial filaments cause foaming due to their hydrophobic nature. Their growth is promoted by<br />
several conditions generally in combination including elevated mean cell residence time (MCRT), higher<br />
levels of fats/oils/grease/fatty acids in the wastestream, acidic range pH levels, and foam trapping
conditions. Excessive nocardial growth creates a persistent foam and scum conditions in treatment units<br />
which can overcome the handling capacity for treatment systems. Foam on the aeration basins contains<br />
the same organisms as in the MLSS except in more concentrated form. Activated sludge bacteria residing<br />
in the foam are removed from the active mixture and not as available as those bacteria within the<br />
liquid/mixed MLSS for stabilization of the wastewater constituents including ammonia nitrogen.<br />
Figure 4 – Nocardial filaments<br />
Evaluation of MLSS data initially from grab samples and later from online analyzers indicated that there<br />
was significant variability in MLSS concentrations across the length aeration basins, the severity of which<br />
was dependent upon the severity of foaming conditions. The MLSS profile data indicated a progressive<br />
decline in the liquid concentration of solids in the MLSS in the aeration basins (samples collected from the<br />
liquid beneath the foam layer). This liquid MLSS concentration was given the term “effective MLSS” as it<br />
represents the MLSS that is most actively engaged in the aeration basin mixture. The term “total MLSS”<br />
was given to the mixture of liquid and foam. Samples of this mixture was historically collected<br />
downstream of the aeration basins and used for process control decisions. Figure 5 presents an example<br />
of a trend of the change in Total and Effective MLSS as foaming conditions increase.<br />
Figure 5 – Total Vs Effective MLSS Trend with Increasing Foaming<br />
The ammonia nitrogen data from the aeration basin profiles indicated that incomplete nitrification is linked<br />
to elevated foaming conditions causing lower effective MLSS concentrations.
DISCUSSION<br />
Nocardia sp. is a type of branched filamentous bacteria that is part of the population of microorganisms in<br />
a healthy activated sludge system. However, excessive/disproportionate nocardial levels will lead to<br />
increasing levels of foaming and scum production. To help minimize foaming in systems that are prone to<br />
Nocardia, aeration systems should be carefully controlled so over-aeration does not occur. Excessive<br />
aeration creates excessive foaming in elevated Nocardia conditions. The WRF has installed automated<br />
DO control systems that help to minimize excessive aeration conditions. Key food sources for Nocardia<br />
are fats/oils/grease and fatty acids. Limiting these foods will help to control nocardial populations.<br />
Maintaining a near neutral pH in the aeration system is also a benefit to help control Nocardia and to<br />
support nitrification performance. MCRT perhaps is the most important process parameter for Nocardia<br />
control and for nitrification performance. Generally, nitrifiers require an older sludge or higher MCRT.<br />
However, higher MCRT levels will promote Nocardia growth. Herein rests the critical balance -<br />
maintaining high enough MCRT to support nitrification performance and low enough MCRT to minimize<br />
Nocardia growth.<br />
For the WRF, the MCRT operating range to control this balance is very narrow and presents a challenge<br />
to maintain adequate MCRT to achieve complete nitrification while controlling foaming. Historically,<br />
winter operations have presented the greatest challenge. During winter operations when nitrification rates<br />
decrease due to lower aeration basin temperatures, to maintain adequate nitrification performance, the<br />
MCRT generally needs to be raised in the effort to increase the population of nitrifiers in the MLSS. In<br />
this effort, WAS is systematically reduced to raise the MLSS (increases MCRT). However, in systems<br />
prone to nocardial foaming this increase in MCRT can lead to negative results. The increasing MCRT<br />
promotes Nocardia, increases foaming, decreases effective MLSS, and decreases active nitrifiers<br />
resulting in diminished nitrification performance. When nitrification performance starts to decrease, the<br />
normal impulse is to preserve/build nitrifiers by reducing wasting. However, this creates more selective<br />
forces for increasing Nocardia which creates further detrimental conditions for nitrification. Figure 6<br />
presents a chronological plot showing the impact of decreasing wasting, increasing foaming, drop in<br />
effective MLSS, and decrease in nitrification performance.<br />
Figure 6 – Chronological Plot of Effective and Total MLSS, and Nitrification with Decreasing WAS<br />
Additionally, even as temperatures increased during this period, nitrification performance did not improve.<br />
Given the understanding of these relationships, the WRF instituted careful controls for MCRT, aeration<br />
intensity, and alkalinity/pH to minimize Nocardia foam and scum in order to maintain more consistent
nitrification performance. The WRF performance has become more consistent and with experience, the<br />
plant staff has become keenly aware of how quickly the system can react to changes in WAS to promote<br />
foam and scum increases.<br />
Given this sensitivity which has been seen to be more pronounced in winter operations, additional means<br />
to help reduce ammonia nitrogen pass-through during periods of higher foaming conditions were<br />
investigated. Data from the on-line ammonia analyzer monitoring secondary influent provided information<br />
that ammonia nitrogen concentrations in the influent after flow equalization varied significantly during a 24<br />
hour period. Historically, the WRF has operated on the basis of equalized diurnal flow. This system is<br />
automated through SCADA programming for control of flow equalization basins and pumping systems.<br />
With the ammonia nitrogen concentration variability, a constant flow approach created a wide range of<br />
actual ammonia nitrogen loading to the activated sludge system. Using the SCADA system, online<br />
ammonia analyzer, and existing equalization system capabilities, an ammonia nitrogen load control<br />
system was developed. Figure 7 provides a screen shot of the nitrogen load control “switch” which is now<br />
used to target the ammonia load to the activated sludge system.<br />
Figure 7 – SCADA load control screen shot<br />
The ammonia loading control switch is located near the center of screen. As shown, the targeted<br />
ammonia loading rate is 2,600 lb/day. The switch window also includes the actual current loading value.<br />
Implementation of this control system to enable more equalized ammonia nitrogen loading provided<br />
immediate positive impact to the WRF including:<br />
• Reduced MCRT required to achieve nitrification (no need to maintain higher MCRT for the higher<br />
loading periods)<br />
• Reduced/eliminated nocardial foaming and scum – minimal Effective and Total MLSS differential<br />
• Stable aeration system demands - more consistent loading creates aeration supply consistency<br />
and lower peak power requirements; lower aeration intensity – lower foaming tendencies<br />
• Stable alkalinity demands<br />
• Stable anoxic selector operation
• Reduced scum on secondary clarifiers and improved clarifier performance<br />
• Improved final filter performance and reduced backwashing<br />
Figure 8 and 9 present SCADA screen shots of typical conditions before and after the ammonia nitrogen<br />
load control program was implemented.<br />
Figure 8 – Typical flows and load conditions prior to ammonia nitrogen load control<br />
Flow to aeration<br />
Ammonia load<br />
Chart presents the conditions of variable ammonia load with near constant flow. Ammonia loading rate<br />
range under these equalized flow conditions was 1,900 – 4,100 lb/day.<br />
Figure 9 – Typical flows and load conditions after ammonia nitrogen load control<br />
Flow to aeration<br />
Ammonia load
This chart presents an example of targeted consistent ammonia load by variable control of flow rates<br />
relative to varying ammonia nitrogen concentrations. The ammonia loading rate under these conditions<br />
was 1,300 – 2,740 lb/day. Note that the minimum ammonia load value is affected by a dip in flow that<br />
occurs when the flow EQ basins reach minimum low level.<br />
CONCLUSIONS<br />
To date, the WRF evaluation to control foaming and enhance nitrification stability has provided good<br />
insight into the relationships between the variables that are involved in maintaining a balance in the<br />
microbiological community in the WRF. Each wastewater treatment plant is unique and the responses to<br />
process control approaches and adjustments need to be tuned to the specific conditions for each facility.<br />
For this effort, key process data is necessary. On-line analyzers tied into SCADA provide an advantage to<br />
the operations team to make informed process control decisions and to see the responses of the system<br />
to these calculated adjustments.<br />
While great improvements have been realized in the performance of the WRF through this evaluation and<br />
progressive implementation of operational changes and control equipment, the WRF continues to adjust<br />
the operation to optimize conditions. The approaching winter season will provide the first opportunity to<br />
operate using the equalized ammonia nitrogen loading control system. The WRF staff awaits the<br />
challenge of these conditions with greater understanding, more tools and higher confidence that improved<br />
control of Nocardia foam and scum, and more consistent nitrification performance will be achieved.