69-72 - Polskie Stowarzyszenie BiomateriaÅów
69-72 - Polskie Stowarzyszenie BiomateriaÅów
69-72 - Polskie Stowarzyszenie BiomateriaÅów

Create successful ePaper yourself
Turn your PDF publications into a flip-book with our unique Google optimized e-Paper software.
24 jonów występuje w<br />
przypadku kompozytu<br />
C z dodatkiem<br />
fluorku strontu i nanokrzemionki.<br />
Jednak<br />
w tym przypadku<br />
widoczny jest ciągły<br />
wzrost emisji jonów<br />
fluoru do roztworu<br />
kontaktowego. Może<br />
to wynikać z mniejszej<br />
sumarycznej<br />
zawartości fluoru<br />
w strukturze kompozytu.<br />
Dodatkowo<br />
nanokrzemionka,<br />
jako wypełniacz o<br />
małych rozmiarach<br />
ziaren (średnica -<br />
ok.10nm) zajmuje<br />
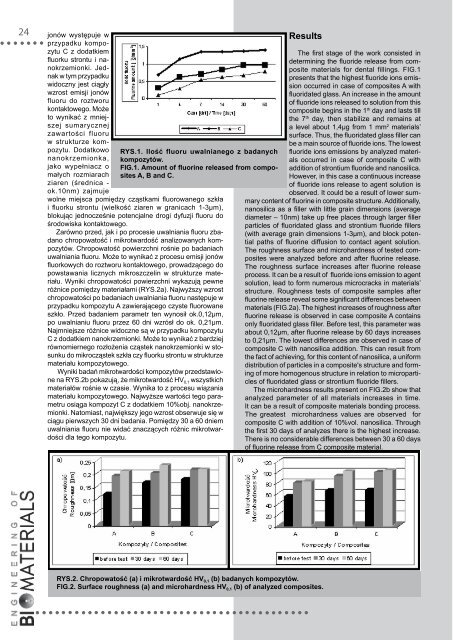
RYS.1. Ilość fluoru uwalnianego z badanych<br />
kompozytów.<br />
FIG.1. Amount of fluorine released from composites<br />
A, B and C.<br />
wolne miejsca pomiędzy cząstkami fluorowanego szkła<br />
i fluorku strontu (wielkość ziaren w granicach 1-3µm),<br />
blokując jednocześnie potencjalne drogi dyfuzji fluoru do<br />
środowiska kontaktowego.<br />
Zarówno przed, jak i po procesie uwalniania fluoru zbadano<br />
chropowatość i mikrotwardość analizowanych kompozytów.<br />
Chropowatość powierzchni rośnie po badaniach<br />
uwalniania fluoru. Może to wynikać z procesu emisji jonów<br />
fluorkowych do roztworu kontaktowego, prowadzącego do<br />
powstawania licznych mikroszczelin w strukturze materiału.<br />
Wyniki chropowatości powierzchni wykazują pewne<br />
różnice pomiędzy materiałami (Rys.2a). Najwyższy wzrost<br />
chropowatości po badaniach uwalniania fluoru następuje w<br />
przypadku kompozytu A zawierającego czyste fluorowane<br />
szkło. Przed badaniem parametr ten wynosił ok.0,12µm,<br />
po uwalnianiu fluoru przez 60 dni wzrósł do ok. 0,21µm.<br />
Najmniejsze różnice widoczne są w przypadku kompozytu<br />
C z dodatkiem nanokrzemionki. Może to wynikać z bardziej<br />
równomiernego rozłożenia cząstek nanokrzemionki w stosunku<br />
do mikrocząstek szkła czy fluorku strontu w strukturze<br />
materiału kompozytowego.<br />
Wyniki badań mikrotwardości kompozytów przedstawione<br />
na Rys.2b pokazują, że mikrotwardość HV 0,1 wszystkich<br />
materiałów rośnie w czasie. Wynika to z procesu wiązania<br />
materiału kompozytowego. Najwyższe wartości tego parametru<br />
osiąga kompozyt C z dodatkiem 10%obj. nanokrzemionki.<br />
Natomiast, największy jego wzrost obserwuje się w<br />
ciągu pierwszych 30 dni badania. Pomiędzy 30 a 60 dniem<br />
uwalniania fluoru nie widać znaczących różnic mikrotwardości<br />
dla tego kompozytu.<br />
Results<br />
The first stage of the work consisted in<br />
determining the fluoride release from composite<br />
materials for dental fillings. FIG.1<br />
presents that the highest fluoride ions emission<br />
occurred in case of composites A with<br />
fluoridated glass. An increase in the amount<br />
of fluoride ions released to solution from this<br />
composite begins in the 1 th day and lasts till<br />
the 7 th day, then stabilize and remains at<br />
a level about 1,4µg from 1 mm 2 materials’<br />
surface. Thus, the fluoridated glass filler can<br />
be a main source of fluoride ions. The lowest<br />
fluoride ions emissions by analyzed materials<br />
occurred in case of composite C with<br />
addition of strontium fluoride and nanosilica.<br />
However, in this case a continuous increase<br />
of fluoride ions release to agent solution is<br />
observed. It could be a result of lower summary<br />
content of fluorine in composite structure. Additionally,<br />
nanosilica as a filler with little grain dimensions (average<br />
diameter – 10nm) take up free places through larger filler<br />
particles of fluoridated glass and strontium fluoride fillers<br />
(with average grain dimensions 1-3µm), and block potential<br />
paths of fluorine diffusion to contact agent solution.<br />
The roughness surface and microhardness of tested composites<br />
were analyzed before and after fluorine release.<br />
The roughness surface increases after fluorine release<br />
process. It can be a result of fluoride ions emission to agent<br />
solution, lead to form numerous microcracks in materials’<br />
structure. Roughness tests of composite samples after<br />
fluorine release reveal some significant differences between<br />
materials (Fig.2a). The highest increases of roughness after<br />
fluorine release is observed in case composite A contains<br />
only fluoridated glass filler. Before test, this parameter was<br />
about 0,12µm, after fluorine release by 60 days increases<br />
to 0,21µm. The lowest differences are observed in case of<br />
composite C with nanosilica addition. This can result from<br />
the fact of achieving, for this content of nanosilica, a uniform<br />
distribution of particles in a composite's structure and forming<br />
of more homogenous structure in relation to microparticles<br />
of fluoridated glass or strontium fluoride fillers.<br />
The microhardness results present on Fig.2b show that<br />
analyzed parameter of all materials increases in time.<br />
It can be a result of composite materials bonding process.<br />
The greatest microhardness values are observed for<br />
composite C with addition of 10%vol. nanosilica. Through<br />
the first 30 days of analyzes there is the highest increase.<br />
There is no considerable differences between 30 a 60 days<br />
of fluorine release from C composite material.<br />
RYS.2. Chropowatość (a) i mikrotwardość HV 0,1 (b) badanych kompozytów.<br />
FIG.2. Surface roughness (a) and microhardness HV 0,1 (b) of analyzed composites.