69-72 - Polskie Stowarzyszenie BiomateriaÅów
69-72 - Polskie Stowarzyszenie BiomateriaÅów
69-72 - Polskie Stowarzyszenie BiomateriaÅów

Create successful ePaper yourself
Turn your PDF publications into a flip-book with our unique Google optimized e-Paper software.
28<br />
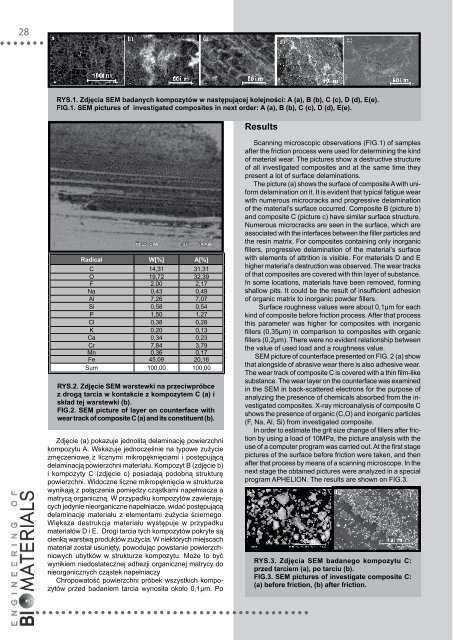
RYS.1. Zdjęcia SEM badanych kompozytów w następującej kolejności: A (a), B (b), C (c), D (d), E(e).<br />
FIG.1. SEM pictures of investigated composites in next order: A (a), B (b), C (c), D (d), E(e).<br />
Results<br />
Radical W[%] A[%]<br />
C 14,31 31,31<br />
O 19,<strong>72</strong> 32,39<br />
F 2,00 2,17<br />
Na 0,43 0,49<br />
Al 7,26 7,07<br />
Si 0,58 0,54<br />
P 1,50 1,27<br />
Cl 0,38 0,28<br />
K 0,20 0,13<br />
Ca 0,34 0,23<br />
Cr 7,84 3,79<br />
Mn 0,36 0,17<br />
Fe 45,09 20,16<br />
Sum 100,00 100,00<br />
RYS.2. Zdjęcie SEM warstewki na przeciwpróbce<br />
z drogą tarcia w kontakcie z kompozytem C (a) i<br />
skład tej warstewki (b).<br />
FIG.2. SEM picture of layer on counterface with<br />
wear track of composite C (a) and its constituent (b).<br />
Zdjęcie (a) pokazuje jednolitą delaminację powierzchni<br />
kompozytu A. Wskazuje jednocześnie na typowe zużycie<br />
zmęczeniowe z licznymi mikropęknięciami i postępującą<br />
delaminacją powierzchni materiału. Kompozyt B (zdjęcie b)<br />
i kompozyty C (zdjęcie c) posiadają podobną strukturę<br />
powierzchni. Widoczne liczne mikropęknięcia w strukturze<br />
wynikają z połączenia pomiędzy cząstkami napełniacza a<br />
matrycą organiczną. W przypadku kompozytów zawierających<br />
jedynie nieorganiczne napełniacze, widać postępującą<br />
delaminację materiału z elementami zużycia ściernego.<br />
Większa destrukcja materiału występuje w przypadku<br />
materiałów D i E. Drogi tarcia tych kompozytów pokryte są<br />
cienką warstwą produktów zużycia. W niektórych miejscach<br />
materiał został usunięty, powodując powstanie powierzchniowych<br />
ubytków w strukturze kompozytu. Może to być<br />
wynikiem niedostatecznej adhezji organicznej matrycy do<br />
nieorganicznych cząstek napełniaczy<br />
Chropowatość powierzchni próbek wszystkich kompozytów<br />
przed badaniem tarcia wynosiła około 0,1µm. Po<br />
Scanning microscopic observations (Fig.1) of samples<br />
after the friction process were used for determining the kind<br />
of material wear. The pictures show a destructive structure<br />
of all investigated composites and at the same time they<br />
present a lot of surface delaminations.<br />
The picture (a) shows the surface of composite A with uniform<br />
delamination on it. It is evident that typical fatigue wear<br />
with numerous microcracks and progressive delamination<br />
of the material’s surface occurred. Composite B (picture b)<br />
and composite C (picture c) have similar surface structure.<br />
Numerous microcracks are seen in the surface, which are<br />
associated with the interfaces between the filler particles and<br />
the resin matrix. For composites containing only inorganic<br />
fillers, progressive delamination of the material’s surface<br />
with elements of attrition is visible. For materials D and E<br />
higher material’s destruction was observed. The wear tracks<br />
of that composites are covered with thin layer of substance.<br />
In some locations, materials have been removed, forming<br />
shallow pits. It could be the result of insufficient adhesion<br />
of organic matrix to inorganic powder fillers.<br />
Surface roughness values were about 0,1µm for each<br />
kind of composite before friction process. After that process<br />
this parameter was higher for composites with inorganic<br />
fillers (0,35μm) in comparison to composites with organic<br />
fillers (0,2μm). There were no evident relationship between<br />
the value of used load and a roughness value.<br />
SEM picture of counterface presented on FIG. 2 (a) show<br />
that alongside of abrasive wear there is also adhesive wear.<br />
The wear track of composite C is covered with a thin film-like<br />
substance. The wear layer on the counterface was examined<br />
in the SEM in back-scattered electrons for the purpose of<br />
analyzing the presence of chemicals absorbed from the investigated<br />
composites. X-ray microanalysis of composite C<br />
shows the presence of organic (C,O) and inorganic particles<br />
(F, Na, Al, Si) from investigated composite.<br />
In order to estimate the grit size change of fillers after friction<br />
by using a load of 10MPa, the picture analysis with the<br />
use of a computer program was carried out. At the first stage<br />
pictures of the surface before friction were taken, and then<br />
after that process by means of a scanning microscope. In the<br />
next stage the obtained pictures were analyzed in a special<br />
program APHELION. The results are shown on Fig.3.<br />
RYS.3. Zdjęcia SEM badanego kompozytu C:<br />
przed tarciem (a), po tarciu (b).<br />
FIG.3. SEM pictures of investigate composite C:<br />
(a) before friction, (b) after friction.