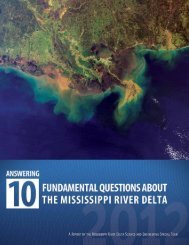
Land Area Change in Coastal Louisiana (1932 to 2010) D. Phil ...
Land Area Change in Coastal Louisiana (1932 to 2010) D. Phil ...
Land Area Change in Coastal Louisiana (1932 to 2010) D. Phil ...

Create successful ePaper yourself
Turn your PDF publications into a flip-book with our unique Google optimized e-Paper software.
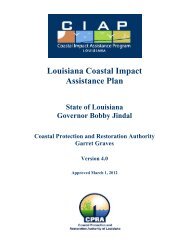
<strong>Land</strong> <strong>Area</strong> <strong>Change</strong> <strong>in</strong> <strong>Coastal</strong> <strong>Louisiana</strong><br />
(<strong>1932</strong> <strong>to</strong> <strong>2010</strong>)<br />
D. <strong>Phil</strong> Turnipseed, P.E., D.WRE<br />
Direc<strong>to</strong>r<br />
USGS National Wetlands Research Center<br />
U.S. Geological Survey<br />
U.S. Department of the Interior<br />
Pho<strong>to</strong> by: Brady Couvillion
<strong>Louisiana</strong> coastal wetlands are<br />
Critical because they support:<br />
•20-25% of domestic seafood<br />
production <strong>in</strong> the contiguous U.S.<br />
•production and transportation of about<br />
30% of U.S. oil and gas<br />
•20% of U.S. waterborne commerce<br />
•more than 5 million migra<strong>to</strong>ry birds<br />
that w<strong>in</strong>ter <strong>in</strong> <strong>Louisiana</strong>
<strong>Land</strong> <strong>Area</strong> <strong>Change</strong> <strong>in</strong> <strong>Coastal</strong><br />
<strong>Louisiana</strong>
Can be downloaded for free<br />
at the USGS publications<br />
warehouse at:<br />
http://pubs.usgs.gov/sim/3164/
1,883<br />
square mile<br />
decrease
<strong>Land</strong> <strong>Area</strong> <strong>Change</strong> <strong>in</strong> <strong>Coastal</strong><br />
<strong>Louisiana</strong><br />
• Analyses show that coastal<br />
<strong>Louisiana</strong> has experienced an<br />
approximate net loss of 1,883<br />
mi 2 from <strong>1932</strong>-<strong>2010</strong>.<br />
• This amounts <strong>to</strong> 91 times the<br />
land area of the island of<br />
Manhattan, lost over a 78 year<br />
period.<br />
• If this loss were <strong>to</strong> occur at a<br />
constant rate, it would equate<br />
<strong>to</strong> los<strong>in</strong>g a land area greater<br />
than the island of Manhattan<br />
every year.
<strong>Land</strong> <strong>Area</strong> <strong>Change</strong> <strong>in</strong> <strong>Coastal</strong><br />
<strong>Louisiana</strong><br />
• Trend analysis from 1985-<br />
<strong>2010</strong> show a wetland loss<br />
rate of 16.57 square miles<br />
per year.<br />
• This equates <strong>to</strong> <strong>Louisiana</strong><br />
los<strong>in</strong>g more than a<br />
football field every hour<br />
(on average).
<strong>Land</strong> <strong>Change</strong> by Period
Recent Trends
Shorel<strong>in</strong>e Erosion
Shorel<strong>in</strong>e Erosion
Barrier Island<br />
Transgression
Barrier Island<br />
Transgression
Hurricanes
Hurricane Impacts
Delta Build<strong>in</strong>g
Delta Build<strong>in</strong>g<br />
Wax Lake Outlet and<br />
Atchafalaya Delta
Sea Level Rise
Sea Level Rise
Subsidence
Subsidence
Subsidence
Levees, Dams, Flood<br />
Control Structures, and<br />
Sediment
May 27 th , 2011
Oil and Gas Extraction and<br />
Infrastructure
Navigation Infrastructure
Pho<strong>to</strong> by: Greg Steyer
Moni<strong>to</strong>r<strong>in</strong>g and Research
http://www.lacoast.gov/crms
CRMS Website<br />
http://www.lacoast.gov/crms
CRMS Website
CRMS Website
- Wetlands<br />
Data Collection at each Site<br />
Parameter Method Scale Frequency<br />
<strong>Land</strong> <strong>to</strong> Water<br />
Ratio Satellite Imagery Hydrologic Bas<strong>in</strong> 3 years<br />
<strong>Land</strong> <strong>to</strong> Water<br />
Ratio Digital Aerial Pho<strong>to</strong>graphy CRMS Site (1 Km 2 ) 3 years<br />
Emergent<br />
Vegetation<br />
Forested<br />
Vegetation<br />
Vertical Accretion<br />
Marsh Elevation<br />
<strong>Change</strong><br />
Porewater Sal<strong>in</strong>ity<br />
Surface Water<br />
Braun Blanquet: % Cover,<br />
Species Richness, Height of<br />
Dom<strong>in</strong>ant Species<br />
DBH and Canopy Cover<br />
(10) 2m x 2m<br />
plots/CRMS Site<br />
(3) 20m x 20m<br />
plots/CRMS Site<br />
Annually<br />
dur<strong>in</strong>g peak<br />
biomass<br />
Annually<br />
dur<strong>in</strong>g peak<br />
biomass<br />
Feldspar Plots/Cryogenic<br />
Cores 3 plots/CRMS Site Bi-annually<br />
Rod Surface Elevation Table<br />
(RSET)<br />
10 and 30 cm deep wells<br />
Syr<strong>in</strong>ge/Sipper<br />
4 directions/CRMS<br />
Site<br />
3 wells per<br />
depth/CRMS Site and<br />
at Vegetation Plots<br />
<strong>in</strong> available water<br />
Bi-annually<br />
Monthly<br />
Annually
CRMS Website
Multiple Impacts<br />
Birds Foot Delta
http://nwrc.usgs.gov/