Largemouth Bass Habitat Suitability Index Technical Report
Largemouth Bass Habitat Suitability Index Technical Report
Largemouth Bass Habitat Suitability Index Technical Report

Create successful ePaper yourself
Turn your PDF publications into a flip-book with our unique Google optimized e-Paper software.
APPENDIX D‐9 LARGEMOUTH BASS HABITAT SUITABILITY INDEX TECHNICAL REPORTModel Name: <strong>Largemouth</strong> <strong>Bass</strong> <strong>Habitat</strong> <strong>Suitability</strong> <strong>Index</strong>Functional Area: Ecosystem Service / Upper Trophic LevelModel Proponents: Coastal Protection and Restoration AuthorityModel Developer(s): Michael D. Kaller, Louisiana State University AgCenterLouisiana’s Comprehensive Master Plan for a Sustainable Coast
APPENDIX D‐9 LARGEMOUTH BASS HABITAT SUITABILITY INDEX TECHNICAL REPORTTable of Contents1. Background ...................................................................................................................................... 1a. Purpose of Model ............................................................................................................................. 1b. Model Description and Depiction .................................................................................................... 1c. Contribution to Planning Effort ....................................................................................................... 2d. Description of Input Data ................................................................................................................. 2e. Description of Output Data .............................................................................................................. 3f. Statement on the capabilities and limitations of the model .......................................................... 3g. Description of model development process including documentation on testing conducted(Alpha and Beta tests) ..................................................................................................................... 32. <strong>Technical</strong> Quality ............................................................................................................................. 4a. Theory ............................................................................................................................................... 4b. Description of system being represented by the model ............................................................... 11c. Analytical requirements ................................................................................................................. 11d. Assumptions ................................................................................................................................... 12e. Identification of formulas used in the model and proof that the computations are appropriateand done correctly ........................................................................................................................ 123. System Quality............................................................................................................................... 12a. Description and rationale for selection of supporting software tool/programming language andhardware platform ........................................................................................................................ 12b. Proof that the programming was done correctly .......................................................................... 12c. Availability of software and hardware required by model .......................................................... 12d. Description of process used to test and validate model ............................................................... 13e. Discussion of the ability to import data into other software analysis tools (interoperabilityissue) .............................................................................................................................................. 134. Usability ......................................................................................................................................... 13a. Availability of input data necessary to support the model .......................................................... 13b. Formatting of output in an understandable manner .................................................................... 13c. Usefulness of results to support project analysis‐ ........................................................................ 13d. Ability to export results into project reports ................................................................................ 14e. Training availability ........................................................................................................................ 14f. Users documentation availability and whether it is user friendly and complete ........................ 14g. <strong>Technical</strong> support availability ........................................................................................................ 14h. Software/hardware platform availability to all or most users ..................................................... 14i. Accessibility of the model .............................................................................................................. 14j. Transparency of model and how it allows for easy verification of calculations and outputs ..... 14Louisiana’s Comprehensive Master Plan for a Sustainable CoastPage ii
APPENDIX D‐9 LARGEMOUTH BASS HABITAT SUITABILITY INDEX TECHNICAL REPORT5. Sources of model uncertainty ....................................................................................................... 146. Suggested model improvements .................................................................................................. 157. Quality review ............................................................................................................................... 158. Uncertainty analysis ...................................................................................................................... 159. References ..................................................................................................................................... 15Louisiana’s Comprehensive Master Plan for a Sustainable CoastPage iii
APPENDIX D‐9 LARGEMOUTH BASS HABITAT SUITABILITY INDEX TECHNICAL REPORT1. Backgrounda. Purpose of ModelWith many potential actions regarding protection and restoration projects, information on theimplications of actions or inaction to the ecosystem and economy of coastal Louisiana isnecessary. Coastal land loss threatens the ecological integrity and economic viability ofLouisiana; however, understanding the implications to the ecosystem and economy as a wholeis complex. One simpler method to understand the implications of action or inaction is todevelop a predictive model that will outline responses of desired end states to various action orinaction scenarios. Among the desired end states is a healthy and robust community of animalsthat are either of direct economic importance or represent a functional ecosystem. Within thiscommunity of organisms, largemouth bass represent an economically important organism(Southwick Associates 2008), as well as, indicate a healthy freshwater ecosystem (Meador andCarlisle 2007) as an apex predator. Therefore, the expansion or contraction of largemouth basshabitats in relation to various restoration or protection scenarios offers insights into desired endstates of ecosystem integrity and economic viability by outlining the benefits of these projectsscenarios through expanded habitat and, therefore, economic activity and ecosystem integrity.This model will assist CPRA and other water management agencies (e.g., U.S. Army Corps ofEngineers) in evaluating the effect of various protection and restoration measures on largemouth bass habitat suitability. Specifically, increases, transitions, and decreases in freshwaterwill be clearly indicated by this model. Further, this model will indicate the habitat losses frominaction.b. Model Description and DepictionThe largemouth bass (Micropterus salmoides) and Florida bass (Micropterus floridanus, formerlyM. salmoides floridanus) are among the most widely sought after sportfishes in North Americaand support many popular fisheries in Louisiana. The quality of largemouth bass fisheries, interms of both fish production and angler harvest, is affected directly and indirectly by factorsunder the control of fishery managers, such as stocking practices and management regulations,as well as less controllable factors such as system productivity, invasive species, and waterquality fluctuations. For management purposes, the two species are more often described inolder literature as sub‐species and are managed together because these species are nearlyimpossible to differentiate in field settings. Specific‐level identification requires examination ofliver proteins or microsatellites. Further, the species are known to hybridize, with manyLouisiana waterbodies supporting M. salmoides, M. floridanus, and M. salmoidesXfloridanus(Constant 1990; Fries 2010). Hereafter, both species and their hybrid will be referred to aslargemouth bass, and this HSI has been generalized to address both basses and their hybrid.Coastal Louisiana freshwaters support economically and ecologically important populations oflargemouth bass. Although often overshadowed in the minds of coastal anglers by spottedseatrout and redfish, many anglers fish Louisiana coastal freshwaters targeting largemouth bass.The expenditures of these anglers are important income in coastal communities. Further, thelargemouth bass is an important aquatic predator, often a keystone predator if alligator gar oralligators are low in number. In turn, shorebirds and other avian predators are the principalnon‐human predator of bass in these systems.Published studies of largemouth bass in Louisiana coastal freshwaters are few. In Louisiana,coastal largemouth bass salinity studies have been published by Meador and Kelso (1989, 1990).Louisiana’s Comprehensive Master Plan for a Sustainable CoastPage 1
APPENDIX D‐9 LARGEMOUTH BASS HABITAT SUITABILITY INDEX TECHNICAL REPORTAdditionally, theses by Constant (1990) and Fries (2010) provide data on distributions and fieldconditions. The Louisiana Department of Wildlife and Fisheries conducts monitoring of fishes,including largemouth bass, in selected coastal waterbodies, and some of these data contributedto the HSI. A portion of these data were withheld from model construction and were used tovalidate model predictions. To supplement the Louisiana data and construct the HSI, data fromnearby states [Alabama (Peer et al. 2006; Hayer and Irwin 2008), Florida (Moxley and Langford1982; Maciena 1996; Chick et al. 2004; Rehage and Loftus 2007; Rogers and Allen 2009), andGeorgia (Sammons et al. 2005)] and territories (Puerto Rico; Ozen and Noble 2002, 2005; Nealand Noble 2006) were included, as well as relevant laboratory and field trials (Garvey et al.2002; Buisson et al. 2008; Hoyer et al. 2008; Hazler et al. 2009; Rypel 2009). These data weresubsequently used to modify the original 22 variable largemouth bass HSI model developed byStuber (1982) replacing suitability values derived from northern field studies with more recentlaboratory or field data from climates more akin to Louisiana.The HSI was constructed by examining the reported abundance, density, or presence/absencerelationships with specific abiotic or biotic factors (e.g., temperature, chlorophyll a as a measureof phytoplankton productivity). The optimal ranges of these factors were assigned a 1.0 and lessoptimal conditions leading toward mortality were assigned decreasing values based on eitherreported mortality or substantial declines in reported abundance, density, or presence/absence.For example, Fries (2010) reported the lowest catch‐per‐unit‐effort in lakes with low chlorophylla, although all lakes produced fish. Therefore, chlorophyll a values associated with the highestcatch‐per‐unit‐effort were assigned a 1.0 and the decreasing relationship between decliningchlorophyll a with catch‐per‐unit‐effort were modeled with logit (logistic) model followingcomparison of a variety of possible linear and non‐linear relationships bounded by 0 and 1.0.The final suitability values for the relationship between chlorophyll a with largemouth bass wereestimates from this relationship. Similar relationships were constructed for each of the fivevariables included in the HSI. The final HSI was adjusted relative to the input variables followingvalidation by comparison with distributional data, described above, and input from the CoastalProtection and Restoration Authority (CPRA). In the final HSI, values of 1.0 indicate a very highprobability, near certainty, that habitat is suitable for largemouth bass in each displayed mapcell or polygon. Values below 1.0 indicate decreasing habitat suitability.c. Contribution to Planning Effort<strong>Largemouth</strong> bass are intolerant of high salinities, specifically salinities in the ranges that wouldbe expected with further coastal land loss. Therefore, expansion of largemouth bass should beindicative of freshening from river diversions or other similar restoration efforts. Additionally,because largemouth bass can tolerate low salinities (< 12 ppt), expansion of largemouth bassalso may indicate habitats in transition from river diversions or no action (i.e., continuederosion). Localized extirpations over the course of the modeling period should be inferred ashabitat loss from increased salinity and land loss.d. Description of Input DataThis model requires temperature, salinity, emergent vegetation, submerged aquatic vegetation(SAV), and chlorophyll a. Temperature, salinity, and chlorophyll a data are outputs from theEco‐Hydrology model. Emergent vegetation and submerged aquatic vegetation are outputsfrom the Vegetation model. The vegetation data also are derived from outputs of the Eco‐Hydrology model. All data are yearly averages for a cell or polygon.Louisiana’s Comprehensive Master Plan for a Sustainable CoastPage 2
APPENDIX D‐9 LARGEMOUTH BASS HABITAT SUITABILITY INDEX TECHNICAL REPORTe. Description of Output DataThis model will output a habitat suitability index from 1.0 to 0 for each 500 x 500m cell with 1.0indicating very high suitability of habitat for largemouth bass.f. Statement on the capabilities and limitations of the modelThis model is adequate for assessing habitat suitability in response to changes in salinity. As aspecies group, largemouth bass are quite temperature tolerant ranging from Mexico and PuertoRico north into Canada, although individuals may not have wide tolerance ranges. Further,largemouth bass are quite adaptable to a variety of physical habitats, as evidenced by theirsuccessful introduction in a wide variety of geomorphological habitats from Japan to Puerto Ricoand Mexico. Thus, temperature and habitat are rarely restricting stressors to largemouth bassbut may cause mortality through cumulative negative physiological impacts from unsuitablehabitat and high or low temperatures. In this model, poor habitat or extremes in temperature ascombined stressors result in low probability of habitat use, thus, mathematically representingthe physiological impacts from poor habitat and temperature. Because largemouth bass areadapted to the osmoregulatory challenges of freshwater (i.e., retaining ions in an ion‐poorsolution), these fish experience stress and eventual mortalities at high salinities. This model willpredict unsuitable habitat for bass in scenarios where salinity increases and suitable habitat inscenarios where salinities decrease, as well as, identifying poor quality habitat or temperaturesthrough low probabilities of use.The model has three serious limitations that, given the available data, are impossible to includein the model. First, these fish have strong behavioral tendencies, which result in fish that arehighly territorial, actively seeking physical structures (e.g., woody debris, docks, vegetation), andactively avoiding deep water (i.e., most bass are found in less than 3 meters). Modeling thisbehavioral aspect is not possible, given that depth data are not available and the model onlyworks on presence/absence lacking the density data necessary to determine territorialsegregation. Second, largemouth bass do not thrive in habitats with high densities of predators,such as alligator gar or alligators. Although alligator data could be available, the nature of thisrelationship is more anecdotal than quantitatively described. Lastly, largemouth bass avoid lowlevels of dissolved oxygen or suffer mortality, if avoidance is impossible. <strong>Largemouth</strong> bass maytolerate brief excursions below 1 mg/L; however, fish commonly become stressed whendissolved oxygen is consistently below 2 mg/L and will experience mortality if these conditionspersist or if dissolved oxygen plummets to near zero. These data are not available as inputs tothe model. Consequently, the model may err in prediction based on largemouth bass behavior,predatory pressures, and effects of low dissolved oxygen.g. Description of model development process including documentation on testing conducted(Alpha and Beta tests)1. CPRA identified largemouth bass for inclusion as a target species for the ecosystem servicemodeling.2. The original HSI for largemouth bass by Stuber (1982) was retrieved. Stuber’s (1982) HSIincluded 22 variables that described four primary habitat selection factors, which were food,cover, water quality, and reproduction. Food was described by a total dissolved solidsvariable. Cover was described as % area greater than 6 m deep, % bottom cover, and twowater level fluctuation variables. Water quality was described by dissolved oxygen, pH,temperature, turbidity, and two salinity variables. Reproduction was described by % areagreater than 6 m deep, temperature, salinity, substrate, and water level fluctuationLouisiana’s Comprehensive Master Plan for a Sustainable CoastPage 3
APPENDIX D‐9 LARGEMOUTH BASS HABITAT SUITABILITY INDEX TECHNICAL REPORTvariables. Each variable had a reported non‐linear relationship with a suitability index basedon literature reports or observational knowledge. Not all 22 variables were available fromEco‐Hydrology, Wetland Morphology, or Vegetation models for this modeling effort.Therefore, the author conducted a search of the published literature, theses anddissertation, and agency reports and documents for updated information on largemouthbass relationships with habitat and water quality variables and distributional data,specifically targeting variables, such as temperature and salinity, that would be availablefrom the outputs of the other modules3. These data were used to update the variable‐suitability index relationships reported byStuber (1982) based on reported values in the literature, theses and dissertations, andagency reports. Additional variables, such as chlorophyll a (as a measure of primaryproduction), were added based on more recent Louisiana State University graduate studentresearch (Fries 2010) and studies in other states (e.g., Peer et al. 2006). Some recent fishmonitoring data (4 collections between 2008‐2010) and associated physicochemical datawere withheld for validation.4. A HSI was constructed from these data such that optimal habitat or water quality variableswere set at a suitability of 1.0. Literature values, when reported in the appropriate format,or non‐linear models were used to describe the relationship between reported sub‐optimalvalues and reported abundance, density, or presence/absence data. Once constructed, theHSI predictions were compared against the 4 withheld fish sampling efforts. The HSI wassuccessful in this validation.5. Through an iterative process in cooperation with CPRA, water depth and habitat similarityvariables were removed and suitability functions were adjusted to better fit the availabledata.2. <strong>Technical</strong> Qualitya. TheoryThe concept of a habitat suitability model for a species has roots in the Hutchinson’s (1957)multidimensional niche. Simply put, for each environmental parameter (or stressor), a specieshas a bell‐shaped response peaking in optimal, decreasing over sub‐optimal conditions in higherand/or lower values, and eventually reaching zero ability to support organisms in extremesbeyond a species’ tolerance. Because many environmental parameters may impact anorganism, the niche may be conceived as a multi‐dimensional volume defined by these multipleindividual tolerance relationships. In the central region of this volume, conditions across allenvironmental parameters are optimal, and organisms experience low stress, high reproductivesuccess, and high somatic growth. As conditions approach the volume’s boundaries, one ormore environmental parameters exert a stress upon the organisms that decreases reproductivesuccess and/or growth. Beyond the volume’s boundaries, conditions are such that organismswill experience mortality. This concept is still widely applied (e.g., Davies and Jackson 2006),forms the foundation of several state aquatic biological monitoring programs (e.g., Ohio andMaine) and is being considered for adoption in other states (e.g., Texas and Florida).In the case of largemouth bass, despite the fish consisting of two species and a hybrid, themultidimensional niche is readily described by an HSI. In Stuber’s (1982) HSI, the largemouthbass niche was defined by 22 environmental parameters, of which only four variables wereavailable in the outputs from other master plan models. However, only a few parametersdirectly cause mortality, whereas the other parameters stress fishes decreasing growth and/orreproductive success. Specifically, extremes of temperature, salinity, and dissolved oxygen mayLouisiana’s Comprehensive Master Plan for a Sustainable CoastPage 4
APPENDIX D‐9 LARGEMOUTH BASS HABITAT SUITABILITY INDEX TECHNICAL REPORTcause direct mortality. Excessively warm and cold temperatures will cause bass mortality byfreezing or by protein breakdown in high temperatures (e.g., upper 30s C). <strong>Largemouth</strong> basssurvive far into the northern United States and southern Canada, and overwinter successfullyunder ice. Therefore, only extreme temperatures, which are not experienced in coastalLouisiana, are a concern. Salinity only causes mortality at high levels, and salinities near zero arereadily tolerated. <strong>Largemouth</strong> bass are designed to retain and absorb ions at the gills passingexcess ions in the urine because their primary habitat is hypotonic (i.e., less ions in the waterthan their blood). In high salinities, ions enter through the gills at rates greater than may bepassed in the urine; therefore, imbalances in internal ionic concentrations may cause acute toxicmortality. Dissolved oxygen values were not available for this model, however, similar tosalinity, only extreme values in one direction, very low, are problematic. Therefore, onlytemperature and salinity factors included suitability values of 0. Other model componentswould only be considered stressors in relation to growth and reproductive success and did notinclude 0 values, except aquatic habitat parameter that forced the model to keep the fish inwater.The development of the model then followed that optimal ranges of model inputs wereassigned a suitability of 1.0 and sub‐optimal to lethal values were either reported directly fromthe literature or derived from provided data. <strong>Suitability</strong> curves were fit with polynomial or logitmodels, if expectations had to be derived, such that optimal values were 1.0, less optimal valueswere 1.0 > value > 0 with the relative value based on reported abundance, density, orpresence/absence data (i.e., habitat variable values associated with higher reported densities orcatch‐per‐unit‐effort would be closer to 1.0 and lower values would be scaled closer to 0). Then,the HSI was developed to predict suitability on a 0 – 1.0 scale for each cell per year. Becausephysicochemical data and catch‐per‐unit‐effort from four fish sampling events were withheldfrom model development, these data were used to validate the HSI. Subsequent to thisvalidation effort, the HSI was further modified following an iterative process with CPRA to betterfit the HSI to available inputs.V1 ‐ percent emergent vegetation per 500m 2V2 ‐ average water temperature for April to AugustV3 ‐ maximum yearly salinity for June to AugustV6 ‐ percent of cell that is SAV per 1km 2V7 ‐ index value of primary productivity in open watersHSI = [(SI 1 x SI 7 ) 1/8 x (SI 1 x SI 6 ) 1/8 x (SI 2 x SI 3 x SI 7 ) 1/12 x (SI 2 ) 1/4 ]Variables V4 (water depth) and V5 (habitat similarity) were initially proposed for this model;however, through an iterative process in cooperation with CPRA during model output qualityreview, the variables were removed.In the equation above, the SIs are weighted following Stuber’s (1982) HSI. In Stuber’s (1982)HSI, suitability was based on four equally‐weighted factors that influence largemouth basshabitat selection, which were food, cover, water quality, and reproductive potential. In theoriginal HSI, 22 variables were used to describe the four factors. To ensure that the product ofthe geometric mean was bounded by 0 and 1, variables were grouped by the factor that theydescribed and weighted such that each group of variables only contributed 25% to the product.In this HSI, variables were also grouped to address food (SI 1 and SI 7 ), cover (SI 1 and SI 6 ), waterLouisiana’s Comprehensive Master Plan for a Sustainable CoastPage 5
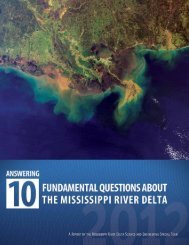
APPENDIX D‐9 LARGEMOUTH BASS HABITAT SUITABILITY INDEX TECHNICAL REPORTquality (SI 2 , SI 3 , and SI 7 ), and reproduction (SI 2 ). Even with a ¼ exponent weighting eachgrouping to 25% contribution, groups with multiple variables would contribute more to themodel than groups with only a single variable. Therefore, the exponent was multiplied by 1/(#variables in the group) to ensure that the whole group of variables only contributed 25% to theHSI and was bounded by 0 and 1.<strong>Suitability</strong> function for V1 based on % emergent vegetation * 100.Emergent vegetation, which in this model is included as emergent vegetation of all types per500 m 2 , provides two important functions for largemouth bass. <strong>Bass</strong> forage on smaller fish andinvertebrates that live on the vegetation’s submerged surfaces or in the spaces among thevegetation’s stalks or roots. <strong>Bass</strong> also use the shade and physical structures (e.g., roots andsubmerged stalks) as cover from their predators or to modify their local microhabitat conditions(e.g., seeking shade to cool their body temperatures). The relationship between emergentvegetation with bass suitability was modified from Stuber’s (1982) bottom cover variable,because in Louisiana coastal systems, vegetation provides the overwhelming majority ofavailable cover (Fries 2010; Kaller and Kelso 2010), unlike the systems where Stuber’s (1982)model was derived that have a diversity of rock, gravel, woody debris, and vegetation as bottomcover. Data from Sammons et al. (2005), Hoyer et al. (2008), Reed and Pereira (2009), and Fries(2010) modified the Stuber (1982) bottom cover – suitability relationship as indicated in Figure1. Generally, these studies reported that intermediate percent cover values were optimal forlargemouth bass because these values afforded suitable cover from predators, allowedmicrohabitat condition modification, and foraging opportunities without being either too densefor swimming or too sparse. Because lack of cover and reduced foraging opportunities are notdirectly lethal and operate more as physiological stressors, the suitability function does notreach 0 indicating that unsuitable vegetation will not prevent habitat use but may deter use ifother unsuitable conditions co‐occur.SI 1 = 0.01 for V1< 200.0991* V1‐1.97 for 20 ≤ V1 < 301.0 for 30 ≤ V1 < 50‐0.028* V1+2.4 for 50 ≤ V1 < 850.01 for V1 ≥ 85Louisiana’s Comprehensive Master Plan for a Sustainable CoastPage 6
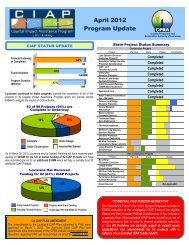
APPENDIX D‐9 LARGEMOUTH BASS HABITAT SUITABILITY INDEX TECHNICAL REPORT10.8Suitablity <strong>Index</strong>0.60.40.200 20 40 60 80 100% Emergent VegetationFigure 1. The relationship between % emergent vegetation with the suitability index.<strong>Suitability</strong> function for V2 based on temperature in Celsius.Extreme temperatures are known to be lethal for largemouth bass. In this model, temperatureis an interpolated mean of April to August temperatures applied to an individual cell or polygon.Temperatures outside optimal ranges can be physiological stressor through the denaturing ofproteins, complications in osmoregulation, and interference with metabolic pathways.Typically, Louisiana coastal waters do not reach temperatures that would elicit direct mortality.However, temperatures do reach stressful values. Stuber (1982) included temperature in theoriginal largemouth bass model, however, the relationship between temperature with thesuitability index was largely based on studies in the northern 2/3 of the United States. Since1982, additional research has occurred in the southern United States and Caribbean that wasused to modify Stuber’s (1982) relationship between temperature with the suitability index(Neal and Noble 2006, Buisson et al. 2008, Hayer and Irwin 2008, Rogers and Allen 2009, Rypel2009, Fries 2010). Further, Stuber’s (1982) HSI did not distinguish between northern strain orFlorida bass that differ in their relationships with temperature. This HSI uses the higher thermaltolerance of Florida bass rather than northern strain bass because of the widespread stockingand occurrence statewide of Florida bass and Florida‐northern hybrids (Constant 1990; Fries2010). The relationship between temperature with the suitability index is indicated in Figure 2.The suitability curve is skewed toward higher temperatures to reflect the genetic contribution ofFlorida bass. The decision rule below does reach 0 for temperatures reported to be outrightlethal to largemouth bass.SI 2 = 0 for V2 ≤ 60.061*V2 + 0.196 for 7 ≤ V2 < 181.0 for 18 ≤ V2 < 30‐0.166*V2 + 5.9 for 30 ≤ V2 < 360 for V2 ≥ 36Louisiana’s Comprehensive Master Plan for a Sustainable CoastPage 7
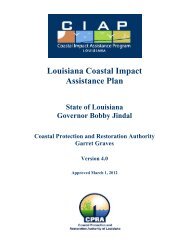
APPENDIX D‐9 LARGEMOUTH BASS HABITAT SUITABILITY INDEX TECHNICAL REPORT10.90.8<strong>Suitability</strong> <strong>Index</strong>0.70.60.50.40.30.20.100 6 7 18 30 36 37CelsiusFigure 2. The relationship between temperature with the suitability index.<strong>Suitability</strong> function for V3 based on salinity measured in parts per thousand (ppt).Salinity is a very important limiting water quality variable for largemouth bass, which is aninterpolated annual mean value applied to an individual cell or polygon. <strong>Largemouth</strong> bassevolved in a freshwater environment hypotonic to their internal fluids and have developedmechanisms to retain internal ions and capture new ions at the gills and through the gut.However, in saltwater, the environment becomes hypertonic compared to the fish and theosmoregulatory mechanisms that conserve ions in freshwater lead to toxic and often lethalaccumulations of ions. Very little research on largemouth bass in coastal and estuarineecosystems had been completed when Stuber (1982) developed the original largemouth bassHSI and Stuber’s (1982) salinity suitability index is zero above 2 ppt. Since 1982, a number ofstudies in coastal and estuarine environments, as well as, laboratory studies have increased thedocumented upper salinity tolerance for largemouth bass to 12 ppt (Meador and Kelso 1989,1990; Peer et al. 2006; Rehage and Loftus 2007). These studies did note physiological impactsbetween 8 and 12 ppt, and the salinity‐suitability index reported in this model reduces suitabilitybetween 8 and 12 ppt based on these studies. The upper tolerance at 12 ppt and decreasedsuitability between 8 and 12 ppt are depicted in Figure 3. Decision rules for the salinitysuitabilityindex are below.SI 3 = 1 for V3 ≤ 8‐0.037*V3 + 1.109 for 8 < V3 ≤ 120 for V3 > 12Louisiana’s Comprehensive Master Plan for a Sustainable CoastPage 8
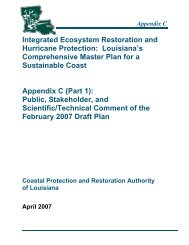
APPENDIX D‐9 LARGEMOUTH BASS HABITAT SUITABILITY INDEX TECHNICAL REPORT<strong>Suitability</strong> <strong>Index</strong>10.90.80.70.60.50.40.30.20.100 8 12 20Salinity (ppt)Figure 3. The relationship between salinity with suitability index.<strong>Suitability</strong> function for V6, which is the percent of a cell or polygon that is SAV per 1 km 2 ,restricts largemouth bass to aquatic habitats by excluding terrestrial habitats.Submersed aquatic vegetation, which in this model is included submersed vegetation of all typesper 1 km 2 , provides cover and foraging opportunities for largemouth bass, similar to thefunctions of emergent vegetation. Similar to emergent vegetation, bass forage on smaller fishand invertebrates that live on the vegetation’s submerged surfaces or in the spaces among thevegetation’s stalks or roots. <strong>Bass</strong> also use the shade and physical structures (e.g., roots andsubmerged stalks) as cover from their predators or to modify their local microhabitat conditions(e.g., seeking shade to cool their body temperatures). The relationship between submersedaquatic vegetation with bass suitability was modified from Stuber’s (1982) bottom covervariable, because in Louisiana coastal systems, vegetation provides the overwhelming majorityof available cover (Fries 2010; Kaller and Kelso 2010), unlike the systems where Stuber’s (1982)model was derived that have a diversity of rock, gravel, woody debris, and vegetation as bottomcover. Data from Sammons et al. (2005), Hoyer et al. (2008), Reed and Pereira (2009), and Fries(2010) modified the Stuber (1982) bottom cover – suitability relationship as indicated in Figure4. Generally, these studies reported that high levels of cover values were optimal forlargemouth bass because these values afforded suitable cover from predators, allowedmicrohabitat condition modification, and foraging opportunities. Because lack of cover andreduced foraging opportunities are not directly lethal and operate more as physiologicalstressors, the suitability function does not reach 0 indicating that unsuitable vegetation will notprevent habitat use but may deter use if other unsuitable conditions co‐occur. This variable alsorestricts largemouth bass to aquatic habitats because submersed aquatic vegetation is onlypredicted from the Vegetation module in habitats that are majority aquatic throughout the year.Values are:[1 ‐ (% open water + % emergent vegetation)]*100.SI 6 = 0 for V6 = 1001‐0.01*V6 for V6 < 100Louisiana’s Comprehensive Master Plan for a Sustainable CoastPage 9
APPENDIX D‐9 LARGEMOUTH BASS HABITAT SUITABILITY INDEX TECHNICAL REPORT<strong>Suitability</strong> <strong>Index</strong>10.90.80.70.60.50.40.30.20.100 20 40 60 80 100% SAVFigure 4. The relationship between % submersed aquatic vegetation with the suitability index.<strong>Suitability</strong> Function for V7 based on model predictions of chlorophyll a (ug/L).Primary productivity is a direct predictor of forage availability and water quality. In this model,primary productivity is represented by a surrogate variable, chlorophyll a, because primaryproductivity is difficult to directly measure or model. Chlorophyll a is a component of mostimportant phytoplankton and aquatic plants and is readily measured and modeled. Primaryproductivity was not included in Stuber’s (1982) HSI, likely because of difficulty in measurement.However, since 1982, technological advances have eased the measurement of chlorophyll a, andseveral studies have examined the important relationship between primary productivity withlargemouth bass (Parkos and Wahl 2002, Fries 2010). The conceptual relationship betweenprimary productivity with largemouth bass is well developed. Primary producers provide foragefor zooplankton, small invertebrates, and small fish. Zooplankton and small invertebrates areforage for larval and juvenile bass. Zooplankton, small invertebrates, and small fish are foragefor other larger fish and invertebrates that are forage for adult largemouth bass. Highlyelevated chlorophyll a is often associated with eutrophication, which may negatively impactlargemouth bass through depression of dissolved oxygen. Data reported by Parkos and Wahl(2002) and Fries (2010) did not identify chlorophyll a levels where eutrophication was clearlyleading to dissolved oxygen depression and bass stress or mortality. Therefore, the relationshipbetween chlorophyll a with the suitability index describes a generally positive relationship.SI 7 = ..∗Louisiana’s Comprehensive Master Plan for a Sustainable CoastPage 10
APPENDIX D‐9 LARGEMOUTH BASS HABITAT SUITABILITY INDEX TECHNICAL REPORT<strong>Suitability</strong> <strong>Index</strong>10.90.80.70.60.50.40.30.20.100 10 20 30 40 50 60Chlorophyll a (ug/L)Figure 5. The relationship between chlorophyll a with the suitability index.b. Description of system being represented by the modelThis model predicts how suitable the habitat for largemouth bass is in a given cell per year. Itdoes not predict density or abundance. This model addresses aquatic habitat only and primarilyreflects the freshening or salinization of aquatic habitats. Although salinity is the principal driverof the model, the influence of salinity is modified by temperature and vegetation variables thatreduce habitat suitability when habitat is poor or temperatures are extreme, even if salinity issuitable. As suitability approaches 1, salinity is within tolerable ranges, vegetation andchlorophyll a, are appropriate, and temperatures are not extreme. Only salinity may drivesuitability to 0 and other variables may only force suitability to very low values.This model is dependent on temperature, salinity, chlorophyll a, and vegetation variables. Anyuncertainty in these input variables will be reflected in this model output. Additional discussionof uncertainty and model limitations is included in Sections 5 and 7.c. Analytical requirementsThe largemouth bass HSI has the following analytical requirements: 1) food availability asdescribed by emergent vegetation (SI 1 ) and chlorophyll a (SI 7 ); 2) cover as described byemergent vegetation (SI 1 ) and submersed aquatic vegetation (SI 6 ); 3) water quality as describedby temperature (SI 2 ), salinity (SI 3 ), and chlorophyll a (SI 7 ); and 4) reproduction as described bytemperature (SI 2 ). Because this HSI is based on Stuber’s (1982) HSI, 0 to 1 suitability indicesderived from the variables are actually incorporated in the HSI. Each 0 to 1 suitability index isderived from the variables following the decision rules associated with Figures 1 through 5 inthis document. The suitability index values for each variable are multiplied with the othervariables in the groups of food, cover, and water quality, and these products represents the rawsuitability of a given cell or polygon with regard to the variables. In the reproduction group, thesuitability index is simply the value from temperature. Because food, cover, water quality, andreproduction contribute equally to the HSI, each product of variable multiplication is weightedsuch that the products are equal. Unequal number of variables in each product unbalance theLouisiana’s Comprehensive Master Plan for a Sustainable CoastPage 11
APPENDIX D‐9 LARGEMOUTH BASS HABITAT SUITABILITY INDEX TECHNICAL REPORTmodel, therefore, exponents range from 1/4 for reproduction to 1/12 for water quality so thateach product comprises only 25% of the model.d. AssumptionsDuring HSI development, several key assumptions were made. First, although the final set ofvariables all were derived from data collected in Louisiana, supplemental data from neighboringstates was included to increase the sample size for deriving the variable‐suitabilityrelationships. Because largemouth bass are native, or thriving as an introduced species, acrossthis region, the assumption that data imported from neighboring states and territories wasrelevant to the HSI development was likely valid. Second, based on comparison of competingfunctions (e.g., linear and cubic) by chi‐square/degree of freedom fit statistic, it was assumedthat the polynomial or logit function employed to generate 0 to 1 suitability values were thecorrect non‐linear models. The author has published models selected by this method (e.g.,Kaller et al. 2011) and believed this assumption was valid. Finally, the relationship betweenvariables and largemouth bass in the literature were almost always relationships betweenvariables and density or abundance of bass. The HSI operates as a suitability index that predictspresence or absence rather than density or abundance. The author assumed that high predicteddensity corresponded to high predicted probability of occurrence or habitat suitability and viceversa. Because this assumption may not be true in cases where habitat could be suitable, butfish could not reach these habitats, it is important to acknowledge that high suitability implyingpresence is an assumption. However, given the natural dispersal capability of largemouth bassand widespread stocking, it is unlikely that barriers are a problem and the assumption of habitatsuitability implying presence is likely valid.e. Identification of formulas used in the model and proof that the computations are appropriateand done correctlyThe model decision rules that were coded are provided in section 2.a. above. Quality reviewwas performed by both the model coders and CPRA to ensure formulas and computations werecorrect.3. System Qualitya. Description and rationale for selection of supporting software tool/programming languageand hardware platformBuilding upon the ecological modeling application development performed for the Evergladesmodeling community, Java was used as the programming language inside the Eclipse RCPenvironment which supports plug‐in software development. This approach facilitated theconstruction of software suites which execute the specific decision rules provided by subjectmatter experts allowing an end‐user to choose which of the ecosystem services models to run.b. Proof that the programming was done correctlyAll software products are the result of multiple programmers working in concert. As part of thecode development process, code classes were either developed by teams which ensuredmultiple individuals were conducting real‐time code reviews or when codes were individuallywritten, spot checks were done prior to production builds and exports.c. Availability of software and hardware required by modelThe choice of Java as the development platform ensures the broadest execution platform.These software suites can run on desktops with the following operating systems: Windows XP, 7Louisiana’s Comprehensive Master Plan for a Sustainable CoastPage 12
APPENDIX D‐9 LARGEMOUTH BASS HABITAT SUITABILITY INDEX TECHNICAL REPORT(32 and 64 bit), Apple OSX (32 and 64 bit), Linux. Furthermore, these Java executables could beeasily re‐compiled to run on Windows or Linux Application Servers.d. Description of process used to test and validate modelModel output validation occurred at two points in the process. As described previously, fourdata collections were compared to model predictions in a cross‐validation type approach.Secondly, visual inspection of the model output by the author and representatives of CPRAcompared to known largemouth bass distributions suggested improvements, and followingimprovements, model success in prediction. The model output also was exhibited to arepresentative of the U.S. Fish and Wildlife Service, who generally agreed with the outputexcept for the coarse size of some polygons which may yield deceptive distributions near MarshIsland. Because the polygon sizes are set by other working groups, this valid criticism is notactionable.e. Discussion of the ability to import data into other software analysis tools (interoperabilityissue)Being standards compliant with international modeling data standards ensures rather broadinteroperability. Unidata actively supports netCDF read/write libraries for C++, Java, C# andFortran programming languages across multiple operating systems. Additionally, netCDF isnatively consumable by commercial software product such as ESRI ArcMAP and MatLab.Furthermore, the Everglades Joint Ecologic Modeling community has backed a USGS softwaredevelopment effort resulting in EverVIEW which brings an open‐source visualization platformsolution to the complex realm of binary modeling data.4. Usabilitya. Availability of input data necessary to support the modelThe model requires readily available or predictable temperature, salinity, emergent vegetation,submerged vegetation, and chlorophyll a data. The input files required to run this model areavailable through the CPRA.b. Formatting of output in an understandable mannerThe output data is a suitability index ranging from 0.0 to 1.0 that represents the potential foragriculture/aquaculture of a 500 x 500m model grid cell. The output files are in netCDF formatand can be viewed using EverVIEW or ArcGIS.c. Usefulness of results to support project analysisSpecifically, large changes in the predicted HSI values reflect changes in salinity. Salinity eithercauses aquatic habitats to become unsuitable by becoming excessively high, which causes directmortality for largemouth bass, or by altering vegetation such that the vegetation no longersupports cover and forage needs of largemouth bass. If land loss occurs through coastal erosionand/or salinity increases through saltwater intrusion, habitat suitability will decrease and,eventually, reach zero. If aquatic habitats are fresh and remain fresh, suitability will remainmoderate to high. If saline habitats freshen below 12 ppt, suitability will increase and willincrease more dramatically if salinity falls below 8 ppt. Given these responses to changes insalinity directly and through vegetation, largemouth bass are an ideal organism to evaluateincreases and decreases in salinity as a result of various restoration and protection projects.Diversion, pumps, levee notches or breaches, or other projects that add freshwater to coastalmarshes should increase habitat suitability in adjacent cells and polygons and may increase theLouisiana’s Comprehensive Master Plan for a Sustainable CoastPage 13
APPENDIX D‐9 LARGEMOUTH BASS HABITAT SUITABILITY INDEX TECHNICAL REPORTnumber of cells and polygons with suitable largemouth bass habitat. Dams, levees, closures, orother actions that prevent freshwater from entering marshes should increase or maintain highsalinities and thus decrease habitat suitability. Because no additional coastal action over thenext 50 years would likely result in an increase in coastal salinities, decreasing habitat suitabilitypredicted by this model illustrates the consequences of no future protection and restorationaction. Finally, because salinity of 12 ppt is a threshold for zero suitability and 8 ppt marks apoint where suitability rapidly increases or decreases, the largemouth bass HSI also indicateshabitats transitioning through intermediate salinities becoming saltier or fresher.d. Ability to export results into project reportsThe model output is in netCDF format, which provides both a graphical and tabularrepresentation of the model results that can be incorporated into reports. Model outputs canalso be imported into ESRI ArcMap.e. Training availabilityTraining for model usage would be provided through CPRA.f. Users documentation availability and whether it is user friendly and completeThere are currently no user’s guides or technical manuals to support the model; however, themodel does have a help screen that explains how to convert model inputs into the necessaryformat as well as which files are necessary to run the model.g. <strong>Technical</strong> support availabilityAccess to technical support would be provided through CPRA.h. Software/hardware platform availability to all or most usersThe ecosystem services modeling suite, being coded in Java, will run on most operating systems.i. Accessibility of the modelAccess to model and associated installation and execution files would be provided throughCPRA.j. Transparency of model and how it allows for easy verification of calculations and outputsModel code will be provided for review.5. Sources of model uncertaintyThis model relies on measured and interpolated data, such as temperature and salinity, as well as,modeled inputs, including emergent vegetation and chlorophyll a. As with all data, errors occurduring measurement, and as with all modeled data, model outputs are estimates with varying levelsof confidence. However, validation against withheld data, and visual inspection of model outputagainst known patterns in largemouth bass distribution suggest that these errors are small. Othererrors from the omission of important variables, such as dissolved oxygen and behavioral variablesmay be reduced through interpretation rather than drawing direct conclusions from inspection ofthe output. For example, the model does appear to predict largemouth bass in open water, which isnot likely given their strong behavioral tendencies against open water (i.e., a Type I error of falselyidentifying habitat). This may contribute to some uncertainty in the in‐shore and off‐shoredistributions; however, if the outputs are interpreted with insight into behavior, this uncertaintyshould be minimized.Louisiana’s Comprehensive Master Plan for a Sustainable CoastPage 14
APPENDIX D‐9 LARGEMOUTH BASS HABITAT SUITABILITY INDEX TECHNICAL REPORT6. Suggested model improvementsInclusion of water depth and dissolved oxygen data would have greatly improved model predictions.As mentioned in Section 5, the model does predict largemouth bass in open waters that they areunlikely to use. In other words, the model has that potential for Type I errors in incorrectlyidentifying suitable habitat. However, as mentioned in Section 5, interpretation of model outputcould address this shortcoming. Further, it is possible that although freshwater diversions lowersalinity, the same inputs could lower dissolved oxygen. Potentially, largemouth bass could then belimited by dissolved oxygen, despite adequate conditions in other variables, which would result inType I model error. This error would be much more difficult to address in the current output. Theauthor suggests inclusion of these variables as inputs in future modeling efforts.7. Quality reviewSpecific QR procedures for the <strong>Largemouth</strong> <strong>Bass</strong> HSI module to support the 2012 Coastal MasterPlan included comparison of modeled predictions with expected outcomes given the known inputs.The modeling team used known spatial patterns and temporal patterns in input to predict patternsin habitat quality for each of the species8. Uncertainty analysisDetails regarding the uncertainty analysis for this model is available in Appendix D‐27 ModelUncertainty Analysis. This analysis examined the decision rules for each model variable. As well,additional model runs were performed on original and modified decision rules for the variables.Specifically, decision rules for variables SI 1 (emergent vegetation) and SI 6 (submersed aquaticvegetation) were modified during the uncertainty analysis.9. ReferencesBuisson, L., L. Blanc, and G. Grenouillet. 2008. Modeling stream fish species distribution in a rivernetwork: The relative effects of temperature versus physical factors. Ecology of Freshwater Fish 17:244‐257.Chick, J.H., C.R. Ruetz III, and J.C. Trexler. 2004. Spatial scale and abundance patterns of large fishcommunities in freshwater marshes of the Florida Everglades. Wetlands 24: 652‐664.Constant, G.C. 1990. Genetics and growth of largemouth bass in thirteen Louisiana lakes. M.S.Thesis, Louisiana State University, Baton Rouge.Davies, S.P. and S.K. Jackson. 2006. The biological condition gradient: A descriptive model forinterpreting change in aquatic ecosystems. Ecological Applications 16: 1251‐1266.Fries. 2010. Introgression, health, and condition of Florida, Northern, and Fx Hybrid <strong>Largemouth</strong><strong>Bass</strong> in Louisiana Water Bodies. M.S. Thesis. Louisiana State University, Baton Rouge.Garvey, J.E., R.A. Stein, R.A. Wright, and M.T. Bremigan. 2002. Exploring ecological mechanismsunderlying largemouth bass recruitment along environmental gradients. Pages 7‐24 in Phillip, D.P.and M.S. Ridgeway, editors. Black <strong>Bass</strong>: Ecology, Conservation, and Management. AmericanFisheries Society, Symposium 31, Bethesda, MD. 724 pp.Louisiana’s Comprehensive Master Plan for a Sustainable CoastPage 15
APPENDIX D‐9 LARGEMOUTH BASS HABITAT SUITABILITY INDEX TECHNICAL REPORTHasler, C.T., C.D. Suski, K.C. Hanson, S.J. Cooke, and B.L. Tufts. 2009. The influence of dissolvedoxygen on winter habitat selection by largemouth bass: An integration of field biotelemetry studiesand laboratory experiments. Physiological and Biochemical Zoology 82: 143‐152.Hayer, C.‐A. and E.R. Irwin. 2008. Influence of gravel mining and other factors on detectionprobabilities of coastal plain fishes in the Mobile River basin, Alabama. Transactions of the AmericanFisheries Society 137: 1606‐1620.Hoyer, M.V., M. Woods Jackson, M.S. Allen, and D.E. Canfield Jr. 2008. Lack of exotic hydrillainfestation effects on plants, fish, and aquatic bird community measures. Lake and ReservoirManagement 24: 331‐338.Hutchinson, G.E. 1957. Concluding Remarks. Cold Springs Harbor Symposium on QuantitativeBiology 22: 415‐427.Kaller, M.D., W.E. Kelso, B.T. Halloran, and D.A. Rutherford. 2011. Effects of spatial scale onassessment of dissolved oxygen dynamics in the Atchafalaya River basin, Louisiana. Hydrobiologia658: 7‐15.Maceina, M.J. 1996. <strong>Largemouth</strong> bass abundance and aquatic vegetation in Florida lakes: Analternative interpretation. Journal of Aquatic Plant Management 34: 43‐47.Meador, M.R. and D.M. Carlisle. 2007. Quantifying tolerance indicator values for commonstream fish of the United States. Ecological Indicators7: 329‐338.Meador, M.R. and W.E. Kelso. 1989. Behavior and movements of largemouth bass in response tosalinity. Transactions of the American Fisheries Society 118: 409‐415.Meador, M.R. and W.E. Kelso. 1990. Growth of largemouth bass in low‐salinity environments.Transactions of the American Fisheries Society 119: 545‐552.Moxley, D.J. and F.H. Langford. 1982. Beneficial effects of hydrilla on two eutrophic lakes in centralFlorida. Proceedings of the Annual Conference of the Southeastern Association of Fish and WildlifeAgencies 36: 280‐286.Neal, J.W. and R.L. Noble. 2006. A bioenergetics‐based approach to explain largemouth bass size intropical reservoirs. Transactions of the American Fisheries Society 135: 1535‐1545.Ozen, O. and R.L. Noble. 2002. Relationships between water level fluctuations and largemouth bassspawning in a Puerto Rico reservoir. Pages 213‐220 in Phillip, D.P. and M.S. Ridgeway, editors. Black<strong>Bass</strong>: Ecology, Conservation, and Management. American Fisheries Society, Symposium 31,Bethesda, MD. 724 pp.Ozen, O. and R.L. Noble. 2005. Relationship between largemouth bass recruitment and water leveldynamics in a Puerto Rico reservoir. Lake and Reservoir Management 21: 89‐95.Peer, A.C., D.R. DeVries, and R.A. Wright. 2006. First‐year growth and recruitment of coastallargemouth bass (Micropterus salmoides): Spatial patterns unresolved by critical periods along asalinity gradient. Canadian Journal of Fisheries and Aquatic Sciences 63: 1911‐1924.Louisiana’s Comprehensive Master Plan for a Sustainable CoastPage 16
APPENDIX D‐9 LARGEMOUTH BASS HABITAT SUITABILITY INDEX TECHNICAL REPORTRehage, J.S. and W.F .Loftus. 2007. Seasonal fish community variation in headwater mangrovecreeks in the southwestern Everglades: An examination of their role as dry‐down refuges. Bulletin ofMarine Science 80: 625‐645.Rogers, M.W. and M.S. Allen. 2009. Exploring the generality of recruitment hypotheses forlargemouth bass along a latitudinal gradient of Florida lakes. Transactions of the American FisheriesSociety 138: 23‐37.Rypel, A.L. 2009. Climate‐growth relationships for largemouth bass (Micropterus salmoides) acrossthree southeastern USA states. Ecology of Freshwater Fish 18: 620‐628.Sammons, S.M., M.J. Maceina, and D.G. Partridge. 2005. Population characteristics of largemouthbass associated with changes in abundance of submersed aquatic vegetation in Lake Seminole,Georgia. Journal of Aquatic Plant Management 43: 9‐16.Southwick Associates. 2008. Sportfishing in America: An Economic Engine and ConservationPowerhouse. American Sportfishing Association, Alexandria, VA.Stuber, R.J., G. Gebhart, and O.E. Maughan. 1982. <strong>Habitat</strong> suitability index models: <strong>Largemouth</strong><strong>Bass</strong>. U.S.D.I. Fish and Wildlife Service FWS?OBS‐82/10.16. 32pp.Louisiana’s Comprehensive Master Plan for a Sustainable CoastPage 17