FINANCIAL STATEMENTS (Full Version) - Sembcorp
FINANCIAL STATEMENTS (Full Version) - Sembcorp
FINANCIAL STATEMENTS (Full Version) - Sembcorp

You also want an ePaper? Increase the reach of your titles
YUMPU automatically turns print PDFs into web optimized ePapers that Google loves.
Notes to the<br />
Financial Statements<br />
Year Ended December 31, 2008<br />
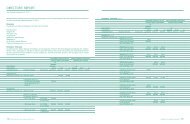
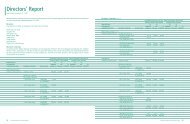
4. SHARE-BASED INCENTIVE PLANS (cont’d)<br />
a. Share Option Plan (cont’d)<br />
<strong>Sembcorp</strong> Industries Ltd<br />
Ordinary shares<br />
2007<br />
Proceeds on<br />
options exercised<br />
Options<br />
during the year<br />
Options cancelled / Options Options Options credited to<br />
Date of grant Exercise price* outstanding Options lapsed / outstanding exercisable exercisable share capital<br />
of options per share at Jan 1, 2007 exercised not accepted at Dec 31, 2007 at Jan 1, 2007 at Dec 31, 2007 S$’000 Exercise period<br />
26/06/2000 S$1.63 961,908 (618,255) (37,700) 305,953 961,908 305,953 1,093 27/06/2001 to 26/06/2010<br />
24/07/2000 S$1.90 812,939 (444,325) (17,666) 350,948 812,939 350,948 908 20/05/2001 to 19/05/2009<br />
24/07/2000 S$1.76 39,066 (2) – 39,064 39,066 39,064 – 16/09/2001 to 15/09/2009<br />
19/04/2001 S$1.19 476,175 (210,025) (35,500) 230,650 476,175 230,650 281 20/04/2002 to 19/04/2011<br />
07/05/2002 S$1.23 178,000 (177,500) (500) – 178,000 – 247 08/05/2003 to 07/05/2007<br />
07/05/2002 S$1.23 572,075 (252,625) (25,200) 294,250 572,075 294,250 345 08/05/2003 to 07/05/2012<br />
17/10/2002 S$0.62 188,000 (187,000) (1,000) – 188,000 – 144 18/10/2003 to 17/10/2007<br />
17/10/2002 S$0.62 510,000 (338,000) (21,375) 150,625 510,000 150,625 257 18/10/2003 to 17/10/2012<br />
02/06/2003 S$0.78 227,250 (188,500) (2,000) 36,750 174,125 36,750 171 03/06/2004 to 02/06/2008<br />
02/06/2003 S$0.78 1,041,225 (637,375) (27,500) 376,350 370,850 376,350 524 03/06/2004 to 02/06/2013<br />
18/11/2003 S$0.93 245,750 (180,250) (2,500) 63,000 192,625 63,000 195 19/11/2004 to 18/11/2008<br />
18/11/2003 S$0.93 1,396,645 (737,020) (50,750) 608,875 746,520 608,875 765 19/11/2004 to 18/11/2013<br />
17/05/2004 S$0.99 266,250 (183,750) (3,500) 79,000 171,750 32,750 205 18/05/2005 to 17/05/2009<br />
17/05/2004 S$0.99 2,195,150 (933,723) (80,000) 1,181,427 664,650 464,552 983 18/05/2005 to 17/05/2014<br />
22/11/2004 S$1.16 268,750 (156,500) (5,000) 107,250 174,250 60,500 205 23/11/2005 to 22/11/2009<br />
22/11/2004 S$1.16 2,621,525 (1,028,625) (98,500) 1,494,400 1,085,025 774,525 1,309 23/11/2005 to 22/11/2014<br />
01/07/2005 S$2.37 282,500 (160,000) – 122,500 138,125 26,250 399 02/07/2006 to 01/07/2010<br />
01/07/2005 S$2.37 4,761,553 (2,099,131) (290,775) 2,371,647 2,152,303 736,897 5,166 02/07/2006 to 01/07/2015<br />
21/11/2005 S$2.36 317,500 (133,750) – 183,750 146,875 70,000 336 22/11/2006 to 21/11/2010<br />
21/11/2005 S$2.36 5,325,820 (2,249,930) (333,570) 2,742,320 2,641,945 1,057,820 5,544 22/11/2006 to 21/11/2015<br />
09/06/2006 S$2.52 525,000 (52,500) – 472,500 – 78,750 132 10/06/2007 to 09/06/2011<br />
09/06/2006 S$2.52 7,450,500 (2,636,205) (514,825) 4,299,470 9,000 1,233,095 6,651 10/06/2007 to 09/06/2016<br />
30,663,581 (13,604,991) (1,547,861) 15,510,729 12,406,206 6,991,604 25,860<br />
* The exercise prices for outstanding share options granted prior to April 27, 2007 were adjusted as a result of the Special Dividend payment<br />
in 2007.<br />
142 Delivering Essential Solutions <strong>Sembcorp</strong> Industries Annual Report 2008 143