Open Space and Public Place Plan - City of West Torrens - SA.Gov.au
Open Space and Public Place Plan - City of West Torrens - SA.Gov.au
Open Space and Public Place Plan - City of West Torrens - SA.Gov.au

You also want an ePaper? Increase the reach of your titles
YUMPU automatically turns print PDFs into web optimized ePapers that Google loves.
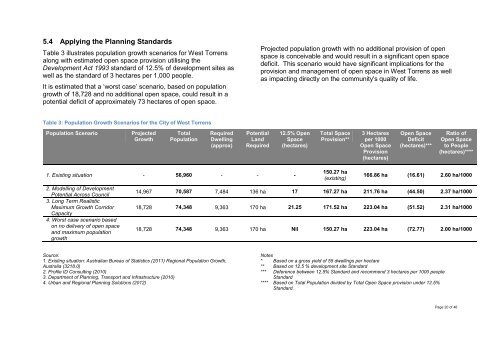
5.4 Applying the <strong>Plan</strong>ning St<strong>and</strong>ards<br />
Table 3 illustrates population growth scenarios for <strong>West</strong> <strong>Torrens</strong><br />
along with estimated open space provision utilising the<br />
Development Act 1993 st<strong>and</strong>ard <strong>of</strong> 12.5% <strong>of</strong> development sites as<br />
well as the st<strong>and</strong>ard <strong>of</strong> 3 hectares per 1,000 people.<br />
It is estimated that a ‘worst case’ scenario, based on population<br />
growth <strong>of</strong> 18,728 <strong>and</strong> no additional open space, could result in a<br />
potential deficit <strong>of</strong> approximately 73 hectares <strong>of</strong> open space.<br />
Projected population growth with no additional provision <strong>of</strong> open<br />
space is conceivable <strong>and</strong> would result in a significant open space<br />
deficit. This scenario would have significant implications for the<br />
provision <strong>and</strong> management <strong>of</strong> open space in <strong>West</strong> <strong>Torrens</strong> as well<br />
as impacting directly on the community's quality <strong>of</strong> life.<br />
Table 3: Population Growth Scenarios for the <strong>City</strong> <strong>of</strong> <strong>West</strong> <strong>Torrens</strong><br />
Population Scenario<br />
Projected<br />
Growth<br />
Total<br />
Population<br />
Required<br />
Dwelling<br />
(approx)<br />
Potential<br />
L<strong>and</strong><br />
Required<br />
12.5% <strong>Open</strong><br />
<strong>Space</strong><br />
(hectares)<br />
Total <strong>Space</strong><br />
Provision**<br />
3 Hectares<br />
per 1000<br />
<strong>Open</strong> <strong>Space</strong><br />
Provision<br />
(hectares)<br />
<strong>Open</strong> <strong>Space</strong><br />
Deficit<br />
(hectares)***<br />
Ratio <strong>of</strong><br />
<strong>Open</strong> <strong>Space</strong><br />
to People<br />
(hectares)****<br />
1. Existing situation - 56,960 - - -<br />
2. Modelling <strong>of</strong> Development<br />
Potential Across Council<br />
3. Long Term Realistic<br />
Maximum Growth Corridor<br />
Capacity<br />
4. Worst case scenario based<br />
on no delivery <strong>of</strong> open space<br />
<strong>and</strong> maximum population<br />
growth<br />
150.27 ha<br />
(existing)<br />
166.86 ha (16.61) 2.60 ha/1000<br />
14,967 70,587 7,484 136 ha 17 167.27 ha 211.76 ha (44.50) 2.37 ha/1000<br />
18,728 74,348 9,363 170 ha 21.25 171.52 ha 223.04 ha (51.52) 2.31 ha/1000<br />
18,728 74,348 9,363 170 ha Nil 150.27 ha 223.04 ha (72.77) 2.00 ha/1000<br />
Source:<br />
1. Existing situation: Australian Bure<strong>au</strong> <strong>of</strong> Statistics (2011) Regional Population Growth,<br />
Australia (3218.0)<br />
2. Pr<strong>of</strong>ile ID Consulting (2010)<br />
3. Department <strong>of</strong> <strong>Plan</strong>ning, Transport <strong>and</strong> Infrastructure (2010)<br />
4. Urban <strong>and</strong> Regional <strong>Plan</strong>ning Solutions (2012)<br />
Notes<br />
* Based on a gross yield <strong>of</strong> 55 dwellings per hectare<br />
** Based on 12.5 % development site St<strong>and</strong>ard<br />
*** Deference between 12.5% St<strong>and</strong>ard <strong>and</strong> recommend 3 hectares per 1000 people<br />
St<strong>and</strong>ard<br />
**** Based on Total Population divided by Total <strong>Open</strong> <strong>Space</strong> provision under 12.5%<br />
St<strong>and</strong>ard.<br />
Page 20 <strong>of</strong> 46