unique asr&per revis.. - Ministry Of Agriculture, Food and Cooperatives
unique asr&per revis.. - Ministry Of Agriculture, Food and Cooperatives
unique asr&per revis.. - Ministry Of Agriculture, Food and Cooperatives

Create successful ePaper yourself
Turn your PDF publications into a flip-book with our unique Google optimized e-Paper software.
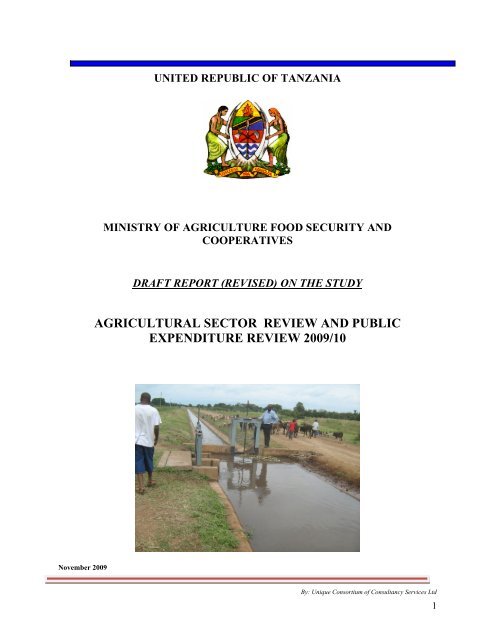
UNITED REPUBLIC OF TANZANIA<br />
MINISTRY OF AGRICULTURE FOOD SECURITY AND<br />
COOPERATIVES<br />
DRAFT REPORT (REVISED) ON THE STUDY<br />
AGRICULTURAL SECTOR REVIEW AND PUBLIC<br />
EXPENDITURE REVIEW 2009/10<br />
November 2009<br />
By: Unique Consortium of Consultancy Services Ltd<br />
1
This consultancy report was prepared by Unique Consortium of Consultancy Services Limited<br />
(UCCS) team<br />
Led by:<br />
M . A. Maro<br />
:Other main consultant members were:<br />
Dr. Omari K. Mbura; Dr. Joseph P. Kimati; <strong>and</strong> Ali N. Ngongolo<br />
: MAFC Counterpart staff were: D. M. Biswalo; C.W. Wambura; N. Andrew <strong>and</strong> Ms. Nsi<strong>and</strong>e<br />
Raymond <strong>and</strong> D.A. Rwezaura<br />
UCCS Address: P.O. Box 3309, Dar es Salaam; phone: 255-022- 2137054/255-22- 2850003; cell 0754899535/<br />
0754850600:<br />
3
ACKNOWLEDGEMENT<br />
The Consultant Team wishes to acknowledge the very ample coo<strong>per</strong>ation provided by the several<br />
officials at national, regional <strong>and</strong> district level. We also register our appreciation to private sector<br />
entities, NGOs/ CBOs <strong>and</strong> community individuals <strong>and</strong> groups, who came to our assistance in<br />
the course of executing this quite extensive consultancy assignment. We are also very grateful to<br />
the technical <strong>per</strong>sonnel <strong>and</strong> the communities in all the sites visited; these included irrigation<br />
schemes, farming villages, livestock services facilities, market centres, training institutions, <strong>and</strong><br />
research institutes. All these very kindly accepted to be interviewed <strong>and</strong> did respond adequately<br />
to the many questions posed. In the same t<strong>and</strong>em our very special thanks go to all the parties that<br />
took their valuable time to fill in our questionnaires.<br />
Very special appreciation also goes to the several small-scale farmers/ traders (both as<br />
individuals <strong>and</strong> groups) that participated in the focus group discussions that were conducted in<br />
the course of sourcing valuable information/ data for this study. Our immense thanks go to all<br />
the ASLMs Policy <strong>and</strong> Planning Divisions <strong>and</strong> other Divisions for providing not only<br />
counterpart staff, but also much needed data/ assistance as was being requested from time to<br />
time.<br />
Furthermore, we would like to thank all the distinguished participants of the November 6 th<br />
Stakeholders workshop (held at Ubungo Plaza) for their very thought out comments on the<br />
interim report for this study; their comments helped a lot towards production of the current<br />
draft, which we hope has adequately incorporated all the comments raised.<br />
Finally, we wish to extend our thanks to each <strong>and</strong> everyone who in one way or other assisted the<br />
consultant towards implementing this assignment in the ASLMS <strong>and</strong> in all the zones covered.<br />
4
ABBREVIATIONS/ ACRONYMS<br />
ASDP<br />
Agricultural Sector Development Programme<br />
ASDS<br />
Agricultural Sector Development Strategy<br />
CAN<br />
Calcium Ammonium Nitrate<br />
CBO<br />
Community Based Organisation<br />
DED<br />
District Executive <strong>Of</strong>ficer<br />
DFT<br />
District Facilitation Team<br />
DADP<br />
District Agricultural Development Plan<br />
DALDO District Agricultural <strong>and</strong> Livestock Development <strong>Of</strong>ficer<br />
DAP<br />
Di-Ammonium Phosphate<br />
DRC<br />
Democratic Republic of Congo<br />
FTSP<br />
Fertilizer Transport Subsidy Programme<br />
LGA<br />
Local Government Authority<br />
LGCDG Local Government Capital Development Grant<br />
MAFC<br />
<strong>Ministry</strong> of <strong>Agriculture</strong>, <strong>Food</strong> Security <strong>and</strong> Coo<strong>per</strong>atives<br />
MALDO Municipal Agricultural <strong>and</strong> Livestock Development <strong>Of</strong>ficer<br />
M&E<br />
Monitoring <strong>and</strong> Evaluation<br />
MD<br />
Municipal Director<br />
MKUKUTA Mpango wa Kukuza Uchumi na Kuondoa Umaskini Tanzania (= the NSGRP see<br />
English equivalent below)<br />
NGO<br />
Non Governmental Organisation<br />
NPK<br />
Nitrogen Phosphorus <strong>and</strong> Potassium<br />
NSGRP National Strategy for Growth <strong>and</strong> Reduction of Poverty<br />
PMO-RALG Prime Minister’s <strong>Of</strong>fice- Regional Administration <strong>and</strong> Local Government<br />
RAA<br />
Regional Agricultural Advisor<br />
RAS<br />
Regional Administrative Secretary<br />
RTA<br />
Regional Trade Advisor<br />
SACAs<br />
Saving And Credit Associations<br />
SACCOS Saving <strong>and</strong> Credit Coo<strong>per</strong>ative Society<br />
SADC<br />
Southern Africa Development Community<br />
SGR<br />
Strategic Grain Reserve<br />
SMS<br />
Subject Matter Specialist<br />
SSA<br />
Sub-Saharan Africa<br />
TAMISEMI Tawala za Mikoa na Serikali za Mitaa<br />
TAZARA Tanzania Zambia Railway Authority<br />
TDV 2025 Tanzania Development Vision 2025<br />
TFC<br />
Tanzania Fertilizer Company<br />
TSP<br />
Tri- Su<strong>per</strong>-phosphate<br />
URAA<br />
Uruguay Round Agreement on <strong>Agriculture</strong><br />
VDP<br />
Village Development Plan<br />
5
ABBREVIATIONS / ACRONYMS<br />
TABLE OF CONTENTS<br />
ITEM<br />
PAGE<br />
3<br />
EXECUTIVE SUMMARY 7<br />
MAIN TEXT :(PART - Agricultural Sector nReview (ASR) 31<br />
‣ Introduction <strong>and</strong> Context 31<br />
‣ The Consultancy Assignment 35<br />
‣ Objective of study 35<br />
‣ Scope of Work 35<br />
‣ Approach & methodology 36<br />
ANALYSIS AND FINDINGS: 38<br />
Assessment of Sector Performance 38<br />
Crop Performance<br />
Irrigation Sub-sector Performance 38<br />
‣ At National Level 38<br />
‣ At District Level 40<br />
‣ Farmers undertaking Irrigation 42<br />
Crop Sub-sector Performance: 45<br />
‣ Export Crops - National level 45<br />
‣ Export Crops - District Level 46<br />
‣ Performane in input supply 49<br />
‣ Performane in Agro-Mechanization 51<br />
Sector ability to ensure <strong>Food</strong> Security 56<br />
‣ <strong>Food</strong> Production Trend - At National Level 59<br />
‣ <strong>Food</strong> Production Trend - At District Level 61<br />
Performance of Livestoch Sub Sector 66<br />
Agricultural Services Performance 74<br />
Performance of Coo<strong>per</strong>ative Sub-Sector 78<br />
Marketing Performance 85<br />
‣ -Success Stoties in Marketing (a) KILI_CAFE 90<br />
‣ Success Stoties in Marketing (b) TAHA 92<br />
‣ -Marketing Constraints in General 94<br />
Agro-Processing Performance: 97<br />
‣ Small scale Processing 97<br />
‣ Large Scale Processing 97<br />
Progress in Formulation, Planning <strong>and</strong> Implementation of DADPs 102<br />
Effect of Current Global Economic Meltdown 107<br />
Relevance of the ASDP M&E Framework <strong>and</strong> Short-listed indicators for Assessing Sector Performance 113<br />
Relevance of the Wealth Creation Indicators to be used in measuring Rural Poverty Reduction 117<br />
Status of Implementation of Recommendations made in the 2008 ASR <strong>and</strong> PER 2008/09 120<br />
TART II: PUBLIC EXPENDITURE REVIEW (PER) 122<br />
Recommendations from ASR 134<br />
Recommendations from PER 143<br />
ANNEXES : Annexes Group 1 for PER 144<br />
:Annexes Group 2 for ASR 147<br />
- Annex 1 of ASR - Coffee Sales <strong>and</strong> Prices by Assoc. of Kilimanjaro Coffee Growers (AKSG) 147<br />
- Annex2 of ASR - Some Primary coo<strong>per</strong>atives undertaking combined Production & Marketing activities 148<br />
- Annex 3 of ASR - People Visited 149<br />
- Annex 4 of ASR - References 152<br />
- Annex 5: of ASR - Some of the Study Instruments - checklists 152<br />
6
A. EXECUTIVE SUMMARY<br />
_____________________________<br />
Preamble<br />
This has been a very extensive study that was required to cover some thirteen quite loaded<br />
items of scope of work in a very short <strong>per</strong>iod, particularly due to logistical hitches field had to<br />
be delayed for about two weeks. Yet this report, as the consultant learnt later, was to be<br />
presented in a large stakeholder forum. As a result the first report (which to consultant was<br />
interim) had to be prepared somewhat hurriedly <strong>and</strong> had to be presented at the stakeholders<br />
meeting even before receiving written comments from the client. It is consultant’s hope that<br />
future ASR – PER studies can be undertaken much earlier (say immediately the ASLMs) budget<br />
has been approved (in August) in order to give time for more interaction (including written<br />
comments on the interim draft) between client <strong>and</strong> consultant.<br />
In the interim report presented at the stakeholders meeting, some three items in the TOR scope<br />
of work (those on global meltdown, short list ASDP indicators <strong>and</strong> wealth indicators) had not<br />
been touched, as in the course of study <strong>and</strong> <strong>per</strong>iodic meetings held between some quarters of<br />
the client with the consultant, it was suggested that these three could be left out; hence the<br />
omission in the interim report. Anyway these have now been addressed in this Draft Report.<br />
Objective of the study<br />
The objective of the study assignment is essentially to carry out <strong>per</strong>formance review of the<br />
Agricultural Sector <strong>and</strong> PER for year 2009/2010 <strong>and</strong> make recommendations for way-forward<br />
for the sector. TOR is attached.<br />
Geographical Coverage<br />
Apart from Dar es Salaam, field work was carried out in eight other regions, namely; Tanga,<br />
Kilimajaro, Arusha, Mwanza , Mara, Morogoro, Iringa <strong>and</strong> Mbeya.<br />
Study Approach <strong>and</strong> methodology<br />
This study was undertaken participatorily, with ASLM counterparts on board. Primary data<br />
was obtained through field stakeholder interviews to ASLMs <strong>and</strong> other stakeholders in the field<br />
(Dar es Salaam <strong>and</strong> purposefully selected districts). The districts were Mvomero, Kilombero,<br />
Misungwi, Musoma, Rorya, Mbeya Rural, Korogwe <strong>and</strong> Arumeru.<br />
7
Findings<br />
Sector Performance: 2006/07 to 2008/09<br />
Irrigation Sub-sector:<br />
On the basis of the 2007/08 targets the sub-sector had set to accomplish, it did very well. Thus,<br />
it had set to increase the existing total national area under irrigation to 316,745 hectares by<br />
adding 27,500, but managed to add 22,500 ha, which was 78% achievement. It also it managed<br />
to accomplish feasibility study <strong>and</strong> irrigation design for 47 schemes, as against target of 68, thus<br />
achieving almost 70% success. It also had planned to construct 2 dams in Nyamilangano (in<br />
Kahama District) <strong>and</strong> Maswale (in Babati District), <strong>and</strong> these were 100% completed. Other<br />
success include formulation of 283 irrigation schemes projects, out of which 184 were for<br />
funding under DADP <strong>and</strong> 94 by District Agricultural Development Fund (DIDF).<br />
However, it was observed that at this pace of putting l<strong>and</strong> under irrigation ( at 21,500 ha <strong>per</strong><br />
year) it would take more than 3 centuries to get all the very large high <strong>and</strong> medium irrigation<br />
potential l<strong>and</strong> of up to 7 million ha still unused, to be put under irrigation. <strong>Of</strong> the 7 million ha,<br />
2.1 million ha are of high irrigation potential <strong>and</strong> are part of a vast, 2.7 million ha of very<br />
important wetl<strong>and</strong>s (seasonal <strong>and</strong> <strong>per</strong>manent freshwater swamps <strong>and</strong> flood plains) straddling<br />
most of the country’s main drainage basins, which are in turn drained by several river systems,<br />
including Rufiji/ Ruaha, Malagarasi/ Moyowosi, Pangani, Wami/Ruvu, Kagera, Ugalla,<br />
Suive <strong>and</strong> Mara. Furthermore, it is estimated that annually some 74,000,000,000 cu m surface<br />
water, run-off from the country into the oceans <strong>and</strong> lakes. In addition rain water harvesting to<br />
provide supplementary irrigation to save drying crops is still a farfetched thing in most parts of<br />
the country.<br />
Thus the challenge to the sub-sector is immense <strong>and</strong> the potential is vast. Rapid <strong>and</strong> sustained<br />
credible investment in this sub-sector would contribute much towards sector growth, reduction<br />
of income poverty <strong>and</strong> food security. Presently there are already hundreds of small scale<br />
irrigation schemes that are yet to be completed country-wide; similarly there are a number of<br />
large scale irrigation schemes that awaiting completion in several regions of the country. It was<br />
gratifying, however, to note that budget allocation to this sector (MWI) appears to be on the<br />
increase; from a development budget of about Tshs 140 billion in 2008/09, this increased to<br />
about Tshs 246 billion. Nevertheless, much, much more investment finance is required,<br />
particularly from private sector, especially in the form of Foreign Direct Investment (FDI)<br />
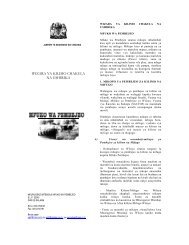
Su<strong>per</strong>iority of irrigated crop over irrigated crop can be illustrated, as <strong>per</strong> Figure ---- below<br />
irrigated <strong>and</strong> rain-fed paddy production at Dakawa Irrigation Scheme area.<br />
Figure K2 : Yield comparison between rain-fed <strong>and</strong> irrigated paddy at Dakawa Irrigated Scheme area<br />
Source: Field survey data<br />
8
Crop Sub-sector:<br />
In the 2006/07 to 2008/09 <strong>per</strong>iod the sub-sector has registered quite positive <strong>per</strong>formance in<br />
terms of increased volume of crop production, in particularly for cash crops. Cotton in<br />
particular depicted the greatest increase; from 130,565 cotton lint bales in 2006/07, this<br />
increased to 200,662 bales in 2007/08 <strong>and</strong> jumped to 368,229 bales in 2008/09, increase of about<br />
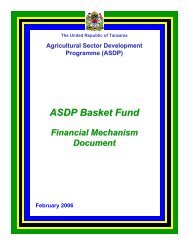
54% <strong>and</strong> 83%, respectively. Coffee <strong>and</strong> pyrethrum too exhibited overall increase, with most<br />
increase being in 2008/09, when these were 63% <strong>and</strong> 43% for coffee <strong>and</strong> pyrethrum,<br />
respectively. See figure P1.1 below.<br />
Figure P1.1 Tanzania Cash Crops Production -<br />
2006/07 to 2008/09 ( tons)<br />
Figure P1.2 <strong>Food</strong> Crops Production : 2006/07 to 2008/09 ( tons)<br />
<strong>Food</strong> crops production over the past three years (see Figure P1.2 above), depicts mixed trend,<br />
with maize, the main crop going up in 2007/08 <strong>and</strong> then coming down slightly in 2008/09.<br />
Cassava on the other h<strong>and</strong> dipped in production in 2007/08, but then shot up in 2008/09. See<br />
the food production trend as displayed in Figure P1.2 above. However, at district level<br />
production of irrigated paddy showed increase over the <strong>per</strong>iod, as already discussed above<br />
<strong>and</strong> in the main text; at Dakawa Irrigation Scheme, for instance.<br />
Performance of the Crop- Subsector Towards Ensuring National <strong>Food</strong> Security<br />
The situation regarding food balance (production as against requirement at least for 2007/08<br />
<strong>and</strong> 2008/09) is as shown under Table NF1 below. As it will be seen in this table total national<br />
food production (cereals + non-cereals) exceeded requirement by about 5% in both years.<br />
Table NF1:Tanzania National <strong>Food</strong> Balance (Production against Requirement) 2007/08 to 2008/09 (Tons)<br />
Cereals& Noncereals<br />
2007/08 2008/09<br />
TOTALS Cereals Noncereals<br />
GRAND<br />
TOTALS<br />
Cereals Noncereals<br />
GRAND<br />
TOTAL<br />
Production 5,587,547 5,284,788 10,872,336 5,265,309 5,656,227 10,921,536<br />
Requirement 6,448,303 3,889,677 10,337,981 6,578,508 3,999,688 10,578,196<br />
Gap (-) / Surplus<br />
(+) -860,756 1,395,111 534,355 -1,313,199 1,656,539 343,340<br />
Prod as % of<br />
Req. 86.6% 135.9% 105.2% 80.0% 141.4% 105%<br />
However, when the two food types are considered alone it will be seen that cereals deficit was<br />
down by 3.6% in 2007/08 <strong>and</strong> by a whole 10% in 2008/09. On the contrary non-cereals show<br />
surplus in both years; about 3 % <strong>and</strong> over 40%, respectively in 2007/08 <strong>and</strong> 2008/09.<br />
9
In reality the country is yet to reach national food security level for many reasons, <strong>and</strong> this is<br />
why imports of some food crops, including maize, wheat <strong>and</strong> rice has been increasing quite<br />
substantially over the past three years. For instance maize imports from the level of about 6,600<br />
tons in 2007, increased by almost 200 % in 2008 (reaching 12,974 tons). Wheat imports which<br />
were about 640,000 tonnes in 2006, jumped to 813,000 tons in 2007 (an increase of 27%); though<br />
this decreases by 40% in 2008. Rice imports which were about 45,000 tonnes in 2007, shot to<br />
64,000 tons in 2008 (an increase of 42%). Besides, there are districts in central zone of the country<br />
<strong>and</strong> the southern belt of the northern zone that find themselves in food shortage almost every<br />
year, <strong>and</strong> invariably call for emergency food assistance; main reason being little or no crop<br />
harvest realised due largely to shortage of rainfall; though other factor as not planting the right<br />
crop of the area, <strong>and</strong> on time, might also be a contributing factor.<br />
Further, eating habits are hard to change; people in poor rainfall areas almost continually insist<br />
in growing maize (even though in their own minds they know the chances of reaping any<br />
harvest is one in ten) as this is their traditional staple. They should concentrate on growing<br />
cassava, for instance, as this is hardy, grows even under poor rainfall, poor soils <strong>and</strong> can be<br />
made into several food types; <strong>and</strong> also can be sold to earn money <strong>and</strong> even processed to add<br />
value. Therefore, in these poor rainfall areas there is need to encourage growing <strong>and</strong> eating of<br />
non-cereals, which as we have seen above are even currently in surplus, though the surplus<br />
might be not so high due to the fact that some of these like bananas are <strong>per</strong>ishable <strong>and</strong> some are<br />
down-right loss; similarly, some part of grain is lost in storage due to poor methods used.<br />
At the district level, it was found that in the southern regions (<strong>and</strong> Morogoro Region -<br />
Mvomero <strong>and</strong> Kilombero districts) where rainfall is dependable year in year out, food<br />
production was quite stable <strong>and</strong> no food shortages were reported. However, in the scarce<br />
rainfall areas such as the southern belt of northern zone (Mwanga, Same <strong>and</strong> parts of Lower<br />
Moshi Rural - not at the irrigation schemes) food shortages were reported <strong>and</strong> were quite<br />
evident as was observed by the consultant in some of the villages visited) <strong>and</strong> the Central zone<br />
(Manyara, Dodoma, Singida <strong>and</strong> Shinyanga regions).<br />
National food security is thus still far off. Nevertheless, there are already signs that efforts are<br />
being put in place towards achievement of food security. It will be seen in the main text that the<br />
government is increasing subsidy on inputs, especially for fertilizer for use by small scale<br />
farmers in food production, especially in the more rainfall favourable areas. Thus MAFC<br />
development budget in 2009/10 was increased by over 360% when compared to 2008/09<br />
budget; <strong>and</strong> total MAFC budget increased by 55% in 2009/10 in comparison to 2009/09. The<br />
aim was to increase resources for, especially food production; increasing input subsidy<br />
(fertilizer, pesticides <strong>and</strong> equipment).<br />
Similarly MLDF’s 2009/10 budget; partly in order also to contribute to food security <strong>and</strong><br />
reduction of income poverty - to increase milk <strong>and</strong> meat production, which are both important<br />
foods too. The substantial increase in the MWI budget has already been mentioned above. The<br />
<strong>per</strong>formance/ trend in input supply <strong>and</strong> mechanization have adequately been discussed in the<br />
main text. Inputs (fertilizer, seed <strong>and</strong> agro-chemicals) to small scale food producers are being<br />
subsidised, but though the funding amount has been increasing over the past years (since the<br />
start of the subsidy programme in 2004), the subsidized input amount is still too little<br />
compared to need; <strong>and</strong> even then this is targeted to only a few food production promising<br />
regions; <strong>and</strong> at one acre-pack level. In the area of mechanization the Government has just<br />
10
started off by providing subsidy for power tillers, mainly. However, a wide range of farm<br />
machinery <strong>and</strong> equipment are needed, as will be seen in the main text.<br />
Livestock Sub-sector:<br />
Numbers for the main livestock namely, cattle, goats <strong>and</strong> sheep have remained stable, with very<br />
minimum increase over the past three years. Cattle which were 18.65 million in 2006/07 have<br />
been increasing at 0.8 % annually, reaching 19.1 million in 2008/09. Goats, which were 13.3<br />
million in 2006/09 reached 13,6 million in 2008/09 (an annual increase of 0.75%). Poultry <strong>and</strong><br />
pigs have increased faster in number; starting off with 41.5 million <strong>and</strong> 1.3 million, reached<br />
respective levels of 56 million <strong>and</strong> 1.5 million in 2008/09 (<strong>and</strong> annual increase of 12% <strong>and</strong> 5%,<br />
respectively).<br />
However, the sector has made commendable improvement in the production of some of the<br />
livestock products over the past three years. One product is milk, which in the last two years<br />
increased from 1.5 million litres in 2007/08 to 1.6 litres in 2008/09 ( an increase of about 7%).<br />
The traditional herd contributed almost twice the amount produced by the improved herd,<br />
though <strong>per</strong>cent increase in milk production was much higher almost 14%) in 2008/09 as against<br />
3.3 % for the traditional herd.<br />
Meat production <strong>per</strong>formance over the past three years has been promising. Beef production<br />
ex<strong>per</strong>ienced an annual increase of about 15% over the <strong>per</strong>iod, though the increase decreased<br />
from 21% in 2007/08 to 2.8% in 2008/09. Lamb/mutton, pork <strong>and</strong> chicken registered annual<br />
increase of 2.4%, 4% <strong>and</strong> 0.4%, respectively.<br />
Cattle fattening is another area where the sub-sector is inching towards some success. Thus<br />
some 62,000 cattle were fattened in 2008/09 as against only 29,600 in 2007/08 (an increase of 109<br />
%). This enterprise was undertaken at both large scale (e.g. at Mtibwa Feed lot) <strong>and</strong> small scale<br />
level (such as those in regions of Mara, Mwanza <strong>and</strong> Shinyanga - under the Farmers Field<br />
Schools programme).<br />
Marketing<br />
- Crop <strong>and</strong> Livestock Products<br />
In the <strong>per</strong>iod 2006/09 the crop sub-sector did increase the value of the main traditional export<br />
crops. Cotton exports increased from US$ 66.4 mil in 2006 to US $ 115.0 mil in 2008 (an annual<br />
increase of over 36%). Tobacco exports increased from US$ 65.2 mil in 2006 to US $ 106.1 in 2008<br />
(an average annual increase of 31%). Coffee increased similarly; from US $ 61.4 in 2006 to US$<br />
97.5, an average annual increase of 29%. Raw cashew nuts exports, after a drop in 2007, it<br />
bounced back in 2008; from US$ 25.6 mil on 2007, it increased to US $ 40.2 mil in 2008, an<br />
increase of 54%. Tea is another cash crop that registered increase over 2007 to 2008 <strong>per</strong>iod, see<br />
Figure 3.1.1 below.<br />
11
Figure P 3.1.1: Tanzania Cash Crops Performance 2005 -2009<br />
Figure L 4.2.1 Annual Value of Hides <strong>and</strong> Skins Export: 2005/06 to<br />
2008/09 (Tshs ‘000)<br />
Value of Livestock products exports, in particular hides <strong>and</strong> skins, after a rise from 2005/06<br />
that peaked in 2007/08 (reaching over Tshs 20 billion), there was sharp decline in 2008/09 to<br />
just above Tshs 10 billion.<br />
Agro-processing<br />
In the area of agro-processing as a whole much remains to be done; particularly so for small<br />
scale processing to add value.<br />
There has been some attempt in small scale processing, for instance for cassava in the Coast<br />
Region; processing of fruits, for instance in producing banana wine done in Kilimanjaro <strong>and</strong><br />
Kigoma Regions: small scale/ group processing of milk (like the Tanga Fresh long life milk);<br />
soybean processing to produce various products, including milk <strong>and</strong> sausages (in Hai District);<br />
small scale processing of cashew nuts in Coast Regions; as well as small scale oil processing in<br />
various places, including Singida <strong>and</strong> Arusha Regions. On the other h<strong>and</strong> small scale grain<br />
milling machines for maize <strong>and</strong> paddy (to produce rice) are well spread throughout the<br />
country; even in the district visited this was observed. These small machines also mill millet for<br />
local brewing. There are also few that mill sorghum. There are in addition, a number of small<br />
scale animal feed processing plants in places such as Arusha, Moshi, Tanga <strong>and</strong> Dar es Salaam.<br />
There are also large scale grain milling machines for wheat, maize <strong>and</strong> paddy/rice, mostly in<br />
major urban areas. Otherwise much of on-going agro-processing is being done under large scale<br />
processing.<br />
Large scale seed cotton ginning / processing: Private sector investment in (large scale) seed<br />
cotton ginning/ processing since 2001 revolutionized the cotton ginning industry. Gone more or<br />
less is the agony of slow ginning which saw a year’s seed cotton ginning, spilling over up to<br />
three years even, with consequent loss in quality or total loss by the buyers; under then public<br />
administered coo<strong>per</strong>ative unions, which totally failed in this business, <strong>and</strong> even went bankrupt<br />
almost, only to have their debt (to banks <strong>and</strong> others) taken over by the Government. Even after<br />
this big assistance they seem not to have been able to run profitable business in this field. The<br />
unions that still have ginneries, <strong>and</strong> these are the slow roller gins, have hired them out to<br />
private entrepreneurs. The ginning industry can now gin within a fairly short <strong>per</strong>iod all the<br />
seed cotton produced each year. There are some 20 saw gins in the WCGA, <strong>and</strong> 50% of these<br />
were built in the <strong>per</strong>iod 2006 to 2008. All together there are 65 ginneries in the WCGA, most of<br />
which (54) are in Shinyanga <strong>and</strong> Mwanza regions. The rest (11) are in Mara, Tabora <strong>and</strong> Kagera<br />
<strong>and</strong> Singida regions.<br />
The private sector investors brought into the industry fast saw ginning technology, machines<br />
that are mounted with gins that can process seed cotton, turning out 40 bales lint, (each 200 kg)<br />
<strong>per</strong> 8 hours or 120 bales <strong>per</strong> 3 shifts (24 hours); compare this with the old technology of using<br />
12
oller gins that can only turn out 4.5 bales (each 1821 kgs) in 8 hours, or 13.5 bales <strong>per</strong> 3 shifts<br />
(24 hours)!. Besides in these ginneries, the investors are local people either wholly or in<br />
partnership. These private sector people have enabled the spreading of ginneries to the entire<br />
WCGA. Producers are now within short distance of their nearest ginnery; no need to travel long<br />
distances, using a lot of time <strong>and</strong> money to take seed-cotton to market. Furthermore, these new<br />
ginning plants have oil processing units attached to them; they thus can produce lint <strong>and</strong><br />
cooking oil (cotton seed oil) alternately.<br />
Overall the ginning industry is a success story for local industrialization, producing semifinished<br />
products. However, the industrialists, need to up-scale their industrialization <strong>and</strong><br />
move also into production of textile material to add value to Tanzania lint cotton instead of<br />
allowing nearly all to be exported raw; about 75 to 80% of Tanzania cotton is exported raw. Yet<br />
the market opportunity for products like cotton yarn, blended yarn, grey <strong>and</strong> finished fabrics,<br />
are said to be still in high dem<strong>and</strong> locally, regionally <strong>and</strong> even on the export market. One local<br />
firm which took over a privatised public textile mill in 2003, <strong>and</strong> highly modernised it (to be the<br />
largest textile mill <strong>and</strong> one of the most modern in the whole of East Africa) is now turning out<br />
yearly, some 4,000 tons of cotton <strong>and</strong> blended yarns <strong>and</strong> 16 million metres of grey <strong>and</strong> finished<br />
fabrics, <strong>and</strong> most of this sold on the domestic market; while some of the grey fabrics <strong>and</strong> cotton<br />
yarn have found a growing markets in EU <strong>and</strong> USA. [Internet]<br />
A rather embarrassing large scale processing venture was in privatization of 12 large scale<br />
cashew nut processing plants in years 2004 to 2006. Only a third of these are said to be working.<br />
The rest have remained dormant since they were privatised; some of these are unlikely to come<br />
to production at all.<br />
Those in o<strong>per</strong>ation <strong>and</strong> those built privately (for instance Olam), are doing well <strong>and</strong> are<br />
exporting almost all the kernels they produce. However, they are yet to diversify further into<br />
producing other exportable products like cashew nut shell liquid <strong>and</strong> other products like wine,<br />
leather tanning material, <strong>and</strong> so on. Potential for cashew nut processing is still vast, as nearly<br />
90% is exported raw, <strong>and</strong> field production is increasing.<br />
Further on agro-processing (including for coffee <strong>and</strong> sisal) is provided in the main text.<br />
Success stories from the Sector<br />
In the course of the study the consultant observed a number of <strong>per</strong>formance successes by the<br />
sector. A few of these are briefly discussed below.<br />
i) Activities by the Moshi based KILI-CAFÉ, a non-governmental organisation, in<br />
promoting production <strong>and</strong> marketing of speciality (quality ) coffee, especially for the export<br />
market<br />
KILI-CAFÉ helped in getting established the ‘Association of Speciality Coffee Growers’ in all<br />
the areas that had been under small scale coffee production - mainly Northern Zone, Mbinga<br />
District <strong>and</strong> Mbeya Region.<br />
Through the services provided by KILI-CAFÉ, that include training on quality coffee<br />
production; providing the association quality processing units <strong>and</strong> searching for export<br />
markets, the association’s sales grew from a low of 569,859 kgs in 2002/03 (with no exports<br />
13
made by the association - only sold at local auction market), to 4,132,693kg in 2008/09, an<br />
increase of 625% (or average annual increase of over 100%). Out of this 2008/09 volume sales,<br />
1,112,859 kg (or 27%) was done on the export market, <strong>and</strong> the rest at local auctions. Total<br />
Revenue received from the association’s coffee sales jumped from US $ 584,934 in 2002/03 to US<br />
$ 6,804,085, an average annual increase of about 177%.<br />
On the export market, price has been much higher <strong>and</strong> has been increasing steadily. Thus in<br />
2005/06 the price was Tshs 2,896 <strong>per</strong> kg (up from Tshs 1,818 <strong>per</strong> kg in 2004/05 - an increase<br />
of 59%). In 2009/10 the price has been highest reaching average price of Tshs 4,932 <strong>per</strong> kg (an<br />
increase of 171% over the 2004/05 price). Figure KC 1, is a graphical representation of the<br />
AKSCG’s coffee sales trend both in the local auctions <strong>and</strong> the export market. Figure KC1.2<br />
shows the green coffee value chain from farmer to the export market; farmer got 70% of export<br />
price in 2006/07 sales.<br />
The success of KILI-CAFÉ’s working with the small scale farmers association is recognised here as<br />
follows:<br />
First it shows that if small scale farmers are pro<strong>per</strong>ly organised <strong>and</strong> then provided appropriate support<br />
can achieve substantial increase in incomes over quite short <strong>per</strong>iod, thereby reducing income poverty, <strong>and</strong><br />
even reducing food insecurity.<br />
Second, it shows that it is still possible to continue increasing small scale farmers’ crop sales value if they<br />
are provided strong, innovative market support in terms of market search.<br />
Third, appropriate support, can even bring up an almost dying export crop to attractive income heights,<br />
just as KILI –CAFÉ has done.<br />
Fourth, small scale farmers associations need steady continued, innovative support in capacity building<br />
for quite a <strong>per</strong>iod, in order to really succeed. KILI-CAFÉ, through donor support, has helped this<br />
association to really come up.<br />
Figure KC1.1Coffee sales volume (Kgs) <strong>and</strong> value (US$) by Association of Kilimanjaro Speciality Coffee Growers: – 2004/05 to 2008/09<br />
[By Courtesy of KILI_CAFE]<br />
14
ii) Irrigation schemes: Kwemaz<strong>and</strong>u <strong>and</strong> Mombo irrigation schemes:<br />
At Kwemaz<strong>and</strong>u <strong>and</strong> Mombo irrigation schemes (Korogwe District) for the last three years<br />
annual paddy production has been increasing at the rate of 20% <strong>per</strong> annum; <strong>and</strong> this increase<br />
was reported to have improved food security. For example paddy increased from 20 bags <strong>per</strong><br />
year in 2006/07 to 80bags/year in 2008/09 in Mombo Irrigation scheme. While in Kwemaz<strong>and</strong>u<br />
paddy increased from 18 bags <strong>per</strong> year in 2006/07 to 40bags in 2008/09 (Each bag weighs 80kg).<br />
Over the <strong>per</strong>iod the <strong>per</strong>centage of families ex<strong>per</strong>iencing food shortage has decreased from 52.3 <strong>per</strong>cent in<br />
the year 2006/07 down to 18.6 <strong>per</strong>cent in the year 2008/09, likewise households with food surplus<br />
increased from 16.3 <strong>per</strong>cent in the year 2006/07 to 40.9 <strong>per</strong>cent in the year 2008/09. Membership of<br />
WUAs (water users association) in Mombo Irrigation Scheme, increased from 400 (in 2006/07) to over<br />
800. Furthermore farmers downstream formed another association known as Hwazi with approximately<br />
80 members; <strong>and</strong> these are growing vegetables <strong>and</strong> paddy using water draining from the scheme.<br />
iii) KATC farmer <strong>and</strong> field staff participatory training model<br />
KATC II, with support from the Japanese Government, has developed a very elaborate farmer training<br />
model that has become an envy of even neighbouring <strong>and</strong> SADC countries (including Ug<strong>and</strong>a, Kenya,<br />
Malawi <strong>and</strong> Zambia), where several training sessions were conducted by KATC; <strong>and</strong> in some cases these<br />
countries brought in their irrigation staff <strong>and</strong> farmers for residential training at KATC. This irrigation<br />
training model implementation was centred at six selected model irrigation schemes, each representing<br />
one of the country’s irrigation zones. In this model farmers chosen by the model scheme undergo both<br />
residential training (including a short residential training at KATC II) <strong>and</strong> on field training prior to each<br />
stage of production of paddy - from ground preparation to harvesting <strong>and</strong> to farmer field days. The<br />
farmer so trained goes to train his/ her 25 peer farmers prior to each stage of paddy production. The<br />
process of farmer to farmer training can be replicated to other farmers in the scheme <strong>and</strong> even on to other<br />
schemes. KATC staff monitor the trained farmer’s peer training to ensure appropriate practical training is<br />
provided <strong>and</strong> adopted. The KATC trained farmers are called key farmers.<br />
In the <strong>per</strong>iod of November 2001 to September 2006, KATC conducted over 130 training sessions to<br />
participants that clocked over 45,000 participant days (man days). This has contributed greatly to<br />
increased rice yields at the trained farmers’ fields in the schemes, including Mombo, where yields jumped<br />
from average of 3 tons/ ha prior to the training to 5tons ; ha in a space of about 3 years. . In order to<br />
increase the pace of farmer to farmer training KATC has also conducted training courses to four research<br />
stations of Kilosa, Ukiriguru, Igurusi <strong>and</strong> Mlingano to enable them to adopt <strong>and</strong> spread the practice<br />
among farmers, especially those in the immediate domain of the respective research centres. Below are<br />
self-explanatory pictures of KATC’s farmer training activities; <strong>and</strong> farmers’ adopted skills at work. The<br />
KATC training model <strong>and</strong> approach needs to be adopted quickly in almost all paddy production irrigation<br />
schools.<br />
Photos: Self-explanatory pictures of KATC training activities; <strong>and</strong> farmers’ related paddy production activities<br />
(Courtesy of KATC)<br />
15
iv) Milk productions <strong>and</strong> the use of A.I<br />
Milk production from smallholders has increased from less than 2 to 3 litters <strong>per</strong> cow <strong>per</strong> day<br />
from ungraded local cattle up to 16 litters <strong>per</strong> cow after grading to F3. As a result the majority of<br />
livestock kee<strong>per</strong>s in Meru have been encouraged to use A.I. It was also reported that<br />
crossbreeds are fetching good prices between Tshs 800,000 to 1,900,000 <strong>per</strong> in-calf heifer.<br />
Therefore dairy production in the smallholder sector is considerably benefiting small scale<br />
livestock kee<strong>per</strong>s in terms of household income <strong>and</strong> food security. The in-calf heifers from the<br />
district, have been purchased by customers across the whole country.<br />
v: TAHA (Tanzania Horticultural Association)<br />
Tanzania Horticultural Association, established in 2004, with the objective of promoting<br />
horticulture <strong>and</strong> addressing the general <strong>and</strong> specific needs of its members, has so far made<br />
substantial strides. TAHA members exports is estimated to average 9,000 to 10,000 tons <strong>per</strong><br />
year, fetching about Euro 50 million (or about US $ 120 million) yearly. These figures were<br />
expected to double by 2014 as a result of on-going private farm expansion <strong>and</strong> new investments<br />
in the industry. The current main market for the horticultural products is Europe, 75% to 80 %<br />
of fresh flowers finding room in auctions in Holl<strong>and</strong>. According to TAHA efforts are on-going<br />
to capture markets in other countries, including USA, Japan <strong>and</strong> the Middle East. Recently<br />
TAHA has been involved in strong products promotional activities, including Trade Fair<br />
participations & talks in the Middle East, specifically in the IPM Dubai International Show,<br />
where TAHA exhibited flowers (roses <strong>and</strong> other cuttings), fruits <strong>and</strong> vegetables (avocado,<br />
carrots, onions, chillies, green pep<strong>per</strong>) <strong>and</strong> spice; with financial support for TAHA’s<br />
participation coming from Tanzania Government (through MITM), <strong>and</strong> the USAID/TAP<br />
project. Some of the TAHA members provided free samples for the exhibition.<br />
Previous to the Dubai event (specifically in 2007), TAHA had exhibited in (what was viewed as the<br />
biggest horticultural show in the world), the ‘International Hortifair’ in Rai, Amsterdam, where TAHA<br />
won a bronze medal for the best st<strong>and</strong> design <strong>and</strong> products presentation - there were over 1,000<br />
exhibitors from all over the world.<br />
TAHA members are reported to have been employing annually, over 10,000 <strong>per</strong>manent workers<br />
<strong>and</strong> many more casual workers. These numbers are expected to double by 2010. Its current<br />
(2009) membership is 82, drawn from all over Tanzania, <strong>and</strong> membership drive is continuing.<br />
Among its current membership are 14 exporters <strong>and</strong> 45 member companies, whose horticulture<br />
exports include fresh cut-flowers, fruits, vegetables, seeds <strong>and</strong> flower cuttings. It has also<br />
associate members including small growers/ grassroots associations <strong>and</strong> consultancy firms.<br />
16
Other achievements of TAHA, apart from promoting the industry internationally <strong>and</strong> locally,<br />
include formation of HODECT (Horticultural Development Council of Tanzania), Public<br />
Private Platform (a policy body) that is seeking to fast truck horticultural issues on social –<br />
economic growth.<br />
Cut flowers are a particularly high paying export crop. Data obtained from Internet <strong>and</strong> MAFC,<br />
shows that 330 million flower stems (90% roses) are exported each year from Kilimanjaro<br />
Irrigation <strong>and</strong> Technical Unit Zone, bringing in some 16.16 billion to the farmers on their total of<br />
80 ha. This net return translates to Tshs 202 million <strong>per</strong> ha (cf; maize, which brings in only about<br />
Tshs 300,000 in same areas). [Source: Internet, MAFC – Statistics & ITUD; NIMP, field data].<br />
However, the Global Economic Meltdown is likely reversing the fortunes of TAHA. From October<br />
2008, vegetable <strong>and</strong> flower prices on average have declined by 30 to 50% as compared to same <strong>per</strong>iod in<br />
2007. Some flower types <strong>and</strong> lengths lost market all together, from October 2008.<br />
Main Weakness areas in the sector<br />
These are briefly:<br />
• Very Low level of irrigated l<strong>and</strong> area compared to the potential l<strong>and</strong> area available.<br />
• Lack of interest by farmers to contribute to the o<strong>per</strong>ation <strong>and</strong> maintenance of their<br />
schemes<br />
• Inadequate marketing infrastructure for crops <strong>and</strong> livestock<br />
• Low level of agro-processing capacity<br />
• In adequate quality of agricultural products at both farm level <strong>and</strong> at export level<br />
• Inadequate capacity in extension services in terms of numbers skills <strong>and</strong> facilities<br />
• In adequate skills by small scale farmers (including livestock kee<strong>per</strong>s) <strong>and</strong> small scale<br />
traders<br />
• Very low proportion of small scale farmers using improved crop varieties / improved<br />
livestock breeds<br />
• Lack of access to worthy agricultural tailored credit<br />
• Weak leadership in farmer organizations<br />
• Inadequate input supplies to farmers<br />
• L<strong>and</strong> degradation due to poor l<strong>and</strong> use methods - inadequate soil conservation<br />
measures on crop l<strong>and</strong>s <strong>and</strong> due to overgrazing by livestock kee<strong>per</strong>s.<br />
• Poor farm tools/equipments<br />
Performance of DADPs in formulation planning <strong>and</strong> implantation of projects<br />
Data from both secondary <strong>and</strong> primary sources point to improved <strong>per</strong>formance generally as<br />
compared to previous years, though in many district there is still a lot to be done in order to<br />
improve on certain aspects of DADPs, for instance in village projects phasing. On<br />
implementation, though there has been some progress, still more need to be done to improve<br />
<strong>per</strong>formance; this include capacity building <strong>and</strong> recruiting more staff to specific departments,<br />
especially irrigation technicians <strong>and</strong> extension staff; providing more funds for facilities;<br />
speeding up construction of irrigation infrastructures, <strong>and</strong> especially speeding up release of<br />
disbursements. In the previous year 65% of ASDP basket funds were returned to the holding<br />
entity unspent, largely as result of late disbursement, though there were also delays by some<br />
districts in effecting goods <strong>and</strong> services procurement.<br />
17
Effectiveness of the ASDP shortlist indicators ; <strong>and</strong> also relevance of wealth determination<br />
indicators.<br />
Assessment on both these indicated that they are not fully adequate to be used for undertaking<br />
to the tasks intended for. Both are discussed in detail in the main text.<br />
Status of implementation of recommendations made in the 2008/09 ASR/PER<br />
These are discussed in details in the main text on the action taken in each of the issues that had<br />
been raised in the 2008 ASR/ PER 2008/09. Actions were undertaken on climate change, staff<br />
training <strong>and</strong> recruitment <strong>and</strong> so on. [see section 1.12 of main text].<br />
Recommendations <strong>and</strong> way forward<br />
Overall recommendations on what needs to be done by all parties in order to improve<br />
<strong>per</strong>formance each of the sub-sectors are provided under section 4 of the main text. However, at<br />
strategic areas of the study some recommendations are made there <strong>and</strong> then in order to enable<br />
the reader to relate quickly the results of the particular analysis <strong>and</strong> what needs to be done to<br />
rectify the situation.<br />
Synopsis of Way forward<br />
As <strong>per</strong> the Stakeholder workshop of 6 th December 2009, the way forward for the sector is in<br />
synopsis as follows:<br />
1. Irrigation development (more resources for infrastructure development, intensification).<br />
(including human resources)<br />
2. Marketing improvement (for crops, livestock, fisheries)<br />
3. Inputs <strong>and</strong> farm equipment subsidy in crops, livestock <strong>and</strong> fisheries<br />
4. Service delivery (research, training & extension, mechanization)<br />
5. Promotion of non-traditional products<br />
6. Processing for value-addition including non-traditional products (crops, livestock,<br />
fisheries)<br />
7. Pastoral development (improving rangel<strong>and</strong>s, health <strong>and</strong> water)<br />
8. L<strong>and</strong>-use planning <strong>and</strong> management<br />
9. Human resource development<br />
10. Strengthening farmers organizations<br />
11. Strengthening investment planning at local level<br />
Fisheries resources development <strong>and</strong> management<br />
Below is a template that summarises the sector problems <strong>and</strong> provides for way forward for<br />
improving the sector as a whole in more details.<br />
18
WAY FORWARD FOR IMPROVING THE AGRICULTURAL SECTOR<br />
Livestock Sub-Sector<br />
S/N ISSUES SUGGESTED SOLUTIONS<br />
1 1.1 on Performance:<br />
1.2<br />
‣ Free grazing of livestock is both<br />
destructive (to the environment <strong>and</strong><br />
field crops) <strong>and</strong> is only of little<br />
productivity/ economic value; <strong>and</strong><br />
breeds endless conflict with crop<br />
farmers<br />
• Demarcation of l<strong>and</strong> areas specific for free grazing livestock in regions which traditionally have<br />
had large numbers of livestock; after sensitizing the entire community on need to do such<br />
demarcation<br />
• Demarcated free grazing livestock areas:<br />
- Should be fully fenced with low cost fencing materials (even thorny bushes)<br />
- Should be provided with necessary infrastructural facilities (including; modern, protected<br />
water dams/ charcos with reticulation system to water cattle outside the dam)<br />
- Should be provided with adequate, modern dipping facilities<br />
- Should have modern well organized livestock market at convenient place<br />
- There should have animal health facilities<br />
- There should be modern slaughter facilities<br />
• Movement of livestock out of demarcated free grazing l<strong>and</strong> must not be on hoof<br />
• Movement of livestock out or into specific livestock market should be not be on hoof<br />
• Free grazing livestock enterprise owners/ o<strong>per</strong>ators be provided with training on modern<br />
livestock management:<br />
- Modern livestock husb<strong>and</strong>ry<br />
- Animal health<br />
- Pasture production<br />
- Fodder production <strong>and</strong> preservation <strong>and</strong> utilization in a practical manner<br />
- Livestock products processing to add value<br />
- Livestock fattening<br />
19
Livestock Sub-Sector (continued)<br />
S/N ISSUES SUGGESTED SOLUTIONS<br />
2. 2. 1 Overgrazing results in destruction of the<br />
pasture l<strong>and</strong> <strong>and</strong> reduce productivity<br />
• Total number of livestock must not exceed carrying capacity of the l<strong>and</strong>, available water <strong>and</strong> other<br />
facilities; any time this point is reached the excess must be sold/ culled<br />
[for instance in 2006 250,900 cattle died<br />
due inadequate supply of pasture <strong>and</strong><br />
water]<br />
• Free grazing Livestock farmers be encouraged to undertake livestock fattening, to increase value<br />
20
Irrigation <strong>and</strong> Crop Sub-Sectors<br />
PROBLEM/ ISSUE<br />
DETERMINED<br />
1. Low crop yields<br />
under rain-fed<br />
production<br />
CAUSE<br />
1.1) Insufficient<br />
<strong>and</strong>/ or poorly<br />
distributed rains<br />
during growing<br />
season<br />
BROAD ACTION(S)<br />
TO TAKE<br />
1.1.1) Convert more<br />
of the rain-fed<br />
production area into<br />
irrigated agriculture<br />
SPECIFIC PRACTICAL ACTION TO TAKE<br />
i) Provide training on practical, efficient rain water harvesting techniques; first to agricultural/ irrigation extension staff; <strong>and</strong><br />
second to farmers (these latter best in Farmer Field Schools)<br />
ii) Form/ strengthen (train) Participatory Farmer Groups (PFG) & increase <strong>and</strong> strengthen Farmer Field Schools (FFS)<br />
iii)Mount vigorous rainwater harvesting campaign to farmers in order for them to construct in–expensive but effective<br />
rainwater collection structures (e.g. several dams ); <strong>and</strong> distribution channels<br />
iv) Individual Farmer groups to use their respective stored water for supplementary irrigation as needed,<br />
1.2) Low level<br />
of inputs use/<br />
application on<br />
crops<br />
1.2.1) Facilitate<br />
farmers to use/<br />
apply more<br />
inorganic fertilizer<br />
on crops; as <strong>per</strong><br />
recommendations<br />
i) Revisit recommendations on optimum fertilizer requirement for particular crop <strong>and</strong> area – both for inorganic <strong>and</strong> organic<br />
(especially compost) or a mixture of the two<br />
ii) Mount vigorous annual campaigns <strong>and</strong> training to farmers <strong>and</strong> extension staff on appropriate <strong>and</strong> practical application of<br />
inorganic fertilizers.<br />
iii) Increase substantially the amount (not just funds) of subsidized fertilizer destined for the small farmer <strong>and</strong> have in place<br />
appropriate mechanism to ensure the subsidized fertilizer actually reach the target farmers.<br />
iv) Empower major, ex<strong>per</strong>ienced farmer organizations to import own fertilizer, if this would result in chea<strong>per</strong> fertilizer to<br />
their members <strong>and</strong> other farmers. [Input fund could be used]<br />
v)Support production of most of the required fertilizer locally (in chosen country site)– subsidize entrepreneurs producing<br />
fertilizer locally.(Minjingu, for instance;. <strong>and</strong> any ones coming on board).<br />
1.2.2. Facilitate<br />
farmers to use/<br />
apply more organic<br />
fertilizer on crops;<br />
as <strong>per</strong><br />
recommendations<br />
vi) Institute/ strengthen mechanism to prevent overly high unfair local prices of fuel <strong>and</strong> energy as a whole..<br />
i) Revisit recommendations on optimum fertilizer requirement for particular crop <strong>and</strong> area – both for organic (especially<br />
compost) <strong>and</strong> inorganic or a mixture of the two.<br />
ii) Mount vigorous annual campaigns <strong>and</strong> training to farmers <strong>and</strong> extension staff on appropriate <strong>and</strong> practical application of<br />
organic fertilizers.<br />
iii) Mount campaigns <strong>and</strong> training to farmers <strong>and</strong> extension staff on appropriate <strong>and</strong> practical way of making <strong>and</strong> applying<br />
compost; <strong>and</strong> on application of farmyard manure (if available); also on use of green manures (Marejea <strong>and</strong> so on).<br />
Irrigation <strong>and</strong> Crop Sub-Sectors (continued)<br />
PROBLEM/ ISSUE CAUSE BROAD ACTION(S) SPECIFIC PRACTICAL ACTION TO TAKE<br />
21
DETERMINED<br />
TO TAKE<br />
1.2.3) Facilitate more<br />
farmers to use<br />
improved seed <strong>and</strong> at<br />
recommended levels.<br />
i) Revisit recommendations on optimum improved seed requirement for particular crop <strong>and</strong> area .<br />
ii) Mount vigorous annual campaigns <strong>and</strong> training to farmers <strong>and</strong> extension staff on appropriate <strong>and</strong><br />
practical use of improved seed<br />
iii) Increase substantially the amount (not just funds) of subsidized seed destined for the small farmer <strong>and</strong><br />
have in place appropriate mechanism to ensure the subsidized seed actually reach the target farmers<br />
iv) Support production of most of the required seed locally – subsidize entrepreneurs producing improved<br />
seed locally.<br />
1.2.4) Facilitate more<br />
farmers to use<br />
appropriate pesticides;<br />
<strong>and</strong> at recommended<br />
levels.<br />
i) Revisit recommendations on optimum pesticides requirement for particular crop.<br />
ii) Mount vigorous annual campaigns <strong>and</strong> training to farmers <strong>and</strong> extension staff on appropriate <strong>and</strong><br />
practical application of pesticides..<br />
iii) Provide subsidized pesticides destined for the small farmer <strong>and</strong> have in place appropriate mechanism to<br />
ensure the subsidized pesticides actually reach the target farmers.<br />
iv) Support development <strong>and</strong> promotion of biological pest control<br />
v) Support development <strong>and</strong> promotion of integrated pest management<br />
vi) Support production of most of the required pesticides locally (at appropriate site) – subsidize<br />
entrepreneurs attempting to produce locally; but at appropriate place<br />
22
Irrigation <strong>and</strong> Crop Sub-Sectors (continued)<br />
PROBLEM/<br />
ISSUE<br />
DETERMINED<br />
CAUSE<br />
1.3: Use of poor,<br />
inefficient, burdensome<br />
farming equipment/<br />
tools & facilities<br />
BROAD ACTION(S)<br />
TO TAKE<br />
1.3.1) Facilitate farmers<br />
to use appropriate/<br />
modern cultivation,<br />
planting, weeding,<br />
harvesting, h<strong>and</strong>ling <strong>and</strong><br />
storage tools/ equipment/<br />
facilities; (as <strong>per</strong><br />
economic<br />
recommendations)<br />
SPECIFIC PRACTICAL ACTION TO TAKE<br />
i) Re-activate the agricultural machinery, tools, <strong>and</strong> equipment testing units (such as the CAMATEC of Arusha).<br />
ii) The testing units to make economically viable recommendations on type of machinery/ tools/ equipment to use for which<br />
activity <strong>and</strong> at what environmental conditions<br />
ii) Mount vigorous annual campaigns <strong>and</strong> training to farmers <strong>and</strong> extension staff on appropriate <strong>and</strong> practical use of<br />
recommended farming machinery/ equipment/ tools<br />
iii) Provide attractive incentives for importation (especially for those not locally manufactured) <strong>and</strong> distribution of appropriate<br />
farming machinery/ equipment/ tools;<br />
iv) The Testing Units in collaboration with stakeholders (Tanzania Bureau of St<strong>and</strong>ards, DSM University College of<br />
Engineering, Faculty of Agricultural Engineering of SUA, TRA, <strong>and</strong> so on) to ensure only quality agricultural machinery/<br />
equipment/ tools enter the country.<br />
v) Support production of most of the required farming machinery/ equipment/tools locally – subsidize entrepreneurs attempting<br />
to produce locally <strong>and</strong> efficiently; <strong>and</strong> <strong>per</strong> recommended st<strong>and</strong>ards<br />
vi) Promote establishment of reliable, efficient agricultural machinery/ equipment repair services<br />
vii) Exp<strong>and</strong> village / ward based crop produce improved warehousing / storage; the stores can also be used for ‘warehousing<br />
receipt’ credit system<br />
viii) Persuade banks/ financial institutions to provide farming machinery/ equipment to farmer / farmer groups<br />
1.4: Depressed crop prices<br />
received by farmers<br />
(farm-gate prices) –<br />
farmers not encouraged to<br />
produce more<br />
1.4.1 Inadequate<br />
marketing infrastructures<br />
i) Provide maintenance to rural roads leading to market on a sustainable basis; to reduce costs charged by transporters; <strong>and</strong> in<br />
turn charges paid by traders for transport to market outlets in urban centres <strong>and</strong> elsewhere; this in turn enabling trader to pay<br />
farmer better farm gate prices. Good roads also attract more traders; hence competition, which push up farmer’s produce prices.<br />
ii) Promote setting up of village/ ward level produce collection centres to attract more traders to come to purchase farm produce,<br />
thereby creating competition which normally results in better prices to the seller (farmer).<br />
iii) Set up modern marketing centres with pro<strong>per</strong> structures (modern buildings, complete with all necessary facilities); sufficient<br />
parking area; adequate storage area; security services; fully fenced; <strong>and</strong> so on. This will attract a lot more produce buyers <strong>and</strong><br />
again create competition.<br />
1.4.2 Inadequate<br />
marketing systems<br />
i) MITM (in collaboration with the country’s trade centres <strong>and</strong> trade attaches abroad) should mount vigorous campaign,<br />
meanwhile, to secure more lucrative markets for farmers’ produce; <strong>and</strong> inform the farming community the types of produce in<br />
dem<strong>and</strong> in the various markets; it could emulate the MNRT, which has been mounting vigorous campaign to get more tourists<br />
into Tanzania.<br />
ii) Strengthen marketing coo<strong>per</strong>atives (through training) in order to increase efficiency.<br />
1.4.3. Burdensome<br />
deductions/ taxes to small<br />
farmer produce<br />
iii) Build strong marketing information systems to enable farmers know the market situations in various places/ centres,<br />
domestically <strong>and</strong> internationally.<br />
i) Investigate deductions made to out-growers of sugarcane <strong>and</strong> other crops with a view to rectify.<br />
ii) Institute a legislation to put on-hold all taxes on small farmer produce for (say) 10 years<br />
23
Irrigation <strong>and</strong> Crop Sub-Sectors (continued)<br />
1.5 Little or non-addition<br />
of value to raw crop by<br />
producers, contribute to<br />
low incomes to farmers<br />
1.5.1 Producers have hardly<br />
been empowered as groups or<br />
individual in the art of agroprocessing<br />
i) Organize farmers coo<strong>per</strong>atives/ groups to enable them process some of their produce (especially<br />
vegetables <strong>and</strong> fruits, substantial portion of which is left to rot yearly – fruits like bananas, oranges,<br />
tangerines, limes, mangoes; vegetables like onions, tomatoes, cabbages, <strong>and</strong> so on)..<br />
(The same can be urged for other crops; paddy is sold without even processing it into rice; <strong>and</strong> even when done not<br />
graded <strong>and</strong> packed into attractive, convenient packaging. Maize too is sold by farmers ungraded even. Cotton, as well,<br />
farmers cannot even convert some of it into simple commodities like hygienic products, that could add value - for almost<br />
100 years the farmers <strong>and</strong> their coo<strong>per</strong>atives have only been selling raw cotton; no effort made to empower them to<br />
venture into production of thread even. The same thing for coffee; most has been sold as raw crop (parchment coffee) for<br />
over 100 years - no effort even to add value through roasting! Cashew-nuts too; mostly exported raw for years!<br />
Government could assist in establishment of cottage industries at farmer level; as has been done in India<br />
for centuries!]<br />
1.6 Bureaucratic huddles<br />
into securing l<strong>and</strong> in<br />
villages for farming<br />
1,6.1: In rural areas L<strong>and</strong><br />
ownership is under village<br />
authority; which in some places is<br />
more interested in hoarding it<br />
rather than allocating out to<br />
would be citizen farmers even.<br />
Getting l<strong>and</strong> allocated to one<br />
coming from outside the village is<br />
a night mare; unless there is<br />
‘some greasing’ – so was said.<br />
i) Let each village with surplus l<strong>and</strong> earmark the area that could be allocated to new farmers as citizens or<br />
foreign investors as appropriate; <strong>and</strong> let this l<strong>and</strong> be known to the respective District Councils – L<strong>and</strong> Bank<br />
ii) Let the councils put up advertisement for interested parties/ individuals to apply for farming on such l<strong>and</strong><br />
ii) District councils be invested with powers to allocate the surplus l<strong>and</strong>, with full knowledge of the<br />
respective village.<br />
iii) There should also be a regulation governing time frame between applications <strong>and</strong> allocation or rejection<br />
of application<br />
iv) Enforce regulation that will ensure reallocation of l<strong>and</strong> that has not been in use continuously for (say) 3<br />
years<br />
v) Enforce regulation that will require redistribution of un-attended/ neglected l<strong>and</strong> (for 3 years)<br />
continuously large tracks of l<strong>and</strong> held by individual/ organization or firm.<br />
iv) Enforce regulation that will forbid using l<strong>and</strong> as security loan for more than 5 years continuously; beyond<br />
that there should be reapplication [this will ease relocation on neglected l<strong>and</strong>; as no banking claims could be<br />
laid on the l<strong>and</strong> after the 5-year <strong>per</strong>iod<br />
24
Irrigation <strong>and</strong> Crop Sub-Sectors (continued)<br />
PROBLEM/<br />
ISSUE<br />
DETERMINED<br />
CAUSE<br />
BROAD<br />
ACTION(S) TO<br />
TAKE<br />
SPECIFIC PRACTICAL ACTION TO TAKE<br />
2 Low crop<br />
yields/ volume in<br />
many irrigation<br />
schemes/ areas<br />
2.1 Inefficient irrigation<br />
water use<br />
2.1.1 Facilitate<br />
establishment of<br />
appropriate water<br />
control facilities/<br />
structures in these<br />
schemes / areas<br />
a) Support implementation of viable expansive small holder irrigation interventions. Thus:<br />
i) Facilitate <strong>and</strong> support rehabilitation <strong>and</strong> expansion of Dakawa Irrigation Scheme; <strong>and</strong> also include<br />
the undeveloped 1,000 ha; plus the adjacent schemes (Mkindo expansion, Diongoya <strong>and</strong> Hembeti).<br />
The entire area offers big opportunity for small/medium scale farmer economic empowerment for very sizable<br />
households.<br />
(This could be one investment package if well cast. It could in addition serve as an intensified field laboratory & demonstration<br />
for irrigated crops (not just rice) research. Farmers should be required to cough a small portion of the investment cost, <strong>and</strong> the<br />
whole investment then treated as a long term loan to them . [At time of field study consultant heard there was a possibility of<br />
funding from the Royal Government of Denmark].<br />
ii) Implement the ‘Lower Moshi Integrated <strong>and</strong> Rural Development Project’ – exp<strong>and</strong>s Lower Moshi irrigated area; brings in<br />
the traditional irrigated areas of M<strong>and</strong>aka, Kaloleni, Soko <strong>and</strong> Miwaleni; <strong>and</strong> also will controls destructive floods; <strong>and</strong> add<br />
power to national electricity grid! Beneficiaries should contribute & all the scheme to be loan to them).<br />
ii) Rehabilitate <strong>and</strong> exp<strong>and</strong> Ruvu Irrigation Scheme to bring in the over 2,400 ha not yet developed.<br />
Here is an opportunity for big rice production (covering some 3,200 ha), with assured market close by (Dar es<br />
Salaam <strong>and</strong> Zanzibar; <strong>and</strong> even to export markets –Comoro, Middle East <strong>and</strong> in SADC countries). It is also a big<br />
employment window for youth, some of whom are now idling in Dar es Salaam. The entire scheme area to be for<br />
small holder production of rice <strong>and</strong> possibly some vegetables. An area should be set aside for research<br />
demonstration <strong>and</strong> training of extension workers <strong>and</strong> farmers. Beneficiary to contribute part of the investment; <strong>and</strong><br />
the entire investment be long term loan the farmers’ association.<br />
iii) Improve irrigation (<strong>and</strong> drainage) facilities in on-going viable smallholder irrigation schemes<br />
2.2 Low level of input use 2.2.1 (As for 1.2.1 to<br />
1.2.4, above)<br />
2.3: Use of poor, inefficient, 2.3.1 (as for 1.3.1<br />
burdensome farming above)<br />
equipment/ tools & facilities<br />
As <strong>per</strong> under 1.21 to 1.2.4 above<br />
As <strong>per</strong> under 1.3.1 above<br />
2<br />
.4: Depressed crop prices<br />
received by farmers (farmgate<br />
prices) – farmers not<br />
encouraged to produce more<br />
2.4.1 (as <strong>per</strong> 1.4.1 to<br />
1.4.3 above)<br />
As <strong>per</strong> under 1.41 to 1.4.3 above<br />
25
Irrigation <strong>and</strong> Crop Sub-Sectors (continued)<br />
PROBLEM/ ISSUE<br />
DETERMINED<br />
CAUSE<br />
2.5 Little or nonaddition<br />
of value to<br />
raw crop by<br />
producers, contribute<br />
to low incomes to<br />
farmers<br />
BROAD ACTION(S)<br />
TO TAKE<br />
2.5.1 (as for 1.5.1<br />
above)<br />
SPECIFIC PRACTICAL ACTION TO TAKE<br />
As <strong>per</strong> under 1.5.1 above<br />
2.6 Bureaucratic<br />
huddles into<br />
securing l<strong>and</strong> in<br />
villages for farming<br />
.2,6.1: (As for 1.6.1<br />
above).<br />
As <strong>per</strong> under 1.6.1 above<br />
3 Overall low rate<br />
of agricultural<br />
production growth<br />
3.1 Proportion of<br />
area under<br />
irrigation too small<br />
(yet irrigated agriculture<br />
has been shown to be not<br />
only reliable but much.<br />
Much more productive<br />
compared to rain-fed)<br />
3.1.1 Facilitate<br />
implementation of the<br />
already casted major<br />
scheme projects (in the<br />
zone) that have been<br />
determined to be viable<br />
Support implementation of viable expansive small holder irrigation interventions. Thus:<br />
i) As already indicated under 2.1.1 above: Facilitate <strong>and</strong> support rehabilitation <strong>and</strong> expansion of Dakawa<br />
Irrigation Scheme; <strong>and</strong> also include the undeveloped 1,000 ha; plus the adjacent schemes (Mkindo expansion,<br />
Diongoya <strong>and</strong> Hembeti).. [the Royal Government of Denmark was reported to being supporting the rehabilitation of<br />
the Dakawa Irrigation Scheme; but it was not clear whether the support would cover the adjacent areas mentioned]<br />
ii) As <strong>per</strong> 2.1.1 above: Implement the ‘Lower Moshi Integrated <strong>and</strong> Rural Development Project’ – exp<strong>and</strong>s<br />
Lower Moshi irrigated area; bring in the traditional irrigated areas of M<strong>and</strong>aka, Kaloleni, Soko <strong>and</strong> Miwaleni.;<br />
<strong>and</strong> the entire investment to be on loan to beneficiaries<br />
ii) As <strong>per</strong> 2.1.1 above: Rehabilitate <strong>and</strong> exp<strong>and</strong> Ruvu Irrigation Scheme to bring in the over 2,400 ha not yet<br />
developed.<br />
iii) Complete establishment of the casted major irrigation schemes of Kisiwani (560 ha in Kilosa), Nyamweke (<br />
300 ha in Rufiji) <strong>and</strong> Yavayava (100 ha in Mkuranga). [Implement these in phases if funds limited]<br />
3.1.2 Facilitate<br />
implementation of<br />
already casted village<br />
level, traditional small<br />
scale irrigation<br />
improvement projects<br />
i) Complete implementation of the village community prioritized small scale irrigation projects started under the PADEP<br />
programme. [Implement these in phases if funds limited]<br />
ii) Complete implementation of the village community prioritized small scale irrigation projects started under the ASDP<br />
funding support programme.[Implement these in phases if funds limited]<br />
iii) Training on irrigation water management <strong>and</strong> pro<strong>per</strong> crop husb<strong>and</strong>ry <strong>and</strong> crop storage, be provided to village/ ward<br />
level extension workers <strong>and</strong> farmers in these village level schemes – the already mainstreamed training programme<br />
developed <strong>and</strong> implemented by KATC II of Moshi would provide a good basis for the training by MAFC/ MIWD/ DFTs.<br />
iv) The “TIP’ modalities of implementing small scale hilly-l<strong>and</strong> irrigation projects would best be followed in these small<br />
scale schemes implementation.<br />
26
Irrigation <strong>and</strong> Crop Sub-Sectors (continued)<br />
PROBLEM/ ISSUE<br />
DETERMINED<br />
CAUSE<br />
BROAD ACTION(S) TO<br />
TAKE<br />
3.1.3 Improve irrigation <strong>and</strong><br />
agricultural practices in<br />
already established irrigation<br />
schemes to ensure all planned<br />
area for irrigation stays under<br />
irrigation; <strong>and</strong> efficiently so.<br />
SPECIFIC PRACTICAL ACTION TO TAKE<br />
i) Ensure adequate availability of irrigation water through tapping of available sources, including rainwater harvest (into storage dams/<br />
facilities)<br />
ii)Strengthen water management <strong>and</strong> control through training to extension/ irrigation staff <strong>and</strong> to respective farmers in these schemes.<br />
iii) Strengthen the respective water users associations through training in organizational management (including coo<strong>per</strong>ation dynamics)<br />
iv) Provide practical (demonstrated) training on best agricultural practices to extension staff <strong>and</strong> farmers<br />
3.1.4 Attract trained<br />
agriculturists (agricultural<br />
graduates <strong>and</strong> diplomats) into<br />
farming as a career (as has<br />
been for a long time in other<br />
countries such as Egypt);<br />
these to be commercial<br />
farmers that will help<br />
stabilize crop production for<br />
food <strong>and</strong> industrial use.<br />
v) The <strong>Ministry</strong> responsible for Local Government to impress on the District Councils to enact a by-law that will require all<br />
improved <strong>and</strong> modern schemes to set up scheme maintenance / rehabilitation fund (to be in special bank account), to<br />
which all the respective scheme farmers would contribute sufficiently, based on their farmed acreages each year; <strong>and</strong> in<br />
this with produce or cash or both. The account status should be fully monitored through receipt of monthly statements<br />
posted on a scheme public board for all scheme farmers to see <strong>and</strong> note. Such fund will ensure good maintenance for the<br />
schemes on a sustainable basis.<br />
i) Earmark big swaths of potentially irrigable l<strong>and</strong> (say 100,000 to 200,000 ha initially) – likely in Morogoro, Coast (Rufiji District),<br />
Lindi <strong>and</strong> Mtwara regions.<br />
ii) Get the area surveyed; <strong>and</strong> in-expensive feasibility study undertaken to determine most profitable enterprise mix; complete with<br />
market channels.<br />
iii) Establish cost effective irrigation infrastructure (for water application <strong>and</strong> drainage) in units of 250 ha (each entrepreneur to o<strong>per</strong>ate<br />
a unit of 250 ha)<br />
iv) Arrange for 5-year initial lease to each would be graduate farmer<br />
v) Meanwhile arrange for practical (on h<strong>and</strong>s) training to would -be farmers through 6 months attachment (working on an example<br />
farm – say a rice farm)<br />
vi) Arrange for bank loans to the selected would- be farmers for purpose of buying necessary farming machinery/ equipment / tools<br />
vii) Source for an on-h<strong>and</strong>s ex<strong>per</strong>ienced farmer (say from Israel, Japan, China, Vietnam, South Africa, Holl<strong>and</strong> or even USA); to<br />
provide technical guidance on smooth implementation of the units projects for (say) one year.<br />
viii) Allocate the farm units to the practically trained graduates, on loan basis for initial <strong>per</strong>iod of five years each<br />
ix) Arrange for tax holiday for the 5 year initial <strong>per</strong>iod<br />
x) After 5-year evaluate each farm unit; <strong>and</strong> for those units not <strong>per</strong>forming no further lease is provided to the loaned graduate; <strong>and</strong> he/<br />
she forfeits his opportunity to o<strong>per</strong>ate the particular farm unit. It is then loaned to another one in-waiting.<br />
xi) The contracts should be between the individual graduate <strong>and</strong> the Government (through the Treasury ). There should be a special<br />
ASLM committee charged with monitoring the farming progress; <strong>and</strong> providing some technical assistance.<br />
27
Irrigation <strong>and</strong> Crop Sub-Sectors (continued)<br />
PROBLEM/ ISSUE<br />
DETERMINED<br />
CAUSE<br />
BROAD ACTION(S)<br />
TO TAKE<br />
SPECIFIC PRACTICAL ACTION TO TAKE<br />
3.2 Low level of input use 3.2.1 (As for 1.2.1 to<br />
1.,2.,4, above)<br />
3.3: Use of poor, inefficient, 3.3.1 (as for 1.3.1<br />
burdensome farming equipment/ above)<br />
tools & facilities<br />
3.4: Depressed crop prices<br />
received by farmers (farm-gate<br />
prices) – farmers not encouraged<br />
to produce more<br />
3.4.1 (as <strong>per</strong> 1.41 to<br />
1.4.3 above)<br />
As <strong>per</strong> under 1..2.1 to 1.,2.,4, above<br />
as <strong>per</strong> under 1.3.1 above<br />
As <strong>per</strong> under 1.4.1 to 1.4.3 above<br />
3.5 Little or non-addition of<br />
value to raw crop by producers,<br />
contribute to low incomes to<br />
farmers<br />
3.6 Bureaucratic huddles into<br />
securing l<strong>and</strong> in villages for<br />
farming<br />
3.7 Too much l<strong>and</strong><br />
fragmentation in some Irrigation<br />
zones (especially Kilimanjaro)<br />
making farm o<strong>per</strong>ations<br />
inconvenient <strong>and</strong> costly<br />
3.8 Inadequate<br />
institutional linkages<br />
between MAFC &<br />
District extension units<br />
3.5.1 (as for 1.5.1<br />
above)<br />
3,6.1: (As for 1.6.1<br />
above).<br />
3,7.1: In the rural areas<br />
in this zone, l<strong>and</strong> is<br />
more or less<br />
individually owned; <strong>and</strong><br />
individual is free to<br />
parcel it out to his<br />
children as they come of<br />
age; or to any one he<br />
wishes (for free or hire).<br />
3.8.1: incomplete<br />
institutional<br />
reforms<br />
As <strong>per</strong> under 1.5.1 above<br />
As <strong>per</strong> under 1.6.1 above.<br />
i) It is time there is a regulation for minimum l<strong>and</strong> ownership for individual farmer (say 1 acre);<br />
beyond that those needing farm l<strong>and</strong> would have to move to areas with surplus l<strong>and</strong> or go into<br />
other types of enterprises.<br />
Iii) Enforce regulation that will allow reallocation of l<strong>and</strong> that has not been in use continuously for<br />
(say) 3 years<br />
iii) Enforce regulation that will enforce redistribution of un-tended/ neglected (for 3 years<br />
continuously) large tracks of l<strong>and</strong> held by individual/ organization or firm.<br />
iv) Enforce regulation that will forbid using l<strong>and</strong> as security loan for more than 5 years<br />
continuously; beyond that there should be reapplication [this will ease relocation on neglected<br />
l<strong>and</strong>; as no banking claims could be laid on the l<strong>and</strong> after the 5-year <strong>per</strong>iod<br />
.<br />
i) Hold a (MAFC-Districts) linkage seminar to work out a more productive linkage<br />
structure for moving crop productivity forward<br />
28
<strong>Food</strong> Security<br />
S/N ISSUES SUGGESTED<br />
SOLUTIONS<br />
1 ‣ Tanzania is not fully self • Human<br />
sufficient in <strong>Food</strong> crop<br />
nutrition<br />
production, particularly<br />
in respect of cereals ;<br />
education:<br />
though non-cereals<br />
would appear sufficient<br />
-Providing human nutrition education country-wide would enable the general community to move more<br />
into non-cereal foods, particularly cassava whose production <strong>and</strong> availability could be substantially<br />
enhanced as it can do well in all the country’s regions, given the existence of more palatable, resistant<br />
varieties now in existence, some of whose tubers taste like bread if not better. [SUA had developed such varieties<br />
long time ago - way back in the 1970s]. Even with little or a minimum of inputs (possibly one or two sprays if<br />
necessary) a farmer could harvest quite a sizable yield from his small plot; enough for his family use <strong>and</strong> for<br />
sale to get income. Sweet potatoes is another non-cereal crop that should be promoted along the same lines.<br />
-For those farming communities not wanting to diversify into non-cereal, <strong>and</strong> are living in the rainfallscarcity<br />
<strong>and</strong> unreliability regions of the country (mainly Dodoma, Manyara, Singida <strong>and</strong> Shinyanga), they<br />
should be sensitised to grow suitable varieties of sorghum; <strong>and</strong> if possible they should be made to move from<br />
maize production all together as many years of ex<strong>per</strong>ience has shown that chances of those regions getting a<br />
worthy maize crop under existing varieties is next to nil.<br />
-Nutrition education is also needed to sensitize farmers/ communities to produce <strong>and</strong> eat pulse varieties<br />
that are suitable to their ecologic area<br />
• Efficient<br />
food<br />
distribution<br />
:<br />
• <strong>Food</strong><br />
processing<br />
to add<br />
value:<br />
More efforts are needed to ensure that food produced in the country is available timely at all corners of the<br />
country under free market conditions. Measures for suppressing producer food crop prices to below market<br />
level (cif value) must be avoided, as such efforts are counterproductive - they thwart efforts in producing<br />
more food. For instance while currently there are a number of districts reported by the FSD to be having<br />
serious food shortage there is food surplus in parts of the Southern Highl<strong>and</strong>s regions, some in government’s<br />
Grain Reserve godowns.<br />
-<strong>Food</strong> processing capacity <strong>and</strong> skill are badly needed to add value to farmer’s food crops in order to increase<br />
farmer income <strong>and</strong> reduce rural poverty.<br />
-Government, while encouraging private sector to invest in food production <strong>and</strong> processing, it should also<br />
promote <strong>and</strong> support setting up of small scale food crop (including also vegetables <strong>and</strong> fruits) processing<br />
plants by producer groups/ coo<strong>per</strong>atives, <strong>and</strong> even at pro<strong>per</strong> individual courtyards. Dependable credit<br />
facility <strong>and</strong> training would be badly needed here.<br />
29
<strong>Food</strong> Security(continued)<br />
• Marketing infrastructure • Speeding up the pace of establishing appropriate marketing infrastructure<br />
(including collection centres, market centres warehouse receipt system; <strong>and</strong><br />
well maintained rural roads) would greatly help rural <strong>and</strong> urban poor<br />
exchange products; <strong>and</strong> also attract more buyers to rural areas (increasing<br />
competition); thereby enhancing incomes <strong>and</strong> reducing poverty.<br />
• Quality crop produce <strong>and</strong><br />
processed food commodity<br />
products<br />
• Improving extension services<br />
to farmers<br />
• Quality assurance is really key to business success; securing <strong>and</strong> maintaining<br />
markets <strong>and</strong> enhancing incomes<br />
• Quality must also be seen in form of secure, well labelled attractive packaging<br />
for crop produce <strong>and</strong> products<br />
• Extension services to crop farming is still limited in both staff<br />
numbers <strong>and</strong> practical training.<br />
• Farmer Field Schools, for which KATC has developed a model<br />
training, are still scarce in the country; <strong>and</strong> trainers too are few.<br />
• Much more resources are needed in these two levels of<br />
extension service<br />
• Increased investment in<br />
irrigation<br />
• Government should promote <strong>and</strong> support much more investment in both<br />
small –scale <strong>and</strong> large scale irrigation schemes/ projects<br />
• The approach <strong>and</strong> model provided under TIP projects in the northern zone<br />
districts of Same, Lishoto <strong>and</strong> others, should be fully adopted for small scale<br />
irrigation in hilly areas; as among other things, the model is excellent for soils<br />
conservation <strong>and</strong> management<br />
• Government should promote <strong>and</strong> support much more investment in both<br />
small –scale <strong>and</strong> large scale irrigation schemes/ projects<br />
• The approach <strong>and</strong> model provided under TIP projects in the northern zone<br />
districts of Same, Lushoto <strong>and</strong> others, should be fully adopted for small scale<br />
irrigation in hilly areas; as among other things, the model is excellent for soils<br />
conservation <strong>and</strong> management<br />
• Increased subsidy in inputs<br />
<strong>and</strong> appropriate farming<br />
equipment<br />
• Additional resources in this area are very essential in enhancing food security<br />
to the rural poor <strong>and</strong> at national level as a whole.<br />
30
MAIN TEXT<br />
1 INTRODUCTION AND CONTEXT<br />
1.0 Background<br />
<strong>Agriculture</strong> sector, though has in the immediate past contributing only about one-quarter of the<br />
national GDP <strong>and</strong> bringing in about 17% of the country’s foreign exchange, is considered very<br />
crucial towards the fulfilment of the strategy of meeting the country’s medium-term<br />
development goal as expressed in the National Strategy for Growth <strong>and</strong> Reduction of Poverty<br />
(NSGRP) (also known by its acronym, MKUKUTA); as well as in meeting Tanzania’s long term<br />
goal as prescribed in Tanzania Development Vision 2025 (TDV2025). The targets for both of these<br />
development strategies are aligned with those contained in the internationally agreed United<br />
Nations agreed Millennium Development Goals (MDG, which are aimed at combating hunger,<br />
disease, illiteracy, environmental degradation, <strong>and</strong> discrimination against women; <strong>and</strong> likely<br />
above all, reducing poverty. One major target for TDV2025 is to reduce poverty by 50 % on<br />
reaching 2015, <strong>and</strong> getting rid of it all together by 2025, a thing that requires rapid economic<br />
growth to achieve. Indeed the agriculture sector has been given prominent role towards<br />
achieving MKUKUTA targets, in particular cluster one (GDP growth) <strong>and</strong> cluster three<br />
(reduction of poverty <strong>and</strong> attainment of national food security). [1,2]<br />
The sector is source of livelihood for some 70% of the population <strong>and</strong> provides employment to<br />
almost the same <strong>per</strong>cent of households; <strong>and</strong> who live in the rural areas, undertaking mostly<br />
small scale crop production <strong>and</strong> livestock keeping. These are the people the agricultural sector<br />
has to address; to enable them reduce income poverty <strong>and</strong> produce sufficient food for<br />
themselves <strong>and</strong> have surplus to sell in order to reduce income poverty.<br />
The sector’s development is being facilitated by the government through its five ministries,<br />
together called Agricultural Sector Line Ministries (ASLM), which include MAFC, MLDF, MWI<br />
MITM, <strong>and</strong> PMO-RALG.<br />
The sector development is guided by the government’s Agricultural Sector Development<br />
Strategy (ASDS), which is an all round, comprehensive guiding mechanism for implementing<br />
cluster One target (Growth) <strong>and</strong> Cluster Two (poverty reduction <strong>and</strong> food security) for MKUKUTA.<br />
ASDS has a number of intermediate outcomes that include increased irrigation infrastructure,<br />
rural – urban linkages, <strong>and</strong> so on. Irrigation in particular is currently being singled out (by both<br />
high level Government circles <strong>and</strong> the Private sector - under a new emphasis of ‘Kilimo Kwanza’ -<br />
meaning ‘agriculture first’) as <strong>per</strong>haps one of the most important vehicles for facilitating the<br />
achievement of the sector’s growth, reduction of poverty <strong>and</strong> food security. Private sector (agribusinesses<br />
contract farms, processors, traders/ exporters) involvement too, is emphasised (in<br />
the ASDS) as a crucial party towards developing strong, vibrant agricultural sector. [3]<br />
31
The objectives of the ASDS are being implemented by a comprehensive government tool, called<br />
Agricultural Sector Development Programme (ASDP), which has two components, known as<br />
Local Level Support: <strong>and</strong> National Level support. [4]<br />
Component A: Local Level Support: has three sub-components - (i) Local agricultural<br />
investment, (ii) Local Agricultural Services, (iii) Local agricultural Capacity Building <strong>and</strong><br />
Reforms.<br />
Component B: National Level support: has three sub-components five sub-components (ii)<br />
Agricultural Services; (ii) National Irrigation Development (iii) Marketing <strong>and</strong> Private Sector<br />
development; (iv) <strong>Food</strong> security; (v) Coordination, Monitoring <strong>and</strong> Evaluation.<br />
Implementation of the ASDP, a 7-year development, began in 2001; <strong>and</strong> ever since, the ASDP has<br />
been funded annually under the ‘Basket Fund,’ contributed into, largely by Development Partners;<br />
<strong>and</strong> the rest by Tanzania Government.<br />
The targeted growth rate for the sector under the MKUKUTA is 6-8%, whereas, its current<br />
moving average annual growth rate is only 4.6%, which is still below the targeted growth.<br />
It is for this reason (desire to achieve the relevant MKUKUTA targets) the ASLM grouping of<br />
five ministries, through MAFC, decided to undertake, a study for two things: one being<br />
Agricultural Sector Review (ASR) in order to assess the sector’s <strong>per</strong>formance; <strong>and</strong> two, the<br />
Public Expenditure Review of 2009/10 with the purpose of informing government budget<br />
process (including budget guidelines <strong>and</strong> the budget components of government spending;<br />
<strong>and</strong> checking on consistency with policy <strong>and</strong> specified expenditure priorities). The present<br />
report by the commissioned consultant, is the result of the study.<br />
1.2 Context<br />
The agricultural sector has both opportunities <strong>and</strong> drawbacks/ challenges in respect of<br />
achieving its growth targets set under NSGRP.<br />
Tanzania has very substantial un-exploited agricultural potential l<strong>and</strong> totalling some 43 million<br />
hectares, of which only about 6.3 million ha (or only about 15%) is under cultivation, leaving<br />
85% of the l<strong>and</strong> idle! [6]. Out of this agricultural potential l<strong>and</strong>, 2.1 million ha are of high<br />
irrigation potential (with high water resources possibility of equal to or more than 1.0 sq m /<br />
sec/ 500 sq km); <strong>and</strong> 4.8 million ha of medium irrigation potential (water resources of < 1.0 sq/<br />
sec/500sq km); <strong>and</strong> 33.3 million ha of low irrigation potential, with even lower water resources<br />
possibility. Yet out of the combined high <strong>and</strong> medium irrigation potential l<strong>and</strong> of some 7 million<br />
ha, only about 854,300 ha (12%) have been provided any kind of irrigation infrastructure.<br />
Nevertheless, within these schemes hectares, only 279,604 ha are said to have been actively<br />
under irrigation by May 2008. [7].<br />
Further, the 2.1 million ha of high irrigation potential are part of the vast, 2.7 million ha of very<br />
important wetl<strong>and</strong>s (seasonal <strong>and</strong> <strong>per</strong>manent freshwater swamps <strong>and</strong> flood plains) straddling<br />
most of the country’s main drainage basins, which are bathed by various river systems, which<br />
include Rufiji/ Ruaha (draining 177,000 sq km area), Malagarasi/ Moyowosi, Pangani,<br />
32
Wami/Ruvu, Kagera, Ugalla, Suive <strong>and</strong> Mara. These rivers are in turn associated with 9 river<br />
basins in the country. The basins are Pangani Basin; Wami <strong>and</strong> Ruvu Basin; Rufiji Basin,<br />
Ruvuma <strong>and</strong> the Southern Coast Basin; Lake Nyasa Basin; Lake Rukwa Basin; Lake Tanganyika<br />
Basin; Lake Victoria Basin; <strong>and</strong> Internal drainage.[8]. Some major water bodies have hardly<br />
been touched at all for irrigation; these include Ruvuma River, <strong>and</strong> almost all fresh water lakes,<br />
which apart from Lake Victoria, where there appears to be some snags, the rest are quite<br />
available for irrigation.<br />
The assessed irrigation potential l<strong>and</strong> categories (high, medium <strong>and</strong> low) are exclusive of the<br />
water bodies (7.3 million ha), forest/ marginal l<strong>and</strong> (35.9 million ha), <strong>and</strong> Protected areas (27.1<br />
million ha). Thus the country has a long way to go to catch up with the ‘Tigers’ of Asia in terms<br />
of putting potential l<strong>and</strong> under irrigation. Thus In 2000, it is said that about 345 million<br />
hectares of agricultural l<strong>and</strong> had been equipped with irrigation infrastructure. <strong>Of</strong> these<br />
about 68% were in Asia, 17% in America, <strong>and</strong> only 5% in Africa. The largest contiguous<br />
areas of high irrigation density were in North India <strong>and</strong> Pakistan (along the rivers<br />
Ganges <strong>and</strong> Indus); in the Hai He, Huang He <strong>and</strong> Yangtze basins in China, along the<br />
Nile river in Egypt <strong>and</strong> Sudan, in the Mississippi-Missouri river basin <strong>and</strong> in parts of<br />
California. [2].<br />
Now, of the 17.25 million hectares provided with irrigation infrastructure in Africa,<br />
only the already stated 854,300 ha (or only 5%) are in Tanzania in form of estimated<br />
‘irrigation schemes’ area, with 670,400 ha in existing schemes <strong>and</strong> 183,900 in newly<br />
proposed schemes. [6]. But of these schemes hectares, only 279,604 ha were reported to<br />
be under active irrigation as of May 2008. [7]<br />
Tanzania has certainly very substantial water resources currently. The already stated high<br />
potential irrigation areas (with high water resources possibility of equal to or more than 1.0 sq<br />
m / sec/ 500 sq km) are mostly along the <strong>per</strong>iphery of the country; they overlie the regions of<br />
Kilimanjaro, Arusha, Mbeya, Iringa, Lindi, Mtwara, Mara, Kigoma <strong>and</strong> Rukwa. The low<br />
potential ones (> 1.0 sq/ sec/500sq km) lie immediately outside the high potential ones. It is<br />
estimated that the annual surface water run-off from the country into the oceans is a whole<br />
74,000,000,000 cu m [8].<br />
Nevertheless, there are on the other h<strong>and</strong>, major constraints facing the agricultural sector, right<br />
from commodities production to processing, right to marketing (domestic <strong>and</strong> export); that is<br />
along the entire commodity value chain. These will be discussed subsequently under the<br />
relevant study output. But here we may wish to touch on what is seen as major factor that is<br />
likely to affect crop (<strong>and</strong> livestock) production for several years to come; <strong>and</strong> was indeed one of<br />
the issues raised in the previous sector review report. [9]. This has to do with climate change.<br />
According to climate change ex<strong>per</strong>ts, Tanzania, by year 2100, is predicted to warm up by 2- 4<br />
Degrees Centigrade, with central regions ex<strong>per</strong>iencing even higher tem<strong>per</strong>atures. The result of<br />
this warming up is decrease of anything up to 20% rainfall in the latter regions. However, in the<br />
Lake Victoria Basin, <strong>and</strong> in the northeast <strong>and</strong> south east of the country total rainfall may<br />
increase by 25-50%. The overall effects of these predicted climate changes is likely to increase<br />
rainfall variability, prolong the dry season <strong>and</strong> make <strong>per</strong>iodic droughts more severe,<br />
particularly for the interior parts of the country.<br />
33
These predictions also have it that some rivers (in particular Pangani <strong>and</strong> Ruvu) would be<br />
subjected to decreased runoff of some 6 to 10%, while on some others (particularly Rufiji) the<br />
runoff would likely increase by 5 to 11%. Such changes could greatly affect crop <strong>and</strong> livestock<br />
production adversely unless research <strong>and</strong> development are continually braced for producing<br />
crop varieties <strong>and</strong> breeds that will increasingly adapt to the climate change country-wide.<br />
Decreased rainfall <strong>and</strong> poorly distributed rainfall would likely reduce production, unless there<br />
are irrigation infrastructures available that have been adapted to the situation (including rain<br />
water harvesting to capture more water for irrigation). In the predicted increased rainfall areas,<br />
there could likely occur floods, unless effective water control measures are continually put in<br />
place.<br />
Meanwhile what is needed is much more resources allocated to the sector, not just for fighting<br />
climate change, but even more so to meet its required targets in the MKUKUTA, <strong>and</strong> on to<br />
TDV2025. The CAAD target of having 10% of national budget resource to be allocated to<br />
agricultural sector is yet to be achieved; this year the allocation was an improvement over past<br />
years; the allocation in 2009/2010 was 6.4% of national budget.<br />
34
1.3 The consultancy assignment<br />
1.3.1 Terms of Reference (TOR) <strong>and</strong> objective <strong>and</strong> scope of the study assignment<br />
1.3.1.1 Overall Objective of the Review<br />
The overall objective of the 2009/10 ASR <strong>and</strong> PER (as <strong>per</strong> TOR) is to assess the <strong>per</strong>formance of<br />
the agricultural sector on poverty reduction (as <strong>per</strong> MKUKUTA targets); <strong>and</strong> also to assess the<br />
level of public budget <strong>and</strong> expenditures in the sector in relation to sector <strong>per</strong>formance; in the<br />
context of CAADP.<br />
1.3.1.2 Objective of the study Assignment<br />
The objective of the study assignment is essentially to carry out <strong>per</strong>formance review of the<br />
Agricultural Sector <strong>and</strong> PER for year 2009/2010 <strong>and</strong> make recommendations for way-forward<br />
for the sector.<br />
1.3.1.3 Geographical <strong>and</strong> Institutional Coverage<br />
Apart from Dar es Salaam, field work was carried out in eight other regions, namely; Tanga,<br />
Kilimajaro, Arusha, Mwanza , Mara, Morogoro, Iringa <strong>and</strong> Mbeya.<br />
In Dar es Salaam, the study covered all the sectoral Ministries (namely, <strong>Ministry</strong> of <strong>Agriculture</strong> <strong>Food</strong><br />
Security <strong>and</strong> Coo<strong>per</strong>atives (MAFC), <strong>Ministry</strong> of Livestock Development <strong>and</strong> Fisheries (MLDF) but<br />
excluding Fisheries Sector, <strong>Ministry</strong> of Water <strong>and</strong> Irrigation, <strong>and</strong> PMO - Regional Administration <strong>and</strong><br />
Local Government; also other relevant government Ministries (including <strong>Ministry</strong> of Finance &<br />
Economy) agencies (including Bank of Tanzania, National Bureau of Statistics, <strong>and</strong> so on), as well as<br />
some private sector entities.<br />
In the regions the study covered the RAS offices, DED offices, the farming community, traders <strong>and</strong> NGO/<br />
CBOs.<br />
1.4. Scope of work for the consultancy assignment. This was as follows:<br />
i) As <strong>per</strong> the TOR, the activities to be undertaken for the <strong>Agriculture</strong> Sector Review are<br />
presented here ( in slight change in order). These are to:<br />
<br />
Assess sectoral (policy <strong>and</strong> regulatory framework) <strong>and</strong> sub-sectoral (irrigation,<br />
crop, livestock, <strong>and</strong> marketing) <strong>per</strong>formance since 2006 with particular emphasis on<br />
attainment of MKUKUTA targets.<br />
<br />
Assess the <strong>per</strong>formance of the sector in ensuring national food security.<br />
35
Assess progress made in planning, formulation <strong>and</strong> implementation of the<br />
District Agricultural Development Plans by both men <strong>and</strong> women <strong>and</strong> determine the<br />
outcomes so far started to be achieved towards reducing rural poverty.<br />
Assess relevance of the ASDP M&E Framework <strong>and</strong> short-listed indicators for<br />
assessing the <strong>per</strong>formance of the programme.<br />
Assess the effect of the current global economic meltdown on agricultural<br />
<strong>per</strong>formance <strong>and</strong> likely outturn in future.<br />
Assess relevance of the ASDP M&E Framework <strong>and</strong> short-listed indicators for<br />
assessing the <strong>per</strong>formance of the programme.<br />
Assess relevance of wealth creation indicators to be used to measure rural<br />
poverty reduction in other reports undertaken by other consultants.<br />
Review <strong>and</strong> examine the status of implementation of the recommendations made<br />
in the 2008/09 ASR/PER<br />
ii) The activities to be undertaken for the Public Expenditure Review are to:<br />
<br />
<br />
<br />
<br />
Examine public sector planning resource allocation, expenditure <strong>and</strong> financial<br />
management in the agriculture sector<br />
Assess the ASDP Basket Fund budget planned versus disbursement <strong>and</strong><br />
expenditure<br />
Assess the value for money in the smart agricultural inputs subsidy programme.<br />
Based on the above mentioned assessment <strong>and</strong> drawing from sector studies<br />
available during the <strong>per</strong>iod under review, to make recommendations on:<br />
• Sector priorities in crop, livestock, marketing, <strong>and</strong> irrigation sub-sectors<br />
• Sector <strong>per</strong>formance<br />
• Priorities for Policy <strong>and</strong> Regulatory Framework<br />
• Public budget allocation <strong>and</strong> expenditure<br />
1.4 Approach <strong>and</strong> Methodology<br />
The consultant employed a participatory approach, in which among other people, ASLMs<br />
counterpart staff were taken on board fully, right from the start. Study preparatory meeting<br />
between client <strong>and</strong> consultant, with all counterpart staff present in most of them, went a long<br />
way to make this study truly participatory.<br />
Thus the study involved review of secondary information sources, <strong>and</strong> seeking primary data<br />
through undertaking stakeholder interviews to target ASLMs officials., other key respondents,<br />
organisations <strong>and</strong> firms; <strong>and</strong> the beneficiaries of the ministries’ services; that included district<br />
36
managements, <strong>and</strong> especially farmers, agricultural commodity traders <strong>and</strong> the general<br />
community.<br />
Apart from undertaking exhaustive desk review of available relevant documents from each of<br />
ASLMs, <strong>and</strong> from the private sector (at national <strong>and</strong> district level), the consultant held in-depth<br />
interviews (guided by targeted, checklists/ questionnaires) to relevant staff of ASLMs, <strong>and</strong><br />
those in other relevant ministries, including <strong>Ministry</strong> of Finance <strong>and</strong> Economy; <strong>and</strong> to private<br />
sector key informants (at national to district level), NGOs/CBOs; <strong>and</strong> key informants.<br />
Information from farmers/ community groups, societies (especially coo<strong>per</strong>ative societies) was<br />
obtained through focus group discussion Data for the study was thus be obtained from both<br />
secondary sources (relevant ASLMs documents <strong>and</strong> reports - including DADPS M&E reports;<br />
other sector analytical reviews for the year 2008/09; <strong>and</strong> other literature, including the internet);<br />
<strong>and</strong> primary sources (stakeholder interviews to ASLMs <strong>and</strong> to other stakeholders, including<br />
private sector, NGOs/ CBOs <strong>and</strong> farmer/ community groups; <strong>and</strong> also from field<br />
observations). Pictures were also taken as appropriate<br />
37
2.0 ANALYSIS AND FINDINGS<br />
2.1 Assessment of Sector Performance<br />
2.1.1 Irrigation Sub-sector<br />
2.1.1.1 Irrigation - at national level<br />
As already stated at the introduction chapter, Irrigation in particular, is currently being looked<br />
upon (by both high level Government circles <strong>and</strong> the Private sector - under a new emphasis of<br />
‘Kilimo Kwanza’ , as <strong>per</strong>haps one of the most reliable vehicles for facilitating the achievement of<br />
the sector’s growth, reduction of poverty <strong>and</strong> food security, as <strong>per</strong> MKUKUTA cluster one <strong>and</strong><br />
three targets.<br />
Assessment of <strong>per</strong>formance of the Irrigation sub-sector <strong>per</strong>formance is here looked at in two<br />
ways. First, is looking at area developed for irrigation over the years; <strong>and</strong> the second is looking<br />
at crop production <strong>and</strong> productivity.<br />
Nationally, area under irrigation up to 2007/08 was 289,254 ha. Recent institutional changes the<br />
irrigation sub-sector was put under the <strong>Ministry</strong> of Water <strong>and</strong> Irrigation, which immediately set<br />
its <strong>per</strong>formance targets for 2008/09. In terms of acreage, the <strong>Ministry</strong> in 2008/09 had targeted<br />
to increase area under irrigated agriculture from the then existing 289,245 ha to 316,745 ha.<br />
However, though it did not have 100% achievement, it managed to achieve 78% (21,500 ha<br />
developed for irrigation <strong>and</strong> was for small holder 7 schemes). This was certainly a<br />
commendable achievement, on the basis of the target set. In the same year the <strong>Ministry</strong> had<br />
targeted to undertake feasibility study <strong>and</strong> irrigation design for 68 new irrigation schemes, but<br />
achieved to do so for 47 schemes; again a good achievement.<br />
The ministry had also planned to construct 2 dams, one in Nyamilangano (in Kahama District)<br />
<strong>and</strong> Maswale (in Babati District); <strong>and</strong> the achievement here has been 100%. Two other dams<br />
were targeted for Muheza District <strong>and</strong> Msoga (Bagamoyo District). However, in this task<br />
achievement was 40% completion. The <strong>Ministry</strong> also did assist in formulation of 283 schemes;<br />
out of which 184 were for DADP funding <strong>and</strong> 94 were for funding by District Irrigation<br />
Development Fund. Also for some of the schemes not yet completed, implementation was in<br />
various stages of completion. Table Ir1, below shows the <strong>Ministry</strong>’s targets for various<br />
irrigation activities against achievement.<br />
Massive investment in irrigation is really a very important element for ensuring success of<br />
Kilimo Kwanza <strong>and</strong> MKUKUTA goals. ASDP through DADPs funding of irrigation is still very<br />
limited to be of major impact on poverty reduction <strong>and</strong> ensuring sustainable food security.<br />
There is no doubt irrigation have revolutionized food crop yields for a number of crops,<br />
especially paddy, vegetables, flowers <strong>and</strong> even maize. For instance, paddy yields have tripled<br />
or quadrupled in many of the established irrigation schemes. At Kikula (Kilombero) <strong>and</strong><br />
Mwamapuli (Tabora Irrigation Zone) schemes paddy yields have reached dependable yields of<br />
7.9 tons <strong>and</strong> 10 tons <strong>per</strong> ha <strong>per</strong> season, respectively.<br />
38
Table Ir1: Target area for development into irrigation scheme as against achievement<br />
2008/09<br />
S/N/ Activity Target Target<br />
Achievement<br />
Percent achievement<br />
(ha)<br />
(ha)<br />
1. Increasing<br />
na 27,000 21,500 78%<br />
irrigated area<br />
2 Feasibility<br />
na 68* 47** 69%<br />
study <strong>and</strong><br />
design of<br />
irrigation<br />
schemes<br />
3 Construction na 2 (one in Nyamilangano (Kahama) <strong>and</strong><br />
2 100%<br />
works for<br />
another Maswale District (Babati District)<br />
dams<br />
3 Construction na 2 (one in Muheza District & another in<br />
2 40%<br />
works for<br />
Msoga (Bagamoyo District)<br />
dams<br />
Schemes<br />
formulation<br />
na - 283***<br />
* This was targeted to irrigate 200,000 hectares<br />
** expected to comm<strong>and</strong> an area of 137,744<br />
*** Out of these 94 were for District Irrigation Development Fund (DIDF); <strong>and</strong> the rest for DADPs funding<br />
Nevertheless, while the <strong>Ministry</strong> is to be commended for its achievement for the particular year,<br />
there is still huge number of irrigation potential hectares in the country. There are 7 million<br />
hectares of high <strong>and</strong> medium potential irrigation l<strong>and</strong>. Thus, given the present level of resource<br />
allocation to the <strong>Ministry</strong> it will take some 330 years (3.3 centuries) to develop the whole high<br />
<strong>and</strong> medium irrigation potential l<strong>and</strong>.<br />
What to be done<br />
- at national level<br />
The government needs to create an enabling environment to attract medium <strong>and</strong> large scale<br />
serious investors in this area.<br />
What kind of enabling environment is needed<br />
i) Government should try <strong>and</strong> provide a bigger budget for developing irrigation infrastructure<br />
ii) Government should consider increasing level of tax holiday to medium <strong>and</strong> large scale<br />
investors in irrigation.<br />
iii) The newly established L<strong>and</strong> Bank should have at h<strong>and</strong> large tracts of irrigable potential<br />
l<strong>and</strong>, ready for investment by serous farming investors; <strong>and</strong> no red-tape to potential, serious<br />
investors wishing to have long-term lease for sizable l<strong>and</strong> for irrigation investment. Title deeds,<br />
in particular, should be readily available.<br />
iv) L<strong>and</strong> for irrigation investment should be in reasonable size blocks of say about 4,000 ha for<br />
large scale farming <strong>and</strong> 500 to 1,000 ha for medium scale farming (this latter being largely for<br />
39
local people). However, any foreign investor should be in joint venture with local entrepreneur;<br />
<strong>and</strong> should employ very minimal foreign labour.<br />
v) Government could look into possibility of guaranteeing bank loans for medium <strong>and</strong> large<br />
scale investors, at least for short <strong>per</strong>iod (say one year)<br />
vi) Government should assist in seeking <strong>and</strong> maintaining reliable markets for the commodities<br />
to be produced from the irrigation investments.<br />
vii) Government should guarantee free market for commodities produced from the irrigation<br />
investments - no bans on export or cross-border trade.<br />
viii) Government should try <strong>and</strong> provide basic infrastructure at irrigation potential areas, in<br />
order to attract investments - electricity, roads/ railway <strong>and</strong> water.<br />
ix) A stable macro-economic climate, including low inflation rate, is essential in attracting<br />
investment as a whole.<br />
ix) Peace <strong>and</strong> security must continue to reign in the country.<br />
2.1.1.2 Irrigation - at District level<br />
In the districts as would be expected from the national figures provided above, there is a lies<br />
large tract of potentially irrigable l<strong>and</strong> that is yet to be exploited for such. The irrigable l<strong>and</strong><br />
ranges from high, medium to low potential, as <strong>per</strong> NIMP report <strong>and</strong> MWI. This irrigation<br />
potential <strong>and</strong> other irrigation activities aspects are discussed below under some of the districts<br />
visited.<br />
a) Irrigation in Korogwe District<br />
i) Irrigated area expansion<br />
Korogwe District, according to the data provided by the district has a total of 17,000 hectares of<br />
irrigable l<strong>and</strong>, of which 5,630 ha (33%) are under irrigation. Yet Korogwe is blessed with a very<br />
potential river basin , the Pangani Basin, which receives water from Pangani River itself <strong>and</strong> its<br />
tributaries of Mbeza, Kizara, <strong>and</strong> Vulani; <strong>and</strong> also the Lwengere, Mkomazi, <strong>and</strong> Soni rivers.<br />
Indeed Korogwe District has very important drainage system that allows for substantial<br />
irrigation activities. This is not to mention its good rainfall regime of from 500 in parts of the<br />
low l<strong>and</strong> to some 2,000 mm along the Usambara mountains. Irrigation development has been<br />
slow due to, what was said, was inadequate resources for funding irrigation infrastructure for<br />
both improving the traditional irrigated areas <strong>and</strong> for expansion into new areas. The main crop<br />
produced under irrigation has been paddy, <strong>and</strong> to a much lesser extent, maize.<br />
40
Table K1, below shows trend in irrigated area expansion; as well as crops grown. As it will be<br />
seen after increase of area under irrigation, by 25% in 2006/07, this has not been attained again;<br />
in fact it dropped to 7% increase in 2007/08.<br />
The district was one of the districts that were funded under PADEP; <strong>and</strong> is also being funded<br />
under ASDP, through the DADPs financing. Under PADED a number of village/ ward level<br />
projects were identified, but then the blanket funding of Tshs 35,000 <strong>per</strong> project was just too<br />
small to enable the projects so funded take off, as most of the village projects’ individual cost<br />
ranged from about Tshs 150 million to over 200 million. Thus in some of the villages, the money<br />
was just banked to await additional funds. Feasibility study (including irrigation infrastructure<br />
design) for the village envisaged irrigation scheme cost was some Tshs 20 million - leaving<br />
only Tshs 15 million for building the infrastructure!<br />
The funding under ASDP (DADPS) was reported to be much better as it is anything up to Tshs<br />
500 million <strong>per</strong> irrigation project. However, the irrigation infrastructures under DADPs funding<br />
are in a number of cases not yet completed to allow for irrigation to take place. These schemes<br />
are Kwamkumbo (main canal completed), Makorora (Headworks completed) Mkokola<br />
(Headworks completed) <strong>and</strong> Mwaha (Headworks under construction). Yet the schemes were<br />
scheduled to be completed in 2009 - the consultant visited the district in 2 nd week of October 2009.<br />
Table K1: Irrigated area expansion in Korogwe District 2005/06 to 2008/09<br />
Irrigated<br />
Crops<br />
grown<br />
Area under Irrigation<br />
(ha)<br />
2005/06 2006/07 % change 2007/08 % change 2008/09 % change<br />
Paddy 3,200 4,000 25% 4,300 7% 5,000 16%<br />
Maize 300 420 40% 510 21% 630 23%<br />
ii) Irrigated crop productivity in Korogwe District<br />
Korogwe District has some of the shiny irrigation schemes examples. These are Kwemaz<strong>and</strong>u<br />
<strong>and</strong> Mombo Irrigation schemes. In the last three years (2006/07 to 2008/09) annual paddy<br />
production has increased considerably. Thus at Mombo Irrigation scheme, paddy yields<br />
increased from 40 bags <strong>per</strong> ha/ year in 2006/07 to 80bags <strong>per</strong> ha /<strong>per</strong> year in 2008/09 (an<br />
average annual increase of 33%), in the case of good farmers. Similarly at Kwemaz<strong>and</strong>u paddy<br />
increased from 32 bags <strong>per</strong> ha/year in 2006/07 to 80bags <strong>per</strong> ha / year for good farmers. (Each<br />
bag weighs 80kg). However, not all farmers in the schemes do achieve that level of production<br />
due to differences in ability to purchase adequate inputs or in management. Water scarcity too<br />
does affect production, as those getting water late or just a little, do have much lower harvest.<br />
b) Irrigation in Mvomero District (Morogoro Region)<br />
Potential irrigable area in Mvomero District is 20,579 ha, yet currently only 5,281 ha (just about<br />
a quarter) is under irrigation. The district in any case had targeted to have 16,052 ha by 2010; a<br />
41
lofty target indeed, that is unlikely to be achieved, considering year 2010 is just around the<br />
corner.<br />
One very important irrigation scheme visited in the district is Dakawa Irrigation Scheme which<br />
has 2,500 ha of developed area, <strong>and</strong> where paddy is the crop grown , <strong>and</strong> yields have been<br />
increasing over the years. Thus yields under irrigation increased from about 4.5tons/ ha in<br />
2004/05 to 7.9 tons/ ha in 2008/09 (a 75% increase). Paddy yield under rain-fed in the Dakawa<br />
village area has hardly passed 1 ton/ ha over the past 5 years. This is an example showing the<br />
power of irrigation over rain-fed agriculture; see Figure K2 below.<br />
Figure K2 : Yield comparison between rain-fed <strong>and</strong> irrigated paddy at Dakawa Irrigated Scheme area<br />
Source: Field survey data<br />
iii) Providing benefits to increased population<br />
The increase in paddy production in the schemes over the years has improved the well being of<br />
the farmers <strong>and</strong> their families. Also increasing number of families have benefited directly from<br />
the schemes.- fighting income poverty <strong>and</strong> improving food security in the district. For example,<br />
at Mombo Irrigation Scheme, in 2006/07 the number of known farmers was 400, but then the<br />
number increased to 1,000 <strong>and</strong> 1,200 farmers in 2007/08 <strong>and</strong> 2008/09, respectively. However,<br />
there are several more that are apportioned pieces of l<strong>and</strong> by their relatives/ peers informally.<br />
Yet the scheme is comprised of only 220 ha with each registered farmer allocated just 1.25 acres;<br />
<strong>and</strong> may be feeding a family size of 5 to 6 people each; making a total of some 6,000 or so.<br />
Farmers undertaking Irrigation in various districts<br />
The number of farmers undertaking irrigation in the various irrigation schemes in the various<br />
zones in the country has been increasing, meaning more <strong>and</strong> more families are benefiting from<br />
national irrigation development efforts.<br />
In the Kilimanjaro Irrigation <strong>and</strong> Technical Unit Zone there has been substantial increase in the<br />
number of farmers undertaking irrigation both at district level <strong>and</strong> at schemes level. In<br />
Korogwe District for instance, the number of farmers in irrigation grew from 5,500 in 2004 to<br />
42
10,000 in 2008; an increase of 82%. But at the Ex Lower Moshi <strong>and</strong> Same District the increase has<br />
been much lower, only between 5% <strong>and</strong> 28% respectively [See Table Z1, below].<br />
Table Z1: Number of farmers undertaking Irrigation – in various district schemes<br />
__________________________________________________________________<br />
Name of District<br />
Year<br />
2004 2005 Change<br />
(%)<br />
2006 Change<br />
(%)<br />
2007 Change<br />
(%)<br />
2008 Change<br />
from 2004-<br />
2008<br />
(%)<br />
Korogwe 5,500 6,200 8,500 9,500 10,000 82%<br />
Arumeru 800 - - - - - - 1247 56%<br />
Ex-Lower Mosh1 2,089 - - - - - - 2,200 5%<br />
Lushoto 900 - - - - - 1,416 57%<br />
Same 2000 - - - - - - 2,565 28%<br />
Mwanga 400 - - - - - - 718 79%<br />
At Mombo <strong>and</strong> Kwemaz<strong>and</strong>u schemes, which were visited by the consultant, it was learnt that<br />
the number of farmers undertaking irrigation had increased by some 30% over the years 2004-<br />
2008 <strong>per</strong>iod. But as plot owners did subdivide their plots <strong>and</strong> even hire them out to friends <strong>and</strong><br />
relatives discretely, it was thought that the number of farmers undertaking irrigation there<br />
could be much bigger. A good gender balance was also found in some of the schemes. For<br />
instance at Mombo Irrigation Scheme, for instance – of the present 429 farmers, 233 were<br />
women <strong>and</strong> 196 were men. It is believed that a scheme such as Mombo, with some 430 farmers<br />
could be taking care of food security <strong>and</strong> basic needs for over 2000 family member beneficiaries<br />
(taking the average of 5 members <strong>per</strong> family)<br />
The number of water users associations in the various districts has also grown over time [Table<br />
F 03, below]. In Mwanga <strong>and</strong> Lushoto the number has doubled <strong>and</strong> almost tripled, respectively.<br />
43
Table Z2: Number of farmers undertaking Irrigation – in various individual schemes<br />
Name of Scheme Year Change<br />
(%)<br />
2004 2008<br />
women Men Total<br />
Mombo 310 233 196 429 38%<br />
Kwemaz<strong>and</strong>u 220 300 36%<br />
Ex-Lower Moshi 2,089 2,200 5%<br />
Source: District Councils; MAFC<br />
Table Z3: Water Users Groups <strong>and</strong> their Membership growth* in some of the districts of Zone, between year 2000 & 2008<br />
District<br />
YEARS<br />
2000 2008<br />
Membership gender disposition <strong>and</strong> total in 2008<br />
Number of Number of<br />
WUGs<br />
WUGs<br />
Male Female Total<br />
Lushoto 11 29 707<br />
(50%)<br />
709<br />
(50%)<br />
Same - 17 1,308<br />
1,257<br />
(51%)<br />
(49%)<br />
Mwanga 10 20 464<br />
254<br />
(65%)<br />
(35%)<br />
Arumeru 6 10 994<br />
253<br />
(80%)<br />
(20%)<br />
1,416<br />
2,565<br />
718<br />
1247<br />
Korogwe<br />
Total 27 76 3,473<br />
(58%)<br />
*estimate<br />
Source: District Councils / MAFC<br />
2,473<br />
42%)<br />
5,946<br />
In Mbeya Irrigation zone the increase varied from district to district but ranged from 1,6 to 5%.<br />
(see Figure Z1.1 below<br />
Figure F1.1: Trend of number of farmers undertaking irrigated agriculture in Mbeya<br />
Irrigation & Technical Unit Zone over the past 5 years<br />
Source: Mbeya Region/ MAFC<br />
44
2.1.2 Crop Sub-sector<br />
2.1.2.1 Cash Crop Production Performance<br />
Performance of the cash crop sub-sector in enhancing cash crop production is as depicted under<br />
Tables P1, below.<br />
Table P.1: Cash Crops Production 2006/07 to 2008/09 tons<br />
Crop<br />
Cotton<br />
Coffee<br />
Cashew-nut<br />
Pyrethrum<br />
Sugar<br />
Tobacco<br />
Tea<br />
Sisal<br />
2006/07 2007/08<br />
130,565<br />
51,117<br />
88,213<br />
2,046<br />
290,063<br />
50,784<br />
34,969<br />
30,847<br />
200,662<br />
41,764<br />
99,107<br />
2,300<br />
265,435<br />
57,454<br />
34,165<br />
33,000<br />
Production (Ton)<br />
Change from 2006/07 2008/09 Change from 2007/08<br />
Tons Percent<br />
Tons Percent<br />
70,097<br />
(-9,353)<br />
10,894<br />
245<br />
(-24,628)<br />
6,670<br />
(-804)<br />
2,153<br />
53.7%<br />
(-18.3%)<br />
12.3%<br />
12.4%<br />
(-8.5%)<br />
13.1%<br />
(-2.3%)<br />
7.0%<br />
368,229<br />
68,207<br />
99107<br />
3280<br />
279,851<br />
57402<br />
32008<br />
23752<br />
167,567<br />
26,443<br />
0<br />
980<br />
14,416<br />
(-52)<br />
(-2,157)<br />
(-9,248)<br />
83.5%<br />
63.3%<br />
-<br />
42.6%<br />
5.4%<br />
(-0.09%)<br />
(-6.3%)<br />
(-28.0%)<br />
Average Production<br />
for past 3 years<br />
(2006/07 to 2008/09)<br />
(Tons)<br />
233,152<br />
53,696<br />
95,475<br />
2,542<br />
278,450<br />
55,213<br />
33,714<br />
29,200<br />
Others*<br />
Flowers<br />
330 mil. Stems<br />
From 80 ha<br />
Source: Crops Boards<br />
: Internet<br />
Figure P1.1: Tanzania Cash Crops Production 2006/07 to 2008/09 tons<br />
45
As it will be seen from the Table P1 <strong>and</strong> Figure P1.1, the sector has done very well over the past<br />
three years, for some of the major traditional exports. Cotton in particular has been doing<br />
extremely well. Its production has increased very substantially over the past three years. Thus<br />
its total production leapt from about 130,000 tons in 2006/ 07 to 0ver 200,000 tonnes in 2007/08;<br />
<strong>and</strong> jumped to even higher heights in 2008/ 09, reaching nearly 370,000 tonnes. Average for the<br />
three years was about 233,000 tonnes. The annual <strong>per</strong>cent increase was about 54% in 2007/08;<br />
but then this jumped to over 83% in 2008/09, This was certainly a commendable effort by the<br />
sector.<br />
A number of other traditional export crops, in particular cashew nut, coffee <strong>and</strong> pyrethrum<br />
have also registered major success. Cashew nut production, for instance jumped from about<br />
88,000 tonnes of raw cashew-nut in 2006/07 to nearly 100, 000 tonnes in 2007/08; an increase of<br />
12%. This was a good increase, though it is yet to reach the likes of year 2000/01 when<br />
production reached 122,300 tons; but it is of course far better than the 39,300 tons achieved<br />
nation ally in 1992/93. Even the coffee crop which had been on the decline for many years in<br />
the past, did have substantial increase in the last three years; it increased from about 51,000<br />
tons in 2006/07 to 68,207 tons in 2008/09 (an increase of over 33% over a two year <strong>per</strong>iod or<br />
average increase of about 17%.<br />
Pyrethrum is another cash cop that depicted steady increase, from 2,046 tons in 2006 this<br />
increased to 2,300 tons <strong>and</strong> 3,280 tons, in 2007/08 <strong>and</strong> 2008/09, respectively; representing<br />
annual increase of 12% <strong>and</strong> about 43%, respectively.<br />
However, some of the other cash crops, including tea <strong>and</strong> tobacco have not had steady increase,<br />
Thus, Tobacco after increasing from 50,784 tons in 2006/07 to 57,454 tons in 2007/08 (an increase<br />
of 13%), did decline slightly by 1% in 2008/09. Tea did exhibit a slight annual decline over the<br />
three year <strong>per</strong>iod. It started off with 34,969 tons, declined to 34,969 tons ( 2.3 % decrease) in<br />
2007/08; <strong>and</strong> to 32,008tons (a decrease of 6.3 %) in 2008/09<br />
Overall, the sector’s crop production <strong>per</strong>formance over the past three years has been good.<br />
The <strong>per</strong>formance of the sector in food crops is provided under section 2.2 below, on the<br />
sector’s ability in ensuring national food security<br />
2.1.2.3; Performance of the Crop Sub-sector at Zonal/ Regional/ District Level<br />
The Crop-subsector <strong>per</strong>formance in the districts visited is illustrated by selected districts (from<br />
different zones) as provided below.<br />
a) Lake Zone<br />
The Crop-subsector <strong>per</strong>formance in the districts visited is illustrated by selected districts <strong>and</strong><br />
irrigation schemes in various parts of Tanzania as illustrated below.<br />
Maize, paddy, cassava, legumes <strong>and</strong> sorghum are grown as food crops <strong>and</strong> cotton <strong>and</strong> yellow<br />
grams grown as cash crops by mainly smallholder farmers.<br />
46
In the Western Cotton Growing Areas, which produces most of the cotton in Tanzania, <strong>and</strong><br />
comprising Mwanza, Shinyanga, Mara, Kagera, Tabora <strong>and</strong> Singida regions, had registered<br />
mixed growth in the past six years; as <strong>per</strong> Table D1 <strong>and</strong> Figure D1. 1 below.<br />
Table D1: Cotton production trend in Western Cotton<br />
Growing Zone<br />
S/N Year Production (bales)<br />
1. 2003/04 263,101<br />
2.<br />
3. 2004/05 640,939<br />
4. 2005/06 709,884<br />
5. 2006/07 244,821<br />
6. 2007/08 378,701<br />
7. 2008/09 693,645<br />
Figure D1.1: Cotton production trend in Western Cotton Growing Zone<br />
As it will be seen in both the table <strong>and</strong> the figure, annual production has fluctuated over the 2003/ 04 to<br />
2008/09, with the lowest production being in 244,821 bales ; while the highest was in 2005/06 when<br />
production reached 709,884 bales (each bale = 181kh.<br />
Box 1<br />
. Key Issues for Lake Zone<br />
i. Low practice of irrigation despite of having Lake Victoria just nearby. It is very costly to pump water from the lake<br />
upstream <strong>and</strong> let it flow by gravity to irrigated farms because of high price of fuel leave aside high initial capital costs of<br />
building irrigation infrastructure.<br />
ii. Low usage of agricultural inputs e.g. fertilizers, improved seeds <strong>and</strong> agrochemicals. High prices make it extremely<br />
difficult for smallholders to afford. For instance the price of industrial fertilizer in 2008/09 season was around Tsh.<br />
100,000 <strong>per</strong> bag <strong>and</strong> improved seeds around Tsh. 3,000 <strong>per</strong> kilogram.<br />
iii. Inadequate number of agricultural inputs stockists. There are only 79 in Mwanza <strong>and</strong> mainly in towns making it difficult<br />
to access inputs in villages.<br />
iv. In spite of existence of a large number of livestock in the region, farmyard manure are solemnly used to curb widespread<br />
infertile soils.<br />
v. Inadequate l<strong>and</strong> for investment in agriculture. L<strong>and</strong> available is approximately 3.3 hectares <strong>per</strong> household or 0.6 hectares<br />
<strong>per</strong> head.<br />
Recommendations<br />
i. The government should support strongly introduction of irrigation projects/interventions in the region through DADPs<br />
(including use of NIDF <strong>and</strong> DIDF)<br />
ii. The government should exp<strong>and</strong> its inputs subsidy programme through voucher system to cover all inputs in the whole<br />
region apart from the current input voucher for paddy <strong>and</strong> maize in Geita <strong>and</strong> Sengerema districts <strong>and</strong> vouchers for seeds <strong>and</strong><br />
insecticides to all cotton farmers.<br />
iii. Agricultural intensification for increased productivity should be sought rather than agricultural expansion due to inadequate l<strong>and</strong> for<br />
agriculture<br />
47
) Eastern Zone<br />
In the two districts of Kilombero <strong>and</strong> Mvomero in the Eastern Zone, the dominant cash crop is<br />
sugarcane grown under contractual arrangement between small scale farmers <strong>and</strong> private<br />
investors; where the production is in the form of ‘nucleus estate’, existing at Mtibwa Sugar<br />
Estate <strong>and</strong> the Kilombero Sugar Estate. The sugar cane comes from both the fields owned/<br />
o<strong>per</strong>ated by the entrepreneur <strong>and</strong> from small holder growers who produce this on smallholding<br />
l<strong>and</strong> around/ adjacent to the entrepreneur’s farm; together constituting what is called outgrowers<br />
<strong>and</strong> in-growers, respectively. The contractual arrangement enables the small holders to<br />
access essential services, which include farm o<strong>per</strong>ations (including ploughing, harvesting <strong>and</strong><br />
crop transportation to factory); processing, as well as market for the cane sugar produced. This<br />
more or less uninterrupted sugar cane contract farming has contributed substantially in<br />
reducing income poverty, particularly to the families of participating farmers/ association.<br />
These farmers <strong>and</strong> others not in the contract farming are also engaged in production of food<br />
crops, including paddy, maize, banana, cassava, sweet potatoes <strong>and</strong> pulses (see section 2.2<br />
below). Some of the food crops, particularly paddy grown under irrigation in irrigation schemes<br />
are also a good source of cash to the participating farm families <strong>and</strong> those others providing<br />
related services. Big irrigation schemes like the Dakawa Irrigation Scheme in Mvomero District,<br />
boasting 2,500 ha of irrigated l<strong>and</strong> is indeed a very important source of income to the<br />
participating small scale producers <strong>and</strong> their families.<br />
Nevertheless, the stated cash crops by the respective two district councils are as shown in the<br />
Figure D1.2 for Kilombero <strong>and</strong> D1.2 for Mvimero.<br />
As it is seen in the figures below, production for the main crop, sugarcane, in Kilombero<br />
District shot up to over 500,000 tonnes in the 2007/08 to 2008/09 <strong>per</strong>iod (up from just about<br />
200,000 tonnes in 2006/07 - it is actually an increase of over 100 %); which is indeed a success<br />
story.<br />
In Mvomero District production of this main cash crop fluctuated over the three year <strong>per</strong>iod.<br />
Thus from a high of some 350,000 tonnes in 2006/07, the cane production dived down to about<br />
200,000 tonnes 2007/08; but then jumped high to some 450,000 tonnes in 2008/09. Again this is<br />
a big success; to be able to reverse what appeared as a downward tendency so overwhelmingly.<br />
Figure D1.2: Cash Crop Production Trend in Kilombero District ( Eastern Zone) - ‘000 Tons<br />
48
Figure D1.3: Cash Crops production trend in Mvomero District, Morogoro Region, <strong>and</strong> Eastern Zone<br />
b) Southern Highl<strong>and</strong>s Zone<br />
In Mbeya Rural in the Southern Zone, the stated cash crops by the District council are coffee,<br />
pyrethrum <strong>and</strong> sunflower. Over the three year <strong>per</strong>iod (2006/07 to 2008/09) the production of<br />
all the three crops has been increasing annually. The increase for Pyrethrum from 2007/08 to<br />
2008/09 was most dramatic, likely in part, as a result of the pyrethrum processing factory now<br />
revived/ re-established in the neighbouring Iringa Region. In a space of one year, the<br />
production moved from about 1,000 tons of pyrethrum to over 19,000 tonnes - increase of<br />
nearly 1,800 %! It is really another success story for the sector at District Level.<br />
Figure D1.3: Cash Crop Production Trend in Mbeya Rural District ( Southern Highl<strong>and</strong>s Zone) - Tons<br />
2.1.3: Performance of Sector in Input <strong>and</strong> Equipment Supply to Farmers<br />
2.1.3.1 Fertilizer supply<br />
In recent years, the crop –subsector has managed to get fertilizer suppliers (private sector <strong>and</strong> a<br />
government agency) to import more fertilizer, though the amount has shown some fluctuation.<br />
49
However, it has managed to increase the amount of fertilizer provided on subsidy by the<br />
government (Table F1 below). Since 2004, the government has been providing fertilizer subsidy<br />
to farmers in target regions - regions known to be more opportune for producing surplus food<br />
to the nation , which have mostly been the Southern Highl<strong>and</strong>s regions though the number has<br />
been exp<strong>and</strong>ed to include some in northern <strong>and</strong> western zone. The system it has adopted<br />
recently to improve subsidized fertilizer to farmers is the use of voucher system, under which<br />
the farmer would take his district level issued voucher/ coupon <strong>and</strong> go to his nearby distributor<br />
to get the targeted amount <strong>and</strong> type after paying the difference between the market price <strong>and</strong><br />
the level of subsidy by government.<br />
Total fertilizer requirement nationally is put 385,000 tons. However, that target has not been<br />
reached for a long time, <strong>and</strong> in the past three years the supply has fluctuated. Thus while in<br />
2006/07 the supply was nearly 285,000 tons (74% of target - quite commendable), in the<br />
following year available supply fell drastically to just about 111,000 tons (29% of target), largely<br />
due to doubling of fertilizer prices on the global market. In the following year (2008/09) the<br />
availability went up again largely due to a lot more resources that the government made<br />
available to the Agricultural Inputs Trust Fund (AITF), the fund administering the government<br />
input subsidy.<br />
Thus about 238,000 tons fertilizer was available, which was about 62% of requirement. Out of<br />
this amount some 141,000 was subsidized fertilizer that was purchased by 737,000 farmers in<br />
53 districts (about half of Tanzania’s districts), through the voucher system. In fact due to far too<br />
high prices of the fertilizer on the market (particularly DAP), the small-scale farmers hardly<br />
buy any fertilizer on the free market; they are dependent on the subsidized fertilizer; <strong>and</strong> even<br />
for this some of them do not even buy as they see the subsidized fertilizer still too costly. As a<br />
result several of farmers visited during the study were found to be using no fertilizer in their<br />
crop production. In some cases the district appointed distributors were too far from the<br />
particular area. Many distributors do not like o<strong>per</strong>ating their business in the rural areas due to<br />
what they <strong>per</strong>ceive as being costly (high transport charges, largely due to rough roads as well as<br />
distance). Some even <strong>per</strong>ceive security as being inadequate in such areas.<br />
The issue here is really how to enable farmers obtain adequate amount of fertilizer at<br />
affordable price, <strong>and</strong> at closer-by input shop. Even for those farmer that manage to lift their<br />
subsidized fertilizer pack , this is just for one acre (<strong>and</strong> provided under one input voucher).<br />
Table F1: Inputs requirement, availability <strong>and</strong> amount subsidized to farmers 2006/07 to 2008/09<br />
Input type<br />
2006/07 2007/08 %<br />
2008/09 % Change<br />
Target Achievement Target Achievement Change Target Achievement<br />
Fertilizer (Tons) 385,000 284,925 385,000 111,530 -60.9 385,000 237,894 61.8%<br />
Fertilizer Subsidy 108,703 108,703 89,820 81,980 -24.6 na 141,050 -<br />
(Tons)<br />
Seeds (Tons) 29,640 12,119.8 29,640 16,392 35.2 na na na<br />
Chemicals:<br />
1,692,048 1,269036 1,844,617.3 1,383,463 9 na na na<br />
Liquids (liters)<br />
Powder (Tons) 1,472 1,103.61 4,296 3,222 192 na na na<br />
Source: MAFC Budget Speech.<br />
50
2.1.3.2 Seed supply<br />
As <strong>per</strong> Table F1, above, the crop-subsector has been attracting supply of improved seed, some<br />
which is subsidised by government much in the same way as in the case of fertilizer<br />
The estimated seed dem<strong>and</strong> for cereals, legumes <strong>and</strong> oil seeds is 30,000 MT <strong>per</strong> year. In<br />
2008/2009, the improved seed availability was 11,056.07 MT equal to 36.8 <strong>per</strong>cent of the<br />
estimated seed requirement. <strong>Of</strong> the available seeds, public institutions contributed 544.75 MT;<br />
Quality Declared Seed (QDS) producers contributed 300.4 MT <strong>and</strong> private sector contributed<br />
10,511.32 of which 5,163 MT were imported. The seed subsidy program sold 7,180MT of<br />
improved seeds to farmers through voucher system. This was equal to 24 <strong>per</strong>cent of seed<br />
requirement.<br />
2.1.3.3 Tea <strong>and</strong> coffee seedlings<br />
In 2008/2009 season a total of 7,830,000 improved tea seedlings were produced by 141 farmer<br />
groups with 2,012 farmers in the 11 districts under subsidy program. The production was<br />
supported by Tanzania Smallholder Tea Development Agency (TSHTDA). This was equal to 98<br />
<strong>per</strong>cent of annual target of 8,000,000 tea seedlings. Likewise a total of 9,570,846 of improved<br />
coffee seedlings were produced by 695 farmer groups in the districts under the support of<br />
Tanzania Coffee Research Institute – TaCRI. The amount of Coffee seedlings produced was<br />
equal to 96 <strong>per</strong>cent of the annual target of 10,000,000 seedlings.<br />
2.1.3.4 Agrochemicals<br />
Through Cotton Board, 2,050,000 acre packs of agrochemical for cotton crop were purchased.<br />
Out of the acre packs purchased 1,141,758 acre packs were distributed to agro dealers of which<br />
556,772 acre packs were purchased by the farmers’ equivalent to 48.7 <strong>per</strong>cent of sales. Also<br />
386,649 litres <strong>and</strong> 154 tons of cashew agrochemicals were purchased <strong>and</strong> distributed to farmers<br />
through subsidy program in 20 districts of Mtwara, Lindi, Ruvuma, Pwani <strong>and</strong> Dar es Salaam. a<br />
total of 153,968.8 kg <strong>and</strong> 386,658.2 Litres of agro –chemical were distributed in cashew-nut<br />
growing regions as follows: 88,976.6 kgs <strong>and</strong> 242,251 litres went to Mtwara region; Lindi 58,000<br />
kgs <strong>and</strong> 94,069.3 litres; Ruvuma 35,463.9 litres; Pwani 742.2 kgs <strong>and</strong> 13,919.8 litres <strong>and</strong> Dar es<br />
Salaam 6,250 kg <strong>and</strong> 945 litres respectively.<br />
2.1.3.5 Agro-mechanization<br />
a) At National<br />
Agro-mechanization is an area of great concern in the sector. Smallholder farming which is<br />
dominant in the country is characterized by low level mechanization. Crop production relies<br />
heavily on manual labour with the h<strong>and</strong> hoe as the main tool; <strong>and</strong> this sets major limitations on<br />
the area of crops that can be grown using family labour. Many households manage between 0.2<br />
<strong>and</strong> 2.0 ha <strong>per</strong> year, which limits very considerably crop production <strong>and</strong> productivity thus,<br />
<strong>per</strong>petuating rural poverty. Commercializing of smallholder agriculture <strong>and</strong> accelerating<br />
adoption of improved farming technology are critical towards achieving the MKUKUTA targets<br />
51
on reduction of income poverty <strong>and</strong> attainment of national food security; as well as<br />
achievement of Tanzania Development Vision 2025 targets that envisage raising the general<br />
st<strong>and</strong>ard of living of Tanzanians by ensuring food security, improving income levels <strong>and</strong><br />
increasing export earnings. Given the generally abundant l<strong>and</strong> resource, efforts to increase<br />
agricultural production <strong>and</strong> productivity should include technologies for both exp<strong>and</strong>ing<br />
cultivated l<strong>and</strong> area <strong>and</strong> intensified utilization of the existing cultivated area; by among other<br />
things, applying increased, appropriate mechanization technology.<br />
Table T1: Number of tractors <strong>and</strong> related equipment in Tanzania regions<br />
Region<br />
Bigger<br />
Tractors<br />
Plough Hurrow Seeder Combine<br />
harvester<br />
Trailer<br />
Arusha 979 930 143 52 38 229 11<br />
D'Salaam 69 47 24 2 0 50 2<br />
Dodoma 719 389 4 0 0 99 99<br />
Iringa 627 314 91 14 0 125 12<br />
Kagera<br />
114<br />
48 9 0 0 16 13<br />
Kigoma 33 11 6 1 0 13 22<br />
K'njaro 868 387 56 47 25 346 21<br />
Lindi 74 46 12 8 1 37 60<br />
Manyara<br />
824<br />
622 137 49 0 348 2<br />
Mbeya 364 467 131 15 55 178 428<br />
Morogoro 1,191 707 244 21 0 82 75<br />
Mtwara 86 50 20 1 1 50 13<br />
Mwanza 311 120 18 11 0 144 19<br />
Coast 112 82 35 0 5 48 10<br />
Rukwa 78 66 27 1 1 58 17<br />
Ruvuma 165 36 27 0 25 27 20<br />
Singida 111 61 13 0 0 55 47<br />
Shinyanga 608 488 23 2 0 201 3<br />
Tabora 199 37 30 11 0 87 8<br />
Tanga<br />
296<br />
88 62 0 1 147 14<br />
Mara 177 70 0 0 0 30 14<br />
JUMLA 8,005 5,066 1,112 235 152 2,370 910<br />
P/Tillers<br />
Yet, development of mechanization in the country has been quite slow. Table T1, above gives<br />
the number of tractors <strong>and</strong> related equipment in the country, including old, non-o<strong>per</strong>ating ones.<br />
A simple calculation would show that the number of tractors <strong>per</strong> farming household (though<br />
not all tractors are in the rural areas) would be about one tractor <strong>per</strong> over 600 households; <strong>and</strong> if<br />
there are even 3 farmers <strong>per</strong> average farm family, this would translate to one tractor <strong>per</strong> over<br />
1,800 farmers. The respective figure for power tillers (up to 2007/08) would be one power tiller<br />
<strong>per</strong> almost 5,400 households or one power tiller <strong>per</strong> over 16 farmers.<br />
This is a very unpleasant situation, condemning the farmer to the laborious, back breaking,<br />
inefficient h<strong>and</strong> hoe. Besides, some 20% of the tractors are about 30 years old, while another<br />
20% are about 40 years old. In other words only about 50 % of the tractors are functional (see<br />
Figure T1.1 below.<br />
52
Figure T1.1 : Age of tractors as determined in 40 districts of Tanzania<br />
Table T2: Number of new tractors (with complementary equipment) required in the country <strong>per</strong> year<br />
Tractor requieren to: Percent Área to be opened up<br />
for cultiva tión <strong>per</strong> year<br />
(ha)<br />
Area cultivated by one<br />
tractor <strong>per</strong> year (ha)<br />
Number<br />
Tractors<br />
of<br />
Cater for increased area to reach 1.5<br />
million hectares of cultivated l<strong>and</strong><br />
Provide for replacement of worn out/ old,<br />
non-o<strong>per</strong>ating tractors<br />
30% 112,500 120 938<br />
30% 120 281<br />
Cater replace seemingly decreasing rural 30% 120 281<br />
labour force (as many youths now stream<br />
to cities in search of green pastures)<br />
Total (Tractors) 1,500<br />
Source: MAFC<br />
Tractor importation rate, especially for the bigger tractors (as against power tillers) has been far too<br />
low, compared to requirement. Table T3, below shows there has been some improvement in<br />
importation from 272 tractors in 2004 to 445 in 2006 (an increase of 63%); but then there was very<br />
modest increase thereafter, reaching 464 tractors in 2007 (increase of 4%).<br />
Table T3: Annual Tractor Importation : 2004 to 2007<br />
Year 2004 2005 2006 2007<br />
Number of<br />
Tractors<br />
Source: MAFC<br />
272 356 445 464<br />
53
Figure T.1.2: Annual Tractor imports 2004 to 2007<br />
Furthermore, as of 2006, it was estimated that there were over 14 million h<strong>and</strong> hoes in use,<br />
about 585,000 animal drawn ploughs <strong>and</strong> 1,300,000 oxen. On average 2,000,000 h<strong>and</strong> hoes <strong>and</strong><br />
20,000 animal drawn ploughs are imported every year. According to MAFC the country needs<br />
between 30,000 to 40,000 animal drawn ploughs <strong>and</strong> 1,500 to 1,800 tractors annually in order to<br />
cater for farm power needs for satisfactory agricultural growth. Tractors, draft animal power<br />
implements <strong>and</strong> h<strong>and</strong> tools are now almost all imported; from various countries, including<br />
Europe, China, India, South Africa <strong>and</strong> Kenya. Local manufacture of such tools, implements<br />
<strong>and</strong> machinery hardly exists now, after the collapse of the Ubungo Farm Implements (UFI) <strong>and</strong><br />
Zana Za Kilimo, Mbeya (ZZK)<br />
Several constraints have been pointed out as ham<strong>per</strong>ing mechanization development in Tanzania; the<br />
main ones being:<br />
Low purchasing power of most small scale farmers, contributed in part by generally the low<br />
prices the farmer has been receiving for his produce<br />
High <strong>and</strong> continually rising cost of agricultural machinery, making them very much un-affordable<br />
Lack of agricultural credit; banks have not been too ready to provide agricultural credit for<br />
purchase of agricultural inputs, including agricultural machinery - small scale farmers cannot<br />
afford security of loan as they do not really own assets that can be put up for loan security.<br />
Banks in addition view agricultural production as an insecure place to put their money in. as the<br />
production is overwhelmingly dependent on rain, which is itself getting increasingly unreliable,<br />
both in quantity <strong>and</strong> distribution.<br />
Besides there is lack of well trained o<strong>per</strong>ators <strong>and</strong> mechanics for agricultural machinery,<br />
There is lack of suitable machinery packages for main agricultural o<strong>per</strong>ations.<br />
Imported machinery are increasingly being of poor quality (fake ones get deliberately mixed with<br />
quality ones, both of which appear very similar on the face of it). This situation if not arrested<br />
quickly could become very costly to the nation; it may even drive small farmers from agriculture<br />
as they would not tolerate continuing purchase of poor tools that breakdown in no time or do not<br />
work at all, <strong>and</strong> have no guarantee, either. There is need to <strong>revis</strong>it the work that in the past done<br />
by the (then) Arusha based Agricultural Machinery Testing Unit, which had been doing very<br />
54
good work on fending fake farming equipment off the market. A strong legislation is badly<br />
needed that will come with very stiff punishment for offenders.<br />
The <strong>Ministry</strong> of <strong>Agriculture</strong> <strong>Food</strong> Security <strong>and</strong> Coo<strong>per</strong>atives (MAFC), working together with various<br />
stakeholders prepared the Tanzania Agricultural Mechanization Strategy (TAMS), a framework for<br />
enhancing the contribution of mechanization to the development process of the agricultural sector in<br />
achieving the national development.<br />
Oxen-ploughing in progress<br />
[Picture; courtesy of KATC]<br />
Paddy farmers hard at work with h<strong>and</strong>hoe<br />
[Picture; courtesy of KATC]<br />
The Main Features of TAMS were eight strategic actions, which were:<br />
o Improving access <strong>and</strong> availability of mechanization inputs<br />
o Commercialization of agriculture through mechanized farming<br />
o Promoting agro processing <strong>and</strong> rural based agro industries<br />
o Improving livelihoods <strong>and</strong> l<strong>and</strong> management through conservation agriculture<br />
o Improve dissemination of mechanization technologies to enhance up-take<br />
o Improving financing of agricultural mechanization<br />
o Improving policy, legal <strong>and</strong> regulatory environment for agricultural mechanization<br />
o Cross-cutting <strong>and</strong> cross-sectoral issues<br />
Some of the activities contained in the strategic plan was setting up of mechanization centres<br />
in strategic areas. This would be a good thing of started/ managed by private sector, including<br />
well organized primary coo<strong>per</strong>atives or farmers associations or even ex-VETA organized<br />
companies. Past attempts to start public –funded <strong>and</strong> run mechanization centres did not<br />
produce good results - may be due to poor or little devoted management. [ There were the block<br />
mechanization schemes of Lake Zone <strong>and</strong> others, which failed totally].<br />
Caution is also needed when deciding which farm machinery type to order. For instance to<br />
order a large tractor just to o<strong>per</strong>ate 100 ha in just one o<strong>per</strong>ation (ploughing) may not pay unless<br />
the crop is of very high value, like flowers. In place like USA it has been reckoned that one<br />
tractor would pay its o<strong>per</strong>ational <strong>and</strong> fixed costs if it has available to it some 400 to 500 ha in<br />
one or adjacent blocks; <strong>and</strong> working almost continually for a whole year doing various farming<br />
o<strong>per</strong>ations stage by stage. Thus for most small scale farmers (<strong>and</strong> groups) the power tiller, <strong>and</strong><br />
also the oxen driven plough(in places where feed is available) could just be the only answer<br />
despite their limitation in breaking hard pan soils like the ‘catena’ type. Therefore the current<br />
drive by the government to promote <strong>and</strong> supply power tillers to small farmers/ farmer groups<br />
55
seems in order; <strong>and</strong> ultimately the target should be to support their production, especially by<br />
the private sector, in the country in order to assure quality <strong>and</strong> easiness of availability.<br />
Nevertheless, TAMS has not been able to make much headway in implementation, due to lack of access<br />
to required resources. Perhaps with the coming of’ ‘Kilimo Kwanza’ programme there could be<br />
much more funds in implementing the TAMS, within the framework of ASDP. Already we are<br />
seeing power tillers being strongly promoted.<br />
b) District Level Observations<br />
Farm machinery <strong>and</strong> equipment situation in one of the districts visited is as shown below<br />
Table E1: Meru District<br />
Type of Equipment Actual Dem<strong>and</strong> Available Deficit Deficit as<br />
Percent of<br />
Dem<strong>and</strong><br />
Tractor 305 250 55 18%<br />
Power Tillers 74 24 50 67%<br />
Mould board Plough 305 124 181 59%<br />
Disc plough 605 233 372 61%<br />
Ox-cart 635 520 111 17%<br />
Trailer 455 95 360 79%<br />
Meru District is considered to be one of the districts with better supply of farm machinery <strong>and</strong><br />
equipment in the country. Yet it still has substantial deficits of various types of these, ranging<br />
from nearly 20% to almost 80%, as seen in Table E1 above. In districts, it was reported, one can<br />
hardly see a tractor; <strong>and</strong> even power tillers had not reached the region up to 2008/09 - a few<br />
are planned for delivery under the government’s subsidy programme.<br />
2.2: Performance of Sector in Ensuring National <strong>Food</strong> Security<br />
2.2.1 Preamble<br />
The majority of the poor (as much as 90%) live in the rural areas, <strong>and</strong> almost all their livelihood<br />
is dependent on agriculture. These also constitute over 70% of the country’s population. Thus<br />
when talking about ensuring food security it is really talking about this rural poor having<br />
adequate food, from own production <strong>and</strong>/ or purchase from own incomes. There are also some<br />
urban poor, though these are much fewer than in the rural areas.<br />
2.2.2 National <strong>Food</strong> Production as against Requirement<br />
a) Cereals <strong>and</strong> non- cereals<br />
National level food crop production final forecast for 2007/08; <strong>and</strong> food crop production<br />
preliminary forecast for 2008/09 are as provided under Table C1, below.<br />
56
Table C1: National Level <strong>Food</strong> crop production for 2007/08 <strong>and</strong> for 2008/09; as against respective requirements <strong>and</strong><br />
shortfall (gap)<br />
Cereals 2007/08 2008/09<br />
Maize<br />
Sorghum/<br />
Millet<br />
Rice Wheat Total<br />
cereals<br />
Maize<br />
Sorghum/<br />
Millet<br />
Rice Wheat Total<br />
cereals<br />
Production 3,555,833 1,064,196 875,119 92,399 5,587,547 3,424,984 898,869 843,556 97,901 5,265,309<br />
Requirement 4,048,633 1,507640 693,933 198,097 6,448,303 4,131,782 1,531,816 710,754 204,156 6,578,508<br />
Gap (-)<br />
/ Surplus (+) - 492,800 - 443,443 181,186 -105,698 -860,756 -706,797 -632,947 132,802 -106,256 -1,313,199<br />
Prod. as <strong>per</strong>cent<br />
of Requirement<br />
87.8% 70.5% 126.1% 46.6% 86.6% 83.0% 58.7% 118..7% 47.7% 80.0%<br />
Non-Cereals Pulses Banana Cassava Potatoes Total Non-<br />
Cereals<br />
Pulses Banana Cassava Potatoes Total<br />
Non-<br />
Cereals<br />
Production 1,125,503 982,366 1,797,453 1,379,46<br />
6<br />
5,284.788 1,085,448 1,071,923 1,982,718 1,516,139 5,656,227<br />
Requirement 642,838 711,692 1,776,929 758,218 3,889,677 654,840 733,176 1,830,567 781,106 3,999,688<br />
Gap (-) / Surplus<br />
(+) 482,665 270,674 20,524 621,248 1,395,111 430,608 338,747 152,151 735,033 1,656,539<br />
101% 181.9% 135.9% 165.7 146% 108.3% 194.1% 141.4%<br />
GRAND<br />
TOTALS<br />
Cereals<br />
Production as 175.1% 138.0%<br />
<strong>per</strong>cent of<br />
requirement<br />
TOTALS Cereals Noncereals<br />
Noncereals<br />
GRAND<br />
TOTAL<br />
Production 5,587,547 5,284,788 10,872,336 5,265,309 5,656,227 10,921,536<br />
Requirement 6,448,303 3,889,677 10,337,981 6,578,508 3,999,688 10,578,196<br />
Gap (-) / Surplus<br />
(+) -860,756 1,395,111 534,355 -1,313,199 1,656,539 343,340<br />
Prod as % of<br />
Req. 86.6% 135.9% 105.2% 80.0% 141.4% 105%<br />
From the data available from the National <strong>Food</strong> Security Division <strong>and</strong> now presented under<br />
Table C1 above, (<strong>and</strong> also the food production trend data for the past three years 2006/07 to<br />
2008/09, presented under Table C3 <strong>and</strong> Figure C3.1 below), it would seem that, the sector is<br />
able to produce enough food to ensure national food security, given the total production<br />
tonnage <strong>and</strong> total tonnage requirement. For instance, in 2007/09 total food crop production was<br />
some 5% above requirement, <strong>and</strong> was almost the same in 2008/09. Even in the Table P2 <strong>and</strong><br />
Figure P2.1 below shows total food tonnage steady at nearly 11 million tons over the past three<br />
years (2006/07 to 2008/09).<br />
However, when one separates the food production <strong>and</strong> requirement in terms of cereals <strong>and</strong><br />
non-cereals, the picture changes. Thus while total cereals food available in 2007/08 was 87% of<br />
total cereal requirement, non- cereal production was about 136% of national requirement. In<br />
2008/09 the respective figures were 80% <strong>and</strong> 141% respectively. In both years cereals<br />
production fell short of national requirement, but more so in 2008/09. In fact cereal requirement<br />
have never been met in recent years; this food category seems not keeping up with national<br />
57
equirement. In Table C2 below, it is seen that while cereals production fell by about 6% in<br />
2008/09 (compared to 2007/08), cereals requirement increased by 2%. National cereal<br />
requirement is of course bound to grow, mostly as a result of natural increase in population<br />
growth.<br />
Table C2: Change in Total Production <strong>and</strong> Total Requirement over 2007/08 to 2008/09<br />
<strong>Food</strong> Category<br />
Total Production<br />
(Tons)<br />
Change<br />
Total Requirement<br />
(Tons)<br />
Change<br />
2007/08 2008/09 Tons % 2007/08 2008/09 Tons %<br />
Cereals 5,587,547 5,265,309 -322,238 (-5.8%) 6,448,303 6,578,508 130,205 2.0%<br />
Non-Cereals 5,284,788 5,656,227 +371,439 7.0% 3,889,677 3,999,688 110,011 2.8%<br />
Cereals have also been imported to fill in part of the local dem<strong>and</strong> deficit (Table C3, below).<br />
Maize imports have not been big in recent years; it was only in 2006 when over 250,000 tons<br />
were imported, after which this cereal import has remained below 20,000 tons. However, there<br />
have been very substantial imports for wheat <strong>and</strong> to a lesser extent rice in the same <strong>per</strong>iod.<br />
Thus wheat imports averaged about 600,000 tons over the past four years (2005 – 2008), with a<br />
peak of 813,513 tons in 2007. Rice imports averaged about 67,000 tons in the same <strong>per</strong>iod, with a<br />
peak of over 90,000 tons in 2006.<br />
Orange fruit farm inter-planted with maize: H<strong>and</strong>eni District (Tanga<br />
Region)<br />
A progressive small scale farmer <strong>and</strong> hired labour at work in<br />
paddy field at Lekitatu Scheme area, Arumeru District (Arusha Region)<br />
58
a) Place of Livestock Products in <strong>Food</strong> Security<br />
Livestock is playing a major role in national food security. Almost the entire population of<br />
traditional livestock kee<strong>per</strong> depends almost entirely on the livestock products from their<br />
livestock for their livelihood; from food (especially, milk - their daily food; <strong>and</strong> to a lesser<br />
extent meat -especially from their small stock). Livestock milk is also a very important food<br />
item for all young children <strong>and</strong> their mothers. Milk consumption in the country is still very<br />
low. Per capita consumption of milk <strong>per</strong> year is currently only 41 litres (or 0.1 litre <strong>per</strong> day).<br />
There are several reasons advanced for this low level of consumption for such an important<br />
food diet. These include poor marketing infrastructure, making it difficult to move milk from<br />
the rural, remote areas where it is produced to the urban consumers.<br />
According to MLDF, only about 10% of milk produced reaches urban centres; <strong>and</strong> this is where<br />
good purchasing power is. As a result there are substantial milk imports (in form of liquid <strong>and</strong><br />
powder) into the country, from Asian, European <strong>and</strong> from the EAC <strong>and</strong> SADC countries; <strong>and</strong><br />
these are easily seen in su<strong>per</strong> markets <strong>and</strong> retail shops. MLDF has intention almost double the<br />
<strong>per</strong> capita milk consumption; from 41litres presently, to at least 80 litres. One other limitation<br />
on milk consumption is the rapidly rising prices. For instance, retail price of one quarter-litre<br />
pack of Tanga Fresh milk has risen from Tshs 500 at beginning of this year (2009) to Tshs 1,000<br />
in November 2009 - a rise of !00%; the urban poor can hardly afford it. Milk production trend will<br />
be discussed under section 2.3, below.<br />
2.2.3 <strong>Food</strong> Crops Production Trend - at National Level: 2006/07 to 2008/09<br />
The <strong>per</strong>formance of the sector in food crops production is as presented under Table P2, below.<br />
The production trend is a mixed one, with some crops increasing slightly in one year, dropping<br />
in the next, <strong>and</strong> so on it is some kind of small fluctuations. For example maize increased by 4%<br />
in 2007/09. But the dropped by same in 2008/09. Similarly for Paddy, which increased by 9% in<br />
2007/08; only to drop by 4% in the following year. In a way this situation is likely a reflection of<br />
the country’s food crop production dependence on rainfall, which itself is really not<br />
dependable, particularly in recent years, in which climate change may be making things even<br />
worse for rain-fed agriculture. <strong>Food</strong> production situation (<strong>and</strong> therefore the prospects of achieving food<br />
security at district level) is presented under section 2.2.5, below.<br />
Table C3: <strong>Food</strong> Crops Production at National Level 2006/07 to 2008/09 - (‘000 Tons)<br />
Crop 2006/07 2007/08 Percent change<br />
from Yr 2006/07<br />
2008/09 Percent change<br />
Maize 3,423.025 3,555.833 4% 3,424.984 ( -4%)<br />
Paddy 805.067 875.119 9% 843.556 ( -4%)<br />
Wheat 109.531 92.399 (- 16%) 97.901 6%<br />
Sorghum 941.536 1,064.196 13% 898.869 ( - 15%)<br />
Cassava 2,052.760 1,797.453 ( -12%) 1,982.718 10%<br />
Legumes/ Beans 1,049.919 1,125.503 7% 1,085.448 ( -3%)<br />
Banana 1,169.151 982.366 ( -16%) 1,071.923 9%<br />
Sweet Potatoes 1,396.354 1321.595 ( -5%) 1,516.139 15%<br />
Total 10,947.343 10,814.464 (-1%) 10,921.538 1%<br />
Figure C3.1: <strong>Food</strong> Crops Production at National Level 2006/07 to 2008/09 - (‘000 Tons)<br />
from Yr 2007/08<br />
59
2.2.4 <strong>Food</strong> Imports 2005 to 2008<br />
Table C 4: <strong>Food</strong> Imports (Tons)<br />
S/N <strong>Food</strong> crop<br />
Years<br />
2005 2006 Change 2007<br />
Change 2008<br />
Change<br />
Tons Percent<br />
Tons Percent<br />
Tons Percent<br />
1. Maize 18,900 252,632 233,732 +1,236.7% 6,609 - - 19,583 12,974 196.3%<br />
2. Rice 67,495 90,430 22,935 +43.0% 45.187 - - 64,132 18,945 41.9%<br />
3. Wheat 480,450 640,212 159,762 +33.2% 813,513 173,301 27.1% 452,106 (-361,407) (-44.4%)<br />
4. Sorghum 20 1,226 1,206 +6,030% 390 - -<br />
5. Millets 171 - - - 33 - -<br />
6. Oat 12 8 - - 185 177 2,215% -<br />
7. Barley 2,173 8 - - 4,200 4,192 52,400% -<br />
Source: Tanzania Revenue Authority<br />
Figure C 4.2: <strong>Food</strong> Imports (Tons)<br />
60
2.2.5 <strong>Food</strong> Crops Production at District Level<br />
<strong>Food</strong> production at district level also fluctuates; <strong>and</strong> this is reflected at national , <strong>and</strong> one of the<br />
main cause being rainfall fluctuation both in amount <strong>and</strong> distribution, <strong>and</strong> also geographically<br />
<strong>and</strong> between season <strong>and</strong> within season. Thus as most of the food crop is produced under rainfed<br />
condition, production is bound to vary, even for just that one factor alone. In the districts<br />
visited, fluctuation in production was quite evident in the data provided <strong>and</strong> in the discussions<br />
held with farmer groups. Two examples are provided here, for Kilombero District <strong>and</strong> Mbeya<br />
Rural District. As it can be seen, in Mbeya Rural due to more steady <strong>and</strong> dependable rainfall<br />
year in year out, maize, the main food crop, did not fluctuate as much as was the case in<br />
Kilombero District which has less steady rainfall compared to Mbeya Region; of course there<br />
are other production factors, such as use of inputs, that do affect production.<br />
a) Eastern Zone<br />
Figure P1: <strong>Food</strong> Crops production trend in Kilombero District, Eastern Zone<br />
Figure P2: <strong>Food</strong> Crops production trend in Mvomaro District, Eastern Zone<br />
61
) Southern Zone<br />
Figure P3: <strong>Food</strong> Crops Production Trend in Mbeya District - Southern Zone<br />
c) Northern Zone<br />
Figure P4: <strong>Food</strong> Crops production trend in Korogwe District, Northern Zone<br />
Figure P5: <strong>Food</strong> Crops production Trend in Meru District, Northern Zone<br />
62
On. Possibility of sector ensuring national food security<br />
In reality capacity of the sector to ensure national food security is yet to be attained, for<br />
several reasons. Production is still largely undertaken on small-scale holdings, using inadequate<br />
tools (mostly the h<strong>and</strong> hoe for l<strong>and</strong> o<strong>per</strong>ations) <strong>and</strong> far from adequate technology - many<br />
cannot afford inputs for lack of savings <strong>and</strong> inability to access production credit; while at the<br />
same time the input subsidy provided by the government is still very meagre compared to<br />
requirement; <strong>and</strong> is only provided in some opportune regions only. Input prices in recent years<br />
have been escalating on the global market <strong>and</strong> in turn domestically.<br />
However, even some of the farmers that manage to get some inputs do not have adequate<br />
knowledge/ skills on how to use these due to lack of training as extension/training services are<br />
very much in short supply. But a far reaching factor likely to continue frustrating efforts by the<br />
sector to attain national food security is rainfall. In recent years rainfall has become not only<br />
scarce but also irregular, thereby rendering the traditional crop production calendar useless. In<br />
some years a good part of the country receive hardly any rains at all, <strong>and</strong> when they do come<br />
are irregular <strong>and</strong> scattered. Yet in some years parts of the country are subjected to heavy<br />
downpour, which cause soil erosion <strong>and</strong> floods, <strong>and</strong> also destroy crops, damage the limited<br />
irrigation infrastructures; <strong>and</strong> thereby rendering crop harvest little or none at all.<br />
In a more severe situation the country may be bombarded with el Niño rains, which are<br />
extremely severe as was the case in 1998, when they did come <strong>and</strong> destroyed crop fields <strong>and</strong><br />
irrigation infrastructure, including those of Lower Moshi Irrigation Scheme, they had to be<br />
subsequently rehabilitated. More recently, in 2007, the bio-modal rainfall areas of the north of<br />
the country did receive very substantial rains from the <strong>per</strong>iod of annual crop (largely maize)<br />
planting to nearly the tussling stage; but only to disappear completely in the subsequent stages,<br />
in especially the cob bearing stage, at which <strong>per</strong>iod rainfall would have been much needed for<br />
growth <strong>and</strong> maturity. The result was serious crop failure for most of the involved farmers; <strong>and</strong><br />
one could imagine the agony of the farmers, <strong>and</strong> their subsequent cry for food aid to feed their<br />
families. But had there been in place pro<strong>per</strong> irrigation infrastructure complete with facilities for<br />
water harvesting <strong>and</strong> water control, the situation would have been different in this case.<br />
Other areas affecting national food security efforts are inadequate storage facilities, inadequate<br />
marketing infrastructure (produce collection <strong>and</strong> market centres; rural roads <strong>and</strong> so on); <strong>and</strong><br />
also lack of crop processing capacity (to add value to the crops). Making improvement in these<br />
areas, would greatly enhance food security to the poor. Processing <strong>and</strong> packaging the crop prior<br />
to selling, would increase producer’s income, rather than selling it as raw; for instance in the<br />
case of paddy, cashew-nut <strong>and</strong> cassava. Good crop storage facility (for instance for banana)<br />
would reduce waste that arise due to its being quite <strong>per</strong>ishable. This would further add value to<br />
the total produce <strong>and</strong> make more food available.<br />
Cereals are also very much prone to destruction by insects, fungus <strong>and</strong> other pests; <strong>and</strong><br />
substantial amount is destroyed if no pro<strong>per</strong> storage measures are applied. This might explain<br />
the difference of what the national figures tell as quite reasonable cereal production to what is<br />
seen on the ground in some of the villages visited, where farmers were crying out for food aid.<br />
There is also need to improve data keeping at village right to district level to ensure that data<br />
provided nationally were really accurate <strong>and</strong> reflected what was actually on the ground.<br />
63
2.2.5 Issues to tackle in respect to the above food security situation:<br />
i. Human nutrition education:<br />
- Providing human nutrition education information (backed up sensitization<br />
by the Community Development units at LGA) country-wide would enable<br />
the general community to move more into non-cereal foods, particularly<br />
cassava whose production <strong>and</strong> availability could be substantially enhanced<br />
as it can do well in all the country’s regions, given the existence of more<br />
palatable, resistant varieties now in existence, some of whose tubers taste<br />
like bread if not better. [SUA had developed such varieties long time ago - way<br />
back in the 1970s]. Even with little or just a minimum of inputs (possibly one<br />
or two sprays if necessary) a farmer could harvest quite a sizable yield from<br />
his small plot; enough for his family use <strong>and</strong> for sale to get income. Sweet<br />
potatoes is another non-cereal crop that should be promoted along the<br />
same lines. In some of the neighbouring countries, cassava is more or less the<br />
staple; the same in some of the country’s regions.<br />
- For those farming communities not wanting to diversify into non-cereal,<br />
<strong>and</strong> are living in the rainfall-scarcity <strong>and</strong> unreliability regions of the<br />
country (mainly Dodoma, Manyara, Singida <strong>and</strong> Shinyanga), they should<br />
be sensitised to grow suitable varieties of sorghum; <strong>and</strong> if possible they<br />
should be made to move from maize production all together as many years<br />
of ex<strong>per</strong>ience has shown that chances of those regions getting a worthy<br />
maize crop under existing varieties is next to nil.<br />
- Nutrition education is also needed to sensitize farmers/ communities to<br />
produce <strong>and</strong> eat pulse varieties that are suitable to their ecologic area<br />
ii.<br />
Efficient food distribution:<br />
- More efforts are needed to ensure that food produced in the country is<br />
available timely at all corners of the country under free market conditions.<br />
Measures for suppressing producer food crop prices to below market level<br />
(cif value) must be avoided, as such efforts are counterproductive - they<br />
thwart efforts in producing more food. For instance while currently there<br />
are a number of districts reported by the FSD to be having serious food<br />
shortage there is food surplus in parts of the Southern Highl<strong>and</strong>s regions,<br />
some in government’s Grain Reserve godowns.<br />
iii.<br />
<strong>Food</strong> processing to add value:<br />
- <strong>Food</strong> processing capacity <strong>and</strong> skill are badly needed to add value to<br />
farmer’s food crops in order to increase farmer income <strong>and</strong> reduce rural<br />
poverty.<br />
- Government, while encouraging private sector to invest in food production <strong>and</strong><br />
processing, it should also promote <strong>and</strong> support setting up of small scale food<br />
crop (including also vegetables <strong>and</strong> fruits) processing plants by producer<br />
groups/ coo<strong>per</strong>atives, <strong>and</strong> even at pro<strong>per</strong> individual courtyards. Dependable<br />
credit facility <strong>and</strong> training would be badly needed here.<br />
64
iv.<br />
Marketing infrastructure<br />
- Speeding up the pace of establishing appropriate marketing infrastructure<br />
(including collection centres, market centres warehouse receipt system; <strong>and</strong><br />
well maintained rural roads) would greatly help rural <strong>and</strong> urban poor<br />
exchange products; <strong>and</strong> also attract more buyers to rural areas (increasing<br />
competition); thereby enhancing incomes <strong>and</strong> reducing poverty.<br />
v. Quality crop produce <strong>and</strong> processed food commodity products<br />
- Quality assurance is really key to business success; securing <strong>and</strong><br />
maintaining markets <strong>and</strong> enhancing incomes<br />
- Quality must also be seen in form of secure, well labelled attractive<br />
packaging for crop produce <strong>and</strong> products<br />
vi.<br />
Improving extension services to farmers<br />
- Extension services to crop farming is still limited in both staff numbers <strong>and</strong><br />
practical training.<br />
- Farmer Field Schools, for which KATC has developed a model training, are<br />
still scarce in the country; <strong>and</strong> trainers too are few.<br />
- Much more resources are needed in these two levels of extension service.<br />
vii.<br />
Increased investment in irrigation<br />
- Government should promote <strong>and</strong> support much more investment in both<br />
small –scale <strong>and</strong> large scale irrigation schemes/ projects<br />
- The approach <strong>and</strong> model provided under TIP projects in the northern zone<br />
districts of Same, Lushoto <strong>and</strong> others, should be fully adopted for small<br />
scale irrigation in hilly areas; as among other things, the model is excellent<br />
for soils conservation <strong>and</strong> management<br />
viii.<br />
Increased subsidy in inputs <strong>and</strong> appropriate farming equipment<br />
- Additional resources in this area are very essential in enhancing food<br />
security to the rural poor <strong>and</strong> at national level as a whole.<br />
2.2.6 <strong>Food</strong> Exports 2005 to 2008<br />
The country does export crops, but this is unsteady <strong>and</strong> the amounts are relatively small<br />
compared to imports. [See Table C3, below]<br />
65
Table C3: <strong>Food</strong> Exports (Tons)<br />
S/N <strong>Food</strong> crop<br />
Years<br />
2005 2006 Change 2007<br />
Change 2008<br />
Change<br />
Tons Percent<br />
Tons Percent<br />
Tons Percent<br />
1. Maize 101,393 23,507 77,886 (-76.8%) 87,075 63,568 270.4% 11,735 (-75,340) (-86.5)<br />
2. Rice 11,264 4,417 6,847 (-60.8%) 19,234 14,817 335.4% 4,269 (-14,965) (-77.8%)<br />
3. Wheat 2,610 638 1,972 (-75.5%) 1,178 540 84.6% 1,569 392 33.3%<br />
4. Sorghum 1,814 273 1,541 (-84.9%) 427 154 56.4% 3,987 3,560 833.7%<br />
5. Millets 4,673 2,225 2,448 52.4% 1,920 (-305) (-13.7%) 1,504 (-416) (-21.7%)<br />
7. Barley 10 - - - - -<br />
Source: Tanzania Revenue Authority<br />
2.3: Performance of Livestock Sub-Sector<br />
2.3.1 At National Level<br />
2.3.1.1 Livestock numbers<br />
Table L1 <strong>and</strong> Figure L1.1 below, give the growth situation of livestock in numbers. Thus cattle,<br />
mostly being beef type, numbered about 18.6 million in 2006, <strong>and</strong> increased very slowly at<br />
annual rate of 0.8% a year, reaching 19.1 million in 2008. The annual increase in numbers is thus<br />
fairly minimal, suggesting that the numbers have been kept under check. The main reasons<br />
advanced for this situation are limitation on availability of grazing/ grazing l<strong>and</strong> <strong>and</strong> water,<br />
<strong>and</strong> animal diseases. Goats <strong>and</strong> sheep have not increased much over the same <strong>per</strong>iod either,<br />
averaging an annual increase of about less than one <strong>per</strong>cent (about 0.75%). Sheep numbers has<br />
not changed over the last three years, keeping at 3.6 million in number. <strong>Of</strong> the non-ruminants<br />
pigs have registered an average annual growth of about 7%, <strong>and</strong> in 2009 the number stood at 1.6<br />
million; up from 1.3 million in 2008. Poultry on the other h<strong>and</strong>, did increase quite a bit from<br />
2006 to 2007, reaching about 28% increase, but then this decreased to about 3.5% in 3008, <strong>and</strong> is<br />
likely not to reach much further in 2009, in which total number is expected to be 56 million<br />
chicken.<br />
TableL1: Livestock Numbers (millions) 2006 to 2009<br />
S/N Livestock<br />
Years<br />
2006 2007 Change 2008<br />
Change 2009<br />
Change<br />
Numbers Percent<br />
Numbers Percent<br />
Numbers Percent<br />
(million)<br />
(millions)<br />
(millions)<br />
1. Cattle 18.65 18.8 0.15 0.8% 18.95 0.15 0.8% 19.1 0.15 0.8%<br />
2. Goats 13.3 13.5 0.2 1.5% 13.55 0.05 0.4% 13.6 0.05 0.37%<br />
3. Sheep 3.55 3.6 0 - 3.6 0 - 3.6 0 -<br />
4. Poultry 41.5 53 11.5 27.7% 54.5 1.5 2.8 56 1.5 2.7%<br />
5. Pigs 1.3 1.4 0.1 7.7% 1.5 0.1 7.1% 1.6 0.1 6.7%<br />
Source: <strong>Ministry</strong> of Livestock Development <strong>and</strong> Fisheries<br />
66
Figure L1.1: Livestock Numbers (millions) 2006 to 2009<br />
2.3.1.2 Milk Production<br />
Milk production, most of it from cows (very little from goats), has been increasing, annually,<br />
particularly in the last two years, where in 2007/08 the increase was 5.5%, <strong>and</strong> in 2008/09, the<br />
increase was about 7% [See Table L 2 below]. Over the past four year <strong>per</strong>iod, total production<br />
which in 2008/09 stood at 1,604,126 litres, increased by 13.5%, which was commendable.<br />
However, given the fact that total production from the Traditional Herd was about twice that of<br />
Improved Herd, the potential for much more increase in production is still much un-tapped,<br />
considering that average milk yield from traditional herd is only about 3 to 4 litres <strong>per</strong> day<br />
while from improved one may range from 8 litres to even beyond 16 litres <strong>per</strong> day. This is<br />
where the importance of AI is crucially glaring. Thus the National Artificial Insemination<br />
Centre needs to be provided with much more resources in order to spread its AI activities faster<br />
than <strong>and</strong> as far country-wide as possible. Many more AI ex<strong>per</strong>ts are needed <strong>and</strong> quality<br />
facilities are spread out in the country.<br />
The private sector can also be brought in much more, into providing the AI services for<br />
improving the local breed, such private inseminators were found to be already active in a few<br />
places, Iringa Region. In addition government could look into possibility of subsidising AI<br />
doses cost (at the time of visit to NAIC, there were over 75,000 AI doses awaiting purchase); <strong>and</strong><br />
also cost of improved in-calf heifers, whose cost are now quite high, as much as Tshs 800,000 to<br />
as much as Tshs 1.9 million <strong>per</strong> herd. Nevertheless, the efforts being increasingly put into this<br />
sector to increase milk production are quite encouraging. Apart from the AI programme, more<br />
<strong>and</strong> more improved dairy heifers are being distributed <strong>and</strong> spread out to various parts of the<br />
country; improved milk goats are increasingly being distributed to parts of the country,<br />
particularly where l<strong>and</strong>/ feed is scarce, as in Kilimanjaro Region <strong>and</strong> where the household’s<br />
resources are too little to maintain a milk cow. However, in order for these efforts to pay off<br />
more, they must go h<strong>and</strong> in h<strong>and</strong> with more drive in fighting animal diseases; <strong>and</strong> in better<br />
67
husb<strong>and</strong>ry practices, particularly in production <strong>and</strong> conservation of fodder. Also there should<br />
be efforts to enable farmer obtain feed concentrates at affordable prices, possibly by<br />
encouraging production of relatively chea<strong>per</strong> cassava based feed systems.<br />
Table L2: Milk production Trend over past 4 years - 2005/06 to 2008/09<br />
S/<br />
N<br />
Producing<br />
Livestock<br />
category<br />
(Source)<br />
1. Traditional<br />
Herd<br />
Litres<br />
(‘000)<br />
2005/06 2006/07 Percent<br />
change<br />
941,815 945,524<br />
0.3%<br />
2007/08 Percent<br />
change<br />
2008/09 Percent<br />
change<br />
980,000 3.6% 1,012,430 3.3%<br />
2 Improved<br />
Herd<br />
Total<br />
Litres<br />
(‘000)<br />
470,971 475,681 1.0% 520,000 9.3% 591,690 13.8%<br />
1,412,786 1,421,205 0.6% 1,500,000 5.5% 1,604,126 6.9%<br />
Source: <strong>Ministry</strong> of Livestock Development <strong>and</strong> Fisheries<br />
Figure L.2.1 Milk Production at National Level<br />
2.3.1.3 Meat Production<br />
Meat production situation from the various categories of livestock over the past four years<br />
2005/06 to 2008/09) is as shown under Table L 3 below. During this <strong>per</strong>iod all categories of the<br />
product showed an upward trend, though there were fluctuations in beef production <strong>and</strong> in<br />
chicken. Beef production declined in 2006/07, from production of over 200,000 tons in 2005/06<br />
to about 180,000 tons in 2006/07; <strong>and</strong> then increased by 21% in 2007/08, <strong>and</strong> then by a lower<br />
figure increase of about 3% in 2008/09. Chicken production had increased by a hefty 11.3% in<br />
2006/07, before declining slightly (by 0.04%) in 2007/07, <strong>and</strong> only showed a marginal increase<br />
of 1.2% in 2008/09. Meat production for the different livestock categories in 2008/09 stood at<br />
68
225,178 tons for beef; 82,884 for lamb/ mutton; 36,000 tons for pork/ pig meat; <strong>and</strong> 78,168 tons<br />
for chicken.<br />
Table L3: Meat Production in Tanzania<br />
Meat Production<br />
(Tons) 2005/06 2006/07<br />
Beef 210,370 180,629<br />
Lamb/Mutton 78,579 80,936<br />
Pork 29,925 31,721<br />
Chicken 69,420 77,280<br />
Percent<br />
change<br />
(- 14%)<br />
3.0%<br />
6.0%<br />
11.3%<br />
2007/08<br />
218,976<br />
81,173<br />
33,307<br />
77,250<br />
Percent<br />
change<br />
Percent<br />
change<br />
2008/09<br />
21% 225,178 2.8%<br />
0.29% 82,884 2.1%<br />
5.0% 36,000 8.1%<br />
(- 0.04%) 78,168 1.2%<br />
Table L3.1: Annual Livestock Meat Production by Category of Stock (2005/06 to 2008/09)<br />
Figure L4.1: Annual Livestock Meat Production Percent Value by Category of Stock<br />
69
2.3.1.4 Cattle /Steer Fattening<br />
There has been some cattle fattening in various feedlots <strong>and</strong> ranches in the country. Thus some 62,000<br />
cattle were fattened in 2008/2009 compared to only 29,600 cattle fattened in 2007/2008; a very<br />
substantial increase of over 100%. Beef fattening was specifically carried out at the Manyara, Mzeri <strong>and</strong><br />
Glienshils ranches; <strong>and</strong> at Mtibwa Feedlot (Morogoro), Sumbawanga Agricultural <strong>and</strong> Animal <strong>Food</strong><br />
Industries (SAAFI). It was also undertaken by small livestock kee<strong>per</strong>s in Mara, Mwanza <strong>and</strong> Shinyanga<br />
regions under the Farmers Field Schools programme. In addition, after dividing the 294,188 hectares of<br />
NARCO ranches into 134 small ranches, each with an area of between 2,000 <strong>and</strong> 4,000 hectares, some of<br />
the investors have invested <strong>and</strong> already there are 48,301 cattle, 7,182 goats <strong>and</strong> sheep. The exercise of<br />
offering sublease to small ranches has started. Up to now, offering of sublease was completed for the<br />
plots at Mzeri, Misenyi, <strong>and</strong> Mkata ranches. The exercise of offering sub lease is now at 6 ranches of<br />
Uvinza, Usangu, Kalambo, Mobile, Kikulula <strong>and</strong> Kagoma.<br />
Figure L5.1: Annual Livestock Production 2006/09 <strong>and</strong> Meat<br />
2.3.1.5 Beef Livestock farming under traditional livestock kee<strong>per</strong>s/ farmers – the<br />
practice <strong>and</strong> consequences<br />
The country has some 50 million ha of rangel<strong>and</strong>s suitable for livestock grazing. However, only<br />
about 26 million ha is currently under utilization; the balance, which is about 40%, is tsetse fly<br />
infested, <strong>and</strong> therefore difficult for livestock grazing.<br />
However, there is the widely practised, nomadic free grazing keeping of livestock, under which<br />
conditions, animals are moved continually from one area of district/ region/ zone to another in<br />
search of grazing/ pasture. Thus, as l<strong>and</strong> currently being grazed is shaved off of grass by the<br />
livestock, the animals are trekked to new area, <strong>and</strong> in the course of this shifting, the animals<br />
may pass through crop fields, devouring st<strong>and</strong>ing crops; thereby causing conflicts, between<br />
livestock farmers <strong>and</strong> the crop farmers; <strong>and</strong> indeed (if it is small farming community’s fields)<br />
this could subsequently contribute to food insecurity . It is unfortunate that the small scale<br />
livestock farmer of today is still practicing this form of livestock farming (nomadic type), which<br />
was long banned/ ab<strong>and</strong>oned in many countries due to its destructive nature on the l<strong>and</strong><br />
resource.<br />
70
Hungry livestock eat grass to the roots, leaving the l<strong>and</strong> bare, ready for various destructions,<br />
including soil erosion (washing away of relatively fertile top soil), disappearance of natural<br />
vegetation, driving away convectional rainfall ecosystem; <strong>and</strong> indeed, may lead to very<br />
negative climate change - climate unfovourable to plant/ crop growth. Worse still, the animals<br />
themselves, lose a lot of weight during the trekking from one area to another; <strong>and</strong> particularly<br />
during the dry season when grazing is really scarce in the traditional grazing l<strong>and</strong>s. It seems<br />
what happens is a situation where livestock gain weight during (<strong>and</strong> in the immediate<br />
aftermath of) the rain season, only to lose almost all the weight gain during the dry season, <strong>and</strong><br />
the cycle may continue for years, especially for the fact that some of the animals stay in the herd<br />
for years; may be 5 to 10 years! The result from such animals is little economic value; it is a<br />
waste of resources; gaining some weight from resources provided only to lose it in the dry<br />
season.<br />
Many countries desirous of pursuing modern farming or revolutionizing agriculture did away<br />
with this practice over two centuries ago, through enacting <strong>and</strong> enforcing necessary legislation.<br />
UK for instance, its first step towards attaining agricultural revolution was to pass a<br />
parliamentary Act called L<strong>and</strong> Enclosure Act that required all farmers to enclose their livestock<br />
farm l<strong>and</strong> <strong>and</strong> forbade livestock trespassing; a hefty punishment awaited any one not<br />
complying. In Tanzania, such a legislation is badly needed; stop gap / half measures may only<br />
lead to more <strong>and</strong> more l<strong>and</strong> destruction <strong>and</strong> even desert; <strong>and</strong> indeed the present deserts may<br />
have been caused by overgrazing/ overstocking <strong>and</strong> nomadic activities.<br />
MLDF in a recent stakeholders workshop proposed measures along these lines, including<br />
urging government to speed up villages demarcation l<strong>and</strong>s for crops (<strong>and</strong> settled farming in<br />
general) <strong>and</strong> for livestock production. To date some 1,391,109.41 ha have been demarcated for<br />
livestock keeping/ grazing, partly in an effort to stem out this uncontrolled movement of stock that cause<br />
destruction of crops <strong>and</strong> infrastructure on the way. During 2008/09, a total of 460,833 Ha of l<strong>and</strong> has<br />
been set aside for livestock activities in 28 villages in 5 districts of Liwale, Lindi, Kilwa, Kilosa<br />
<strong>and</strong> Nachingwea <strong>and</strong> make a total of 1,391,109.41 ha so far which have been demarcated for<br />
livestock activities in 240 villages of 31 districts in 13 regions of Tanzania Mainl<strong>and</strong>.<br />
While this may reduce conflicts between the two communities, assuming that no trespassing<br />
occurs between the two communities’ areas, it may not necessarily lead to productivity, unless<br />
there is another measure (legislation) to prevent overstocking in the livestock demarcated areas<br />
<strong>and</strong> also require livestock kee<strong>per</strong>s in such areas to practice fodder conservation. At the same<br />
time there must be available necessary support services - animal health, water, market/<br />
collection centres, transport infrastructure (road, railway), as well as firm pasture production<br />
supporting services (including pasture seeds <strong>and</strong> pasture production demonstration plots).<br />
Pasture development support services is a particularly weak point in the sub-sector. Pasture<br />
production support services are badly needed not just for the traditional (nomadic) livestock<br />
farmer, but also for the national ranches, where the grazing l<strong>and</strong> for the ranches, is not much<br />
different from the surrounding bush - no pasture production; no really planned paddocks in a<br />
number of them. It would be advisable, in the future, to use pasture development progress as one of the<br />
more important criteria for judging progress made by the sub-sector.<br />
71
2.3.1.6 Providing Water for Livestock plus Animal Health facilities<br />
a) Providing Water<br />
Providing water in grazing area minimizes movement of grazing livestock, <strong>and</strong> in turn minimizing l<strong>and</strong>/<br />
environment destruction possibilities.. To this end the sector, between 2001 – 2006, under cost-sharing<br />
programme, constructed 347 charco dams (under cost sharing Central Government contributes 50% of<br />
total costs; Local Government 30% <strong>and</strong> Local Community contributes 20%). Under DADPs program,<br />
from 2004 alone, from 2004/2005, a total of 233 charco dams have been constructed/rehabilitated. In<br />
addition, a total of 680 charco dams were constructed through the Participatory <strong>Agriculture</strong> Development<br />
Project (PADEP), District Agricultural Sector Investment programme (DASIP) <strong>and</strong> Tanzania Social<br />
Action Fund (TASAF). Through such initiatives, a total of 1,227 chaco dams have been<br />
constructed/rehabilitated countrywide. This is certainly a commendable effort, though a lot more needs to<br />
be done along this direction.<br />
b) Health Facilities<br />
The Sub-sector has Currently 2314 cattle dips country wide, out of which, 1,556 dips are o<strong>per</strong>ational while 758 dips<br />
are not in o<strong>per</strong>ation. The status for these is as provided under Table D1, below.<br />
Table D1: Status of Dips in the country in years 2005/06 to 2008/09<br />
Year Total Dips Total dips in Dips in Good Dips in Good Poor dips <strong>and</strong><br />
Good status status <strong>and</strong> in status but not in not in<br />
o<strong>per</strong>ation<br />
o<strong>per</strong>ation<br />
o<strong>per</strong>ation<br />
2005/2006 2,177 1,118 828 290 1,076<br />
2006/2007 2,177 1,225 908 317 969<br />
2007/2008 2,268 1,430 1,060 370 855<br />
2008/2009 2,314 1,556 1,153 403 758<br />
Some cattle dips were under construction, for instance the ones observed during the study,<br />
including Marui Cattle Dip in Korogwe District; <strong>and</strong> the Engare Nanyuki Cattle Dip in Meru<br />
District.<br />
2.3.2 At District Level<br />
2.3.2.1 Livestock Production in Kilombero District - Morogoro Region (Eastern Zone)<br />
Figure M1.1: Annual Livestock Production in Kilombero District 2006/07 to 2008/09 (excluding poultry)<br />
72
Figure M1.2: Annual Poultry Production in Kilombero District 2006/07 to 2008/09<br />
Figure M1.3: Annual Milk Production in Kilombero District 2006/07 to 2008/09<br />
Figure M1.4: Annual Meat Production in Kilombero District 2006/07 to 2008/09<br />
Figures M1.1 to M1.4 depict livestock production trend in Kilombero District, which was one of<br />
the districts visited by the consultant. Figure M1.1 shows that, indigenous cattle number, after<br />
remasining at the same level on 2006/07 to 2007/08, increased substantially in 2008/09. Dairy<br />
cattle, on the other h<strong>and</strong> increased steadily from 2006/07 to 2008/09 <strong>per</strong>iod. Sheep <strong>and</strong> goats,<br />
for some unexplained reason, showed doewnward trend. This downward trend was also<br />
ex<strong>per</strong>ienced in meat production over the same <strong>per</strong>iod (Figure M1.4, above). But both milk <strong>and</strong><br />
poultry production increased steadily over the <strong>per</strong>iod (Figure M1.2 <strong>and</strong> M1.3, above). In<br />
general, therefore, the disatrict had <strong>per</strong>formed well in the livestocl sub-sector.<br />
73
2.4 Agricultural Services Provision<br />
2.4.1 Activities at District level<br />
In an effort to strengthen extension delivery systems at district level, the following measures<br />
have been undertaken by the Sector:<br />
• A total of 153,521 farmers <strong>and</strong> livestock kee<strong>per</strong>s were trained on crop <strong>and</strong> animal<br />
husb<strong>and</strong>ry <strong>and</strong> marketing <strong>and</strong> processing skills,<br />
• 5,080 Farmer Field School were established<br />
• 34 Ward Agricultural Resource centres out of 90 planned were constructed.<br />
Also, in an effort to strengthen farmers productive groups <strong>and</strong> improve skills of extension staff:<br />
• A total of 14,519 farmer groups were trained on group formation, constitution<br />
arrangement establishment <strong>and</strong> management of SACCOS, record keeping <strong>and</strong><br />
agribusiness.<br />
• A total of 77,846 extension staff received short courses on various agricultural skills <strong>and</strong><br />
• 38 vehicles, 405 motorcycles <strong>and</strong> 254 bicycles were procured.<br />
2.4.2 Activities at National Level<br />
Measures undertaken by the sector at national level were:<br />
• Improving research services through undertaking of 64 research projects under<br />
ZARDEF funding to develop <strong>and</strong> disseminate new improved technologies with greater<br />
participation of farmers.<br />
• 32 ZIELU officers were trained in 7 research zones<br />
• 11 agricultural research centres were rehabilitated <strong>and</strong> retooled to strengthen their<br />
o<strong>per</strong>ations<br />
• 38 researchers were trained on long courses <strong>and</strong> 141 research staff trained on short<br />
courses on their respective fields.<br />
2.4.3 Extension Services Observations in the districts visited<br />
Preamble:<br />
The primary role of crop extension service is to enable farmers, as a whole, to acquire <strong>and</strong> adopt<br />
agricultural technologies that contribute to increased crop productivity. The extension services<br />
provided could involve on-farm visit advice to individual farmers/ groups; or providing<br />
training (under the FFS) to a select of farmers on specific practice; <strong>and</strong> then these in turn go to<br />
train their colleagues in groups.<br />
The latter approach seems to have been more successful as it has been able to reach many more<br />
farmers through the trained lead farmers; <strong>and</strong> indeed farmer groups under lead farmer in<br />
irrigation schemes appeared to have more knowledge <strong>and</strong> confidence in crop production<br />
practices than in groups without one; <strong>and</strong> their yields were found to be higher too. The FFS<br />
programme was reported to be still going on, particularly under the KATC II training<br />
programme, which was reported to be country-wide now <strong>and</strong> has even gone beyond the<br />
74
country’s borders. The KATC training activities have already been cited above, as being as<br />
being one of the success stories of the sector.<br />
KATC Farmer Field School (FFS) Training in progress in one of the sites<br />
Main constraints to farmer’s productivity, food security <strong>and</strong> farm income (to reduce poverty)<br />
Despite the above mentioned efforts being undertaken by ASLMs at both national <strong>and</strong> local<br />
level, there are still a lot of constraints facing the farmer that are ham<strong>per</strong>ing productivity <strong>and</strong><br />
achievement of food security <strong>and</strong> reduction of income poverty. These include:<br />
‣ (The already mentioned) inadequate extension services<br />
- extension staff still few in number <strong>and</strong> have to cover large areas; <strong>and</strong> may even<br />
have no transport; or if he has, for instance a motor cycle available, he may not be<br />
provided with (or afford money to buy) sufficient fuel (as was explained by some<br />
of the extension workers met)<br />
- some of the employed extension staff are still badly in need of practical training<br />
(as was reported in the northern zone during the field visit there<br />
- any irrigation schemes not having qualified extension staff; to the extent of using<br />
even livestock trained staff on irrigation schemes.;<br />
- inadequately empowered extension staff in terms of scarce working facilities;<br />
<strong>and</strong> hardly any incentives; <strong>and</strong><br />
- insufficient capacity of FFS; these not sufficiently spread out (for instance in<br />
Lindi District it was reported that there had been hardly any FFS activity for<br />
cashew nut farmers).<br />
‣ Inadequate farming knowledge <strong>and</strong> skills/ technology<br />
‣ Lack of access to agricultural production credit;<br />
‣ Lack of adequate purchasing power to procure required inputs; for instance fertilizer is<br />
available, but it is expensive for farmer to buy adequate amounts, even some do not use<br />
at all (as in the case of almost all the schemes in the irrigation zones of Mwanza,<br />
Dodoma, Tabora (except for Mwamapuli Irrigation Scheme of Igunga District); <strong>and</strong> also<br />
Mtwara (for instance the Nyengedi Irrigation Scheme in Lindi District), <strong>and</strong> even in<br />
Morogoro (for instance the Mkula Irrigation Scheme). Yet the farmer seems to have<br />
75
hardly any alternative to chemical fertilizers, as possibilities like use of green manure or<br />
making <strong>and</strong> use of compost manure appear to be a remote idea in the minds <strong>and</strong><br />
practices of the farming communities – <strong>and</strong> <strong>per</strong>haps there is no reason for that situation.<br />
‣ Lack of access to pro<strong>per</strong> farming machinery/implements; <strong>and</strong> labour-saving equipment<br />
(motorized seedling planters, weeding machine, appropriate tractors <strong>and</strong> so on).<br />
‣ Inadequate water for irrigation in many irrigation schemes; forcing schemes to o<strong>per</strong>ate<br />
under capacity. For instance at Lower Moshi Irrigation Scheme, only half of the<br />
developed irrigation l<strong>and</strong> is actually under irrigated crop each year due to shortage of<br />
water during the growing season, the dry season. During the rainy season the l<strong>and</strong> is<br />
bombarded with floods <strong>and</strong> so it is difficult to grow crop. Also at Kwemaz<strong>and</strong>u<br />
Irrigation Scheme not all the developed irrigation l<strong>and</strong> could be planted in 2009 due to<br />
shortage of irrigation water, in turn due to shortage of rains.<br />
‣ Inadequate water control <strong>and</strong> management systems, in irrigation schemes that are not<br />
yet improved or fully modernised.<br />
‣ Existence of inefficient/ inadequate market outlets for farm produce, including those<br />
caused by frequent bans on cross-border food commodity export (Mbeya zone;<br />
Kilimanjaro zone; <strong>and</strong> Ruvuma Region of the Mtwara zone are particularly affected by<br />
these bans); <strong>and</strong> add to this inefficient marketing ability of farmers/ farmer<br />
associations/ coo<strong>per</strong>atives, including poor forward linkages.<br />
‣ Lack of adequate, stable organisational structures in irrigation schemes/ farming<br />
groups/ coo<strong>per</strong>atives<br />
‣ Lack of integrated, participatory approach; such as the one that had been hatched<br />
through the SPFS for purpose of solving multiple constraints. At the districts, it would<br />
seem, there are some functional units that seemed not to be facilitated in order to get<br />
them much more involved with the farmers production support services – the Trade<br />
officer seemed currently not providing trade/ market information/ advice to farmers;<br />
the community development <strong>and</strong> coo<strong>per</strong>ative units not seemed to be much involved<br />
either; yet they would be ones that could provide organisational strengthening skills <strong>and</strong><br />
management improvement services to farmers/ farmer organisations, including<br />
coo<strong>per</strong>atives - their limitation was reported to be lack of transport for taking them to the<br />
villages; it seems there was also the problem of lack of reorientation/ retraining,<br />
especially for the trade officers, (who hardly go to villages).<br />
‣ Inadequate institutional arrangement, This will be discussed more in the section below.<br />
But one should mention the need to separate the crop extension unit <strong>and</strong> the livestock<br />
extension units at district level (just as is the case at national level) so that each unit can<br />
report receive orders / <strong>and</strong> report independently to the designated authority at par.<br />
Currently if the one heading the two units comes from one sub-sector, those in the other<br />
one tend to be ‘short-changed’ on both budget <strong>and</strong> allocation of the resources eventually<br />
obtained from the budget.<br />
Impact of the extension worker in the context of Sector <strong>per</strong>formance<br />
There is no doubt that the extension service has had impact; we have already talked above of<br />
the success stories of <strong>per</strong>formance; but also:<br />
‣ There has been in the past three years, considerable increase in the production of some<br />
of the crops, including cotton <strong>and</strong> coffee [as already shown above]<br />
‣ New varieties introduced to farmers (e.g. the more popular/ paying SARO rice variety)<br />
76
‣ Extension workers have been su<strong>per</strong>vising input subsidies distribution to ensure targeted<br />
farmers get them<br />
‣ Extension workers have continued to advise the famers that they can reach on level of<br />
input use (<strong>and</strong> how to use) for the various inputs (including fertilizer, seed <strong>and</strong><br />
pesticides); <strong>and</strong> so on.<br />
‣ The importance of extension worker as agent of change manifests itself where the<br />
extension workers are too few on the ground, <strong>and</strong> farmers cry out for them.<br />
‣ Nevertheless, the increase in production over the past three as observed already above<br />
for some of the crops such as cotton <strong>and</strong> coffee is almost certainly partly due to the<br />
extension service efforts.<br />
‣ furthermore, extension workers were reported to have contributed to stable food<br />
security, particularly in the irrigation schemes, such as those in Mbeya Region; farmers<br />
there were reportedly having more assets currently than they did before getting into the<br />
scheme. Thus they were having better houses of their own.<br />
‣ the extension service has been providing training to farmers on specific practices/ skills,<br />
for spreading to the other farmers; <strong>and</strong> has also been instrumental in establishing field<br />
demonstration plots for farmers <strong>and</strong> also in following up on the farmer’s crop<br />
production activities; right from l<strong>and</strong> opening to harvest (as far as possible), <strong>and</strong> even<br />
providing after-harvesting services. The problem, as already stated above, not every<br />
farmer can be visited, since the extension workers are still too few.<br />
Institutional Aspects<br />
Now that the government appears to be putting more emphasis on agriculture than before, with<br />
the ‘Kilimo Kwanza program launch, it would be advisable to look into institutional<br />
arrangements that would make the agricultural technical staff in the districts interact freely<br />
with, <strong>and</strong> be answerable on technical matters to the respective Ministries (MAFC, MLDF, <strong>and</strong><br />
MITM – agricultural marketing). There should be free exchange of information <strong>and</strong><br />
communication between the district staff with the respective ministries on all agricultural<br />
technical matters, including direct reporting <strong>and</strong> receiving information. Currently there appears<br />
to be an unwarranted barrier between the ministries mentioned <strong>and</strong> the respective technical<br />
staff at the District level; presently all information (including on technical matters) from these<br />
Ministries has to go first to PMO RALG at national level, <strong>and</strong> then ‘trickle’ to the DED <strong>and</strong> then<br />
to the respective technical staff. Actually the technical <strong>Ministry</strong> has first to write to PMO RALG<br />
<strong>and</strong> then PMO RALG may write to RAS <strong>and</strong> then RAS may write to DED. Similarly, for the<br />
other way round.<br />
This seems to be an unnecessarily long route, cumbersome <strong>and</strong> even in-efficient. These are<br />
times that all productive sector staff must work not just intelligently, but even more, fast. There<br />
is no time to waste on information, particularly in the current very competitive, regional <strong>and</strong><br />
global situation. At these times information must be transparent <strong>and</strong> spilling over like water<br />
<strong>and</strong> moving out fast. Time for red tape is really over. There should be a situation where staff<br />
from <strong>Ministry</strong> headquarters can be seen moving around in the District office corridors <strong>and</strong> from<br />
one sector/s office to another as a matter of routine - getting direct information <strong>and</strong> sharing<br />
information without having to inform PMO RALG of the intension to do so. Short of this direct<br />
approach technical services will be very much compromised. We believe, this step backed by<br />
77
formalised bi-annual meetings of respective researchers, extension staff <strong>and</strong> stakeholder<br />
representatives together, would very much move the sector at least one step forward.<br />
The other issue is about crop irrigation <strong>and</strong> agricultural marketing division/ sections at national<br />
level. No one would have quarrel with MWI, undertaking major infrastructural constructions,<br />
as they have the engineers. But there are doubts whether MWI would have time (or even<br />
priority/ inclination) to spread irrigation techniques (drip irrigation, etc) <strong>and</strong> irrigation<br />
extension services to farmers; <strong>and</strong> on what crops? It is likely better if the government clearly<br />
h<strong>and</strong>s back the function of spreading irrigation techniques <strong>and</strong> the irrigation extension services<br />
to MAFC. Similarly, it seems the agricultural produce marketing role now in MITM might be<br />
better placed under MAFC in order for the latter to really address the crop value chain all the<br />
way. For instance we still have crop boards (which assist in marketing of cash crops) under<br />
MAFC. Even in the districts the people involved in assisting farmers in marketing of crops in<br />
the rural areas, is mostly agricultural extension staff. The Trade <strong>Of</strong>ficers have really no activity<br />
on agricultural marketing, other than licensing <strong>and</strong> taxation. They seem not to see agricultural<br />
marketing to be their role at all; <strong>and</strong> <strong>per</strong>haps they were not trained for that, either.<br />
2.5: Performance of the Coo<strong>per</strong>ative Sub-sector.<br />
2.5.1 Preamble<br />
The Coo<strong>per</strong>ative Development Sub-sector is responsible for promoting an enabling<br />
environment for the development of sustainable <strong>and</strong> vibrant member-based coo<strong>per</strong>atives;<br />
providing services for facilitating the formation, organization <strong>and</strong> o<strong>per</strong>ation of coo<strong>per</strong>ative<br />
societies. At the same time it monitors the coo<strong>per</strong>ative societies/ unions; as <strong>per</strong> requirement<br />
under the Coo<strong>per</strong>ative Societies Act No. 20 of 2003. The Division services are provided under<br />
four sections, which are; registration <strong>and</strong> legal matters, Coo<strong>per</strong>ative Promotion Services,<br />
Inspection <strong>and</strong> Su<strong>per</strong>vision Services, <strong>and</strong> Finance Advisory Services.<br />
Result Target, Related Activities <strong>and</strong> Achievement<br />
Based on the above service product categories, the sub-sector, had set itself targets <strong>and</strong><br />
activities to be implemented. The targets were as follows:<br />
• Coo<strong>per</strong>ative Societies regulatory framework in 21 regions strengthened by June 2011,<br />
• Three Coo<strong>per</strong>ative Inspection guidelines <strong>and</strong> 14 o<strong>per</strong>ational guidelines developed by<br />
June 2011,<br />
• Stakeholders in 21 regions sensitized on Coo<strong>per</strong>ative Policy <strong>and</strong> legislation by June<br />
2011,<br />
• Capacity of Coo<strong>per</strong>ative Development Division to carry out its functions<br />
strengthened by June 2011,<br />
• Governance <strong>and</strong> Leadership of Coo<strong>per</strong>ative Societies in 21 regions strengthened by<br />
2011,<br />
78
• Financial Management of 1000 SACCOS <strong>and</strong> 3 Coo<strong>per</strong>ative banks enhanced by 2011,<br />
• Coo<strong>per</strong>ative societies conducting business in cashew, cotton, <strong>and</strong> tobacco areas<br />
strengthened by June 2011, <strong>and</strong><br />
• Coo<strong>per</strong>ative Database System (CODAS) established by 2011.<br />
The result outcome for 2008/09, related activities <strong>and</strong> status of achievement are as provided<br />
under Template A, below:<br />
79
Template A; Coo<strong>per</strong>ative Sub-sector Result Target, related Activities <strong>and</strong> Achievements<br />
S/N Target<br />
Result<br />
Activities for achieving the<br />
target result<br />
1. Registration -To register 8 secondary<br />
<strong>and</strong> legal coo<strong>per</strong>ative societies <strong>and</strong><br />
matters su<strong>per</strong>vise registration of primary<br />
coo<strong>per</strong>atives at the Local<br />
Government level,<br />
-To h<strong>and</strong>le arbitration <strong>and</strong><br />
liquidation of coo<strong>per</strong>ative<br />
societies,<br />
-To facilitate training of<br />
coo<strong>per</strong>ative officers in<br />
management skills <strong>and</strong> business<br />
contracts in cotton <strong>and</strong> tobacco<br />
growing areas,<br />
-To facilitate coo<strong>per</strong>ative societies’<br />
leaders election in 12 Unions,<br />
-To disseminate 500 copies of<br />
coo<strong>per</strong>ative policy of 2002, 400<br />
copies of coo<strong>per</strong>ative societies<br />
Act of 2003 to stakeholders <strong>and</strong><br />
-To conduct TOT for 70<br />
coo<strong>per</strong>ative officers on code of<br />
conduct <strong>and</strong> train 30 coo<strong>per</strong>ative<br />
societies’ leaders on good<br />
governance <strong>and</strong> entrepreneurship<br />
skills.<br />
Achievement<br />
-Two secondary societies namely Wakulima wa Mara Coo<strong>per</strong>ative Union Ltd <strong>and</strong> Tanzania<br />
Beekee<strong>per</strong>s (probationary) Coo<strong>per</strong>ative Union Ltd, two (2) Joint Enterprises namely Kondoa<br />
District Financial Services <strong>and</strong> Morogoro & Mvomero Financial Services were registered;<br />
-A total of 926 different types of primary coo<strong>per</strong>ative societies (552 being SACCOS <strong>and</strong> 203<br />
Agricultural Marketing Coo<strong>per</strong>ative Societies) were registered;<br />
-A dispute/case between Chunya Tobacco Growers Coo<strong>per</strong>ative Union Ltd (CHUTCU) <strong>and</strong><br />
Majengo & Kagera primary coo<strong>per</strong>ative societies on supply of agricultural inputs through<br />
CHUTCU was resolved;<br />
-Follow up was done on liquidation of 4 defunct coo<strong>per</strong>ative societies of Mara Coo<strong>per</strong>ative Union<br />
(1984) Ltd, Vumilia Agricultural Producers Coo<strong>per</strong>ative Societies Ltd, Mbinga Coo<strong>per</strong>ative Union<br />
(1993) Ltd <strong>and</strong> Central Motors Coo<strong>per</strong>ative Society;<br />
-In collaboration with Regional Coo<strong>per</strong>ative <strong>Of</strong>ficers the department su<strong>per</strong>vised elections of<br />
Boards Members, of 8 Coo<strong>per</strong>ative Unions 2 Coo<strong>per</strong>ative Banks, <strong>and</strong> 2 Joint Enterprises was<br />
undertaken. The coo<strong>per</strong>ative societies were KCU (Bukoba), KDCU (Karagwe), NCU (Mwanza),<br />
SHIRECU (Shinyanga), KACU (Kahama), KNCU (Kilimanjaro), VUASU (Same), ACU (Arusha),<br />
KFCB (Kagera), KCBL,(Kilimanjaro), Foo, Ward, Nronga Joint Enterprise (Hai), Kanyovu Joint<br />
Enterprise, (Kigoma);<br />
-Training on coo<strong>per</strong>ative case prosecution, surcharge, procedures for coo<strong>per</strong>ative societies’ leaders<br />
elections, guide to preparation of coo<strong>per</strong>ative societies’ by-laws, coo<strong>per</strong>ative societies inspection<br />
procedures, was conducted to 14 Regional Coo<strong>per</strong>ative <strong>Of</strong>ficers, 8 Districts Coo<strong>per</strong>ative <strong>Of</strong>ficers<br />
<strong>and</strong> 8 Coo<strong>per</strong>ative <strong>Of</strong>ficers from Head <strong>Of</strong>fice to enable them to train/educate coo<strong>per</strong>ative<br />
stakeholders;<br />
-Facilitation of printing 5000 copies of Coo<strong>per</strong>ative Registration Certificates, 2000 copies of<br />
Coo<strong>per</strong>ative Societies Act, 2000 copies of Coo<strong>per</strong>ative Societies Rules <strong>and</strong> 25 Registers of<br />
Coo<strong>per</strong>ative Societies; <strong>and</strong><br />
-Distribution of 4000 Coo<strong>per</strong>ative Certificates, 1000 each of Act <strong>and</strong> Rules <strong>and</strong> 21 Registers of<br />
coo<strong>per</strong>ative societies to stakeholders.<br />
-Outcome achievement<br />
The major outcome achievements under this section include<br />
• Enhanced accessibility of coo<strong>per</strong>ative services, in particular financial <strong>and</strong> crop<br />
marketing services to the poor population in the country arising from Registration<br />
of 926 new primary coo<strong>per</strong>ative societies (552 being SACCOS <strong>and</strong> 203 Agricultural<br />
Marketing Coo<strong>per</strong>ative Societies), 2 secondary societies <strong>and</strong> 2 Joint Enterprises;<br />
• Having empowered coo<strong>per</strong>ative membership through access to <strong>and</strong> underst<strong>and</strong>ing<br />
of coo<strong>per</strong>ative policy, law <strong>and</strong> attendant rules.<br />
80
Template A; Coo<strong>per</strong>ative Sub-sector Result Target, related Activities <strong>and</strong> Achievements (continued)<br />
S/ Target Activities for achieving the target<br />
Achievement<br />
N Result<br />
result<br />
2 Coo<strong>per</strong>ative<br />
Promotion<br />
Services<br />
-To disseminate 500 copies of<br />
coo<strong>per</strong>ative policy of 2002, 400<br />
copies of coo<strong>per</strong>ative societies Act<br />
of 2003 to stakeholders,<br />
-Membership reached 1.8 million while the number of registered coo<strong>per</strong>ative societies rose to 9510.<br />
Other notable achievements were:<br />
-Promoted public awareness on coo<strong>per</strong>ative advantage through participation in the ICA International<br />
Day of Coo<strong>per</strong>atives, which was celebrated nationally in Moshi, the Farmers Day in Dodoma <strong>and</strong> the<br />
Public Service Week in Dar es Salaam;<br />
-To participate in Ushirika Day,<br />
Nane Nane Day, Utumishi Day,<br />
World <strong>Food</strong> Day, May Day <strong>and</strong><br />
International Credit Union Day,<br />
-To facilitate restructuring of<br />
Tanzania Federation of<br />
Coo<strong>per</strong>atives (TFC),<br />
-To support TOT of Coo<strong>per</strong>ative<br />
Reform <strong>and</strong> Modernization<br />
Program change agents,<br />
-To support 15 staff attached to<br />
coo<strong>per</strong>ative unions for “h<strong>and</strong>s on”<br />
capacity building,<br />
-To facilitate training of 20<br />
Coo<strong>per</strong>ative <strong>Of</strong>ficers <strong>and</strong> 17<br />
change agents in coo<strong>per</strong>ative<br />
management <strong>and</strong> business skills,<br />
-To promote networking among<br />
coo<strong>per</strong>ative stakeholders,<br />
-To o<strong>per</strong>ationalize the Coo<strong>per</strong>ative<br />
Database System (CODAS) <strong>and</strong><br />
coordinate data collection in 130<br />
LGAs, <strong>and</strong><br />
-To facilitate acquisition of various<br />
items to enable coo<strong>per</strong>ative staff to<br />
<strong>per</strong>form their duties.<br />
-Training in Coo<strong>per</strong>ative good governance, CRMP <strong>and</strong> entrepreneurship skills was conducted to 17<br />
Regional Coo<strong>per</strong>ative <strong>Of</strong>ficers <strong>and</strong> 8 District Coo<strong>per</strong>ative <strong>Of</strong>ficers to enable them to train other<br />
coo<strong>per</strong>ative stakeholders;<br />
-Sensitized agricultural marketing coo<strong>per</strong>atives in Mara region to form their secondary society which<br />
was then registered in December, 2008, with initial membership of 26 primary coo<strong>per</strong>ative societies;<br />
-Capacity building for cashew nut marketing <strong>and</strong> cotton marketing coo<strong>per</strong>atives was undertaken for<br />
MAMCU, TANECU, ILULU, CORECU, NCU <strong>and</strong> SHIRECU by deploying Coo<strong>per</strong>ative officers as<br />
trainers of coo<strong>per</strong>atives staff in management <strong>and</strong> finance systems;<br />
-Facilitated the preparation of Tanzania Federation of Coo<strong>per</strong>atives’ 5 year strategic Plan for the <strong>per</strong>iod<br />
2009 – 2013. Implementation of the Plan will facilitate establishment, development <strong>and</strong> growth of<br />
sustainable <strong>and</strong> democratic coo<strong>per</strong>atives in a competitive environment;<br />
-Capacity of Departmental staff was enhanced through support to undertake degree level training,<br />
short courses <strong>and</strong> specialized training. Three (3) staff were supported to undertake bachelors degrees<br />
at MUCCoBS, Nine 9 other staff undertook Post Graduate diploma <strong>and</strong> 2 ordinary diploma courses at<br />
the same University, while 7 staff attended masters degree programmes at various Universities. Fifteen<br />
(15) staff attended short-term training including 6 who were sponsored for courses abroad;<br />
-Promoted networking with Coo<strong>per</strong>ative development partners by actively participating in CRMP<br />
implementation, through this, TFC guide on HIV/AIDS was developed;<br />
-Working gears were procured <strong>and</strong> supplied to Coo<strong>per</strong>ative <strong>Of</strong>ficers in Ileje, Siha <strong>and</strong> Sikonge districts<br />
to enhance their promotional <strong>and</strong> su<strong>per</strong>visory roles; <strong>and</strong><br />
-Coo<strong>per</strong>ative Data System (CODAS) was launched <strong>and</strong> piloted in Dar es Salaam, Morogoro <strong>and</strong> Coast<br />
Regions. An instrument for data entry is currently in use to enable the o<strong>per</strong>ators gain the required<br />
ex<strong>per</strong>tise. The introduction of CODAS is designed to enable the coo<strong>per</strong>ative sector expedite data<br />
collection, processing <strong>and</strong> timely dissemination to relevant users.<br />
-Outcome achievement<br />
The major outcome achievements include<br />
-Enhanced public awareness on coo<strong>per</strong>ative advantage through distribution of coo<strong>per</strong>ative<br />
publications <strong>and</strong> broadcasting of radio <strong>and</strong> TV programs which has led to increased coo<strong>per</strong>ative<br />
members <strong>and</strong> formation of over 926 new coo<strong>per</strong>ative societies;<br />
-Enhanced availability, reliability <strong>and</strong> use of coo<strong>per</strong>ative data by stakeholders through<br />
implementation of Coo<strong>per</strong>ative Data System;<br />
Increased skilled coo<strong>per</strong>ative <strong>per</strong>sonnel <strong>and</strong> coo<strong>per</strong>ative officers through training.<br />
81
Template A; Coo<strong>per</strong>ative Sub-sector Result Target, related Activities <strong>and</strong> Achievements (continued)<br />
S/<br />
N<br />
Target<br />
Result<br />
Inspection<br />
<strong>and</strong><br />
su<strong>per</strong>vision<br />
services<br />
Activities for achieving the target<br />
result<br />
-To facilitate o<strong>per</strong>ationalisation of<br />
the Inspection <strong>and</strong> Su<strong>per</strong>vision<br />
Fund,<br />
-To carry out special <strong>and</strong> routine<br />
inspection in identified<br />
coo<strong>per</strong>ative societies,<br />
-To facilitate the Coo<strong>per</strong>ative<br />
Audit <strong>and</strong> Su<strong>per</strong>vision<br />
Corporation (COASCO) in<br />
conducting Coo<strong>per</strong>atives final<br />
audit,<br />
-To support 15 staff attached to<br />
coo<strong>per</strong>ative unions for capacity<br />
building,<br />
-To prepare <strong>and</strong> disseminate 4<br />
Coo<strong>per</strong>ative Inspection guidelines<br />
<strong>and</strong> conduct TOT for coo<strong>per</strong>ative<br />
inspectors,<br />
-To coordinate <strong>and</strong> facilitate<br />
payments of coo<strong>per</strong>ative societies’<br />
debts,<br />
-To coordinate 8 coo<strong>per</strong>ative<br />
societies acquisition of external<br />
loans <strong>and</strong> crop marketing,<br />
-To collaborate with COASCO <strong>and</strong><br />
other stakeholders in training<br />
Coo<strong>per</strong>ative <strong>Of</strong>ficers, Auditors,<br />
etc. in International Reporting<br />
St<strong>and</strong>ards (IFRS).<br />
Achievement<br />
-Through the Inspection <strong>and</strong> Su<strong>per</strong>vision Fund, Coo<strong>per</strong>ative <strong>Of</strong>ficers at region <strong>and</strong> district levels were<br />
facilitated to carry out inspections in 2,375 coo<strong>per</strong>ative societies <strong>and</strong> respective reports presented to<br />
coo<strong>per</strong>ative boards <strong>and</strong> members at their General Meetings.<br />
- 1,461 coo<strong>per</strong>ative societies had their accounts audited in time <strong>and</strong> presented to the members at their<br />
Annual General Meetings;<br />
-Special investigations were carried out in 7 primary coo<strong>per</strong>ative societies <strong>and</strong> 3 Coo<strong>per</strong>ative Unions<br />
whose report enabled the members to make informed decisions, <strong>and</strong> Registrar to decide on disputes<br />
<strong>and</strong> other legal actions;<br />
-In collaboration with Coo<strong>per</strong>ative Audit <strong>and</strong> Su<strong>per</strong>vision Corporation conducted one (1) seminar on<br />
the adoption of the international Financial Reporting St<strong>and</strong>ards which was attended by Coo<strong>per</strong>ative<br />
<strong>Of</strong>ficers <strong>and</strong> Coo<strong>per</strong>ative Auditors, accountants, bookkee<strong>per</strong>s from coo<strong>per</strong>ative unions <strong>and</strong> primary<br />
coo<strong>per</strong>ative societies;<br />
-Reviewed <strong>and</strong> approved budgets from 50 coo<strong>per</strong>ative societies which applied for loans from<br />
commercial banks <strong>and</strong> other financial institutions,<br />
-Ten Coo<strong>per</strong>ative <strong>Of</strong>ficers from the Department were temporarily stationed in Coo<strong>per</strong>ative Unions as<br />
accountants/managers for capacity building, to facilitate bookkeeping <strong>and</strong> accounting <strong>and</strong><br />
introduction of business skills to coo<strong>per</strong>ative staff.<br />
-Su<strong>per</strong>vision of farmers’ debt payment in Ruvuma, Mbeya, Iringa, Morogoro, Tabora, Shinyanga,<br />
Mara, Kagera <strong>and</strong> Kilimanjaro involving 50,714 farmers who were paid shs. 1.66 billion.<br />
-Outcome achievement<br />
The major outcome achievements include<br />
• Financial status of coo<strong>per</strong>ative societies established through inspection <strong>and</strong> auditing<br />
thus enabling coo<strong>per</strong>ative management <strong>and</strong> members to take appropriate informed<br />
decisions;<br />
• Coo<strong>per</strong>ative auditors, accountants, <strong>and</strong> bookkee<strong>per</strong>s <strong>per</strong>formance improved by<br />
acquisition of knowledge of IFRS.<br />
• Farmers depicted more confidence in their coo<strong>per</strong>ative institutions <strong>and</strong> government as<br />
a result of payment of long st<strong>and</strong>ing debts.<br />
82
Template A; Coo<strong>per</strong>ative Sub-sector Result Target, related Activities <strong>and</strong> Achievements (continued)<br />
S/ Target Activities for achieving the target<br />
Achievement<br />
N Result<br />
result<br />
Financial<br />
advisory<br />
services<br />
-To popularize SACCOS<br />
strengthening through various<br />
means including media <strong>and</strong> public<br />
gatherings (such as Ushirika Day,<br />
Nane Nane Day, etc),<br />
-To prepare <strong>and</strong> disseminate<br />
SACCOS o<strong>per</strong>ational <strong>and</strong><br />
business, guidelines,<br />
-To train Coo<strong>per</strong>ative <strong>Of</strong>ficers <strong>and</strong><br />
other staff on SACCOS inspection<br />
<strong>and</strong> the use of o<strong>per</strong>ational<br />
guidelines,<br />
-To promote innovation <strong>and</strong> usage<br />
of appropriate software in<br />
SACCOS,<br />
-Sensitization of people through different efforts to enable them to be acquainted with the knowledge<br />
of SACCOS; this lead to an increase in the number of SACCOS from 4,780 SACCOS in May 2008 to<br />
5,332 SACCOS in May 2009 which is equivalent to 12% increase. An increase of Membership by 15%<br />
from 713,699 in May 2008 to 820,670 members in May 2009;<br />
-As a result of mobilization campaign savings <strong>and</strong> shares increased from shs.134 billions in 2008 to<br />
shs.181.6 billions in 2009 which is an increase of 35.5%. Loans advanced to members increased from<br />
shs.228.5 billions in May 2008 to shs.383.5 billions in May 2009 which is equivalent to an increase of<br />
68%.<br />
-O<strong>per</strong>ational guidelines used by different SACCOS’ stakeholders were harmonized to produce<br />
comprehensive official guidelines <strong>per</strong>tinent to SACCOS. Four official guidelines were developed<br />
which include Accounting <strong>and</strong> Financial Management, Management Information System (including an<br />
Annex on Software requirements <strong>and</strong> st<strong>and</strong>ards), Inspection <strong>and</strong> Audit for SACCOS.<br />
-Ninety eight (98) Coo<strong>per</strong>ative <strong>Of</strong>ficers from North, East <strong>and</strong> Central zones together with 52<br />
coo<strong>per</strong>ative officers from 22 districts working with Rural Financial Services Program (RFSP) were<br />
trained on inspection <strong>and</strong> the use of SACCOS’ o<strong>per</strong>ational guidelines as part of the efforts to<br />
disseminate the guidelines <strong>and</strong> enhance promotion <strong>and</strong> su<strong>per</strong>vision of SACCOS in the country.<br />
-To facilitate restructuring <strong>and</strong><br />
improvement of SCCULT,<br />
-To facilitate 40 SACCOS staff at<br />
certificate level in microfinance,<br />
-To oversee strengthening <strong>and</strong><br />
improvement in <strong>per</strong>formance of<br />
regional coo<strong>per</strong>ative banks <strong>and</strong><br />
facilitate establishment of the<br />
National Coo<strong>per</strong>ative Bank<br />
-Savings <strong>and</strong> Credit Coo<strong>per</strong>ative Union League of Tanzania (SCCULT) was empowered <strong>and</strong> facilitated<br />
to prepare a strategic business plan as a framework for its restructuring in an effort to spur sustainable<br />
development <strong>and</strong> enable it to play a proactive role in SACCOS’ development in the country.<br />
-Kilimanjaro Coo<strong>per</strong>ative Bank Ltd was closely monitored following its poor loan recovery<br />
<strong>per</strong>formance <strong>and</strong> erosion of its core capital. A number of measures were taken to improve <strong>per</strong>formance<br />
including sensitization of members to increase their capital contributions to the bank <strong>and</strong> su<strong>per</strong>vision<br />
of election of board.<br />
-Sixteen (16) SACCOS’ managers from five (5) regions (Mwanza, Mara, Singida, Iringa <strong>and</strong> Morogoro)<br />
were sponsored to undertake a one year course in Microfinance tenable at Moshi University College of<br />
Coo<strong>per</strong>ative <strong>and</strong> Business Studies (MUCCoBS).<br />
-Various software used by SACCOS was evaluated aiming at identifying appropriate ones to be used<br />
by SACCOS for better <strong>per</strong>formance.<br />
-Outcome achievement<br />
The major outcome achievements include<br />
• Increased accessibility of financial services in rural <strong>and</strong> urban areas to the poor<br />
population in the country through SACCOS <strong>and</strong> coo<strong>per</strong>ative banks;<br />
• Increased mobilization of capital through shares <strong>and</strong> savings in SACCOS for various<br />
investment purposes by smallholders producers <strong>and</strong> entrepreneurs including farmers,<br />
livestock kee<strong>per</strong>s, traders <strong>and</strong> other groups;<br />
• Capital mobilized through SACCOS empowered farmers to participate in “Warehouse<br />
Receipt Systems” <strong>and</strong>/or acquisition of power tillers <strong>and</strong> tractors.<br />
A list of agricultural <strong>and</strong> marketing coo<strong>per</strong>atives in one of the regions is provided in the annex<br />
83
Problems <strong>and</strong> constraints faced during implementation<br />
• Limited budgeted funds which translated into implementation of fewer planned<br />
activities <strong>and</strong> with less intensity to some of the activities;<br />
• Delayed disbursement of funds relative to cash flow plans affected timely<br />
implementation of activities;<br />
• The division has limited number of staff relative to staff establishment. This factor<br />
has direct bearing on the degree of <strong>per</strong>formance.<br />
Recommendation<br />
• There is need for enhancement of budget levels of the Division to match actual<br />
requirements;<br />
• Timely release of funds as <strong>per</strong> cash flow plans will undoubtedly improve<br />
<strong>per</strong>formance of the Division;<br />
• It is im<strong>per</strong>ative that recruitment of staff of the Division is made to fill vacant positions<br />
to enable improved <strong>per</strong>formance.<br />
84
2.6 MARKETING - BY ENTIRE AGRICULTURE SECTOR<br />
The sector has made strides in marketing on both export domestic front. There have been a<br />
number of initiatives over the last few years to improve marketing, as it will be discussed below.<br />
But first we shall look at <strong>per</strong>formance in terms of physical <strong>and</strong> monetary value of goods traded<br />
as part of the sector’s role towards achievement of MKUKUTA cluster one goal. We start with<br />
export <strong>per</strong>formance.<br />
2.6.1 Cash Crops Export Volume - Physical Performance<br />
The sector’s cash crop <strong>per</strong>formance is as indicated in Table P2 <strong>and</strong> Figure P2.1, both below. Over<br />
the past five calendar years, (2005 to 2008), cash crops export tonnage fluctuated quite a bit,<br />
<strong>per</strong>haps reflecting increase in local dem<strong>and</strong>, at least for some of them. The volume of lint cotton<br />
export, for instance, stood at 112,900 tons in 2005, but then plummeted to only 55,000 tons in<br />
2007 (51 % decrease), then rose slightly to 59,100 tons (7.4% increase) in 2007, <strong>and</strong> then jumped<br />
up to 87,000 tons (47% increase) in 2008. Coffee export volume increased from 38,600 tons in<br />
2005, to 46,100 tons 9(19.4% increase) in 2006, then dropped to 31,500 tons (about 32% decrease)<br />
in 2007, before jumping to 45,000 tons (some 43% increase) in 2008.<br />
Table P.2: Cash Crops Exports volume 2005 to 2008 (January to December) – Tons<br />
Crop<br />
Years<br />
2005 2006 2007 2008<br />
Percent change Percent change Percent change<br />
Coffee 38,600 46,100 19.4% 31,500 (-31.7%) 45,000 42.8%<br />
Cotton 112,900 55,000 (-51%) 59,100 7.4% 87,000 47.2%<br />
Sisal 9,300 8,000 14.0% 9,500 18.7% 2,300 (-75%)<br />
Tea 21,800 22,400 2.7% 21,500 (-4.0%) 25,900 20.5%<br />
Tobacco 31,100 25,000 (-19.6%) 37,900 51.6% 35,600 (-6.1%)<br />
Raw ashew-nuts 62,000 66,300 6.9% 41,300 (-37.7%) 55,000 33.2%<br />
Source: Bank of Tanzania <strong>and</strong> Tanzania Revenue Authority<br />
Figure P2.1: Cash Crops Exports volume trend ( 2005 to 2008 (January to December) - Tons<br />
85
With tea, its export of 22,400 tons in 2006, was a small increase of 2.7% of 2005. From 2006, it<br />
export volume shows a slight decline of 4% (21,400 tons exported) in 2007; but then increased by<br />
20%, reaching 25,900 tons in 2008. Tobacco export volume over the past three years (2006 to<br />
2008) increased by over 50% in 2007 (reaching 37,900 tons), before declining by about 6%<br />
(dropping to 35,600 tons). Raw cashew nut export volume was also characterised by the rise <strong>and</strong><br />
fall situation over the past three years. Its export volume, which stood at 66,300 tons in 2006,<br />
nose-dived by nearly 38% in 2007,reaching 41,300 tons, before rising again by 33%, reaching<br />
55,000 tons.<br />
2.6.2 Cash Crops Export Value (Monetary) Performance<br />
Table P.3: Cash Crops Exports Value 2005 to 2008 (January to December) – ‘000 US $<br />
Crop<br />
Years<br />
2005 2006 2007 2008<br />
Percent change Percent change Percent change<br />
Coffee 74,300 61,400 (-17.4 %) 98,100 60% 97,500 (-0.6%)<br />
Cotton 111,500 55,800 (-50%) 66,400 18% 115,000 73.2%<br />
Sisal 7,300 6,100 (-16%) 8,800 -44.3% 3,300 (-62.5%)<br />
Tea 25,600 31,000 21% 28,700 (-14.2%) 40,800 42.2%<br />
Tobacco 80,800 65,200 (- 18%) 87,800 34.7% 108,100 23.1%<br />
Raw<br />
46,600 39,400 15% 25,600 (-35.0%) 40,200 57%<br />
Cashew-nuts<br />
Source: Bank of Tanzania <strong>and</strong> Tanzania Revenue Authority<br />
Figure P 3.1: Tanzania Cash Crops Performance 2005 -2009<br />
Table P3 <strong>and</strong> Figure P3.1 above, gives the picture on the sector’s cash crops export <strong>per</strong>formance.<br />
Looking at the past three calendar years (2006 to 2008) one sees cotton again <strong>per</strong>forming quite<br />
well; with annual export values increasing by 18% in 2007 <strong>and</strong> by a high of 73% in 2008; the<br />
export values being 66.4 mil US $ <strong>and</strong> US $ 115.0 mil, respectively. Tobacco too has had export<br />
values increase over the same <strong>per</strong>iod; with export value being US$ 65.2 mil, <strong>and</strong> increasing to<br />
US$ 87.8 mil in 2007 (annual increase of about 35%); <strong>and</strong> on to US $ 106.1( an annual increase of<br />
23%) in 2008. Coffee has somewhat come up strongly over the same <strong>per</strong>iod. In 2006, its export<br />
86
value was US$ 61.4 mil, climbing up strongly to US $ 98.1 (60% increase); <strong>and</strong> stayed about there<br />
in 2008 (US$ 97.5).<br />
Raw cashew nut export value dipped in 2007, to US$ 25.6 mil, compared to US $ 39.6 in 2006 ( a<br />
decrease of 35%); but then came out strongly, registering a total export value of US $ 40.2 mil, an<br />
increase of 54%. Tea portrayed a similar situation to that for raw cashew nut; with export value<br />
declining from US $ 31.0 in 2006 to US $ 28.7 ( 14.2 % decrease) in 2007, but then went up<br />
strongly to us $ 40.8 mil (42.2% increase) in 2008. On the other h<strong>and</strong> sisal export has not been<br />
impressive, both in volume <strong>and</strong> value.<br />
2.6.3 Hides <strong>and</strong> skins Exports<br />
Hides <strong>and</strong> skins export have been increasing in volume <strong>and</strong> value from 2005/06; but then there was major<br />
decline for cattle <strong>and</strong> sheep hides/ skins in 2008/09, largely due to decrease in dem<strong>and</strong> as a result of<br />
financial crisis in importing countries [ Table L 4 <strong>and</strong> Figure L 4.1 below]. Though the export efforts are<br />
commendable, there must be a very deliberate effort to develop a strong programme locally for adding<br />
value to these hides <strong>and</strong> skins through further processing into leather <strong>and</strong> leather based consumer goods.<br />
Efforts must also be made to protect such industries by eliminating dumping of related goods.<br />
Table L 4: Hides <strong>and</strong> skins Export over the last 4 years<br />
Year Cattle pieces Goats pieces Sheep pieces ValueTshs.‘000<br />
2005/2006 1,363,721 1,216,740 861,770 7,500,000<br />
2006/2007 1,700,000 1,050,000 925,530 16,200,000<br />
2007/2008 2,300,000 1,600,000 1,100,000 21,500,000<br />
2008/2009 982,668 2,700,000 769,936 12,800,000<br />
Figure L 4.1 Livestock hides <strong>and</strong> skins Exports in Tanzania<br />
Figure L 4.2 Annual Value of Hides <strong>and</strong> Skins Export: 2005/06 to 2008/09 (Tshs ‘000)<br />
87
It would be important at this junctire to take note that, with the liberalisation of economic activites in<br />
Tanzania since 1992, crop marketing in the country is very much largely undertaken by the private<br />
sector. Prices are a result of negotiations between buyers <strong>and</strong> suppliers’ representatives (with some times<br />
government faciliatation to ensure fair price to both sides). Farmers, both small scale <strong>and</strong> large scale are<br />
the suppliers <strong>and</strong> are both part of the private sector. Exporters are all private sector firms domestic <strong>and</strong><br />
foreign. The government through crop boards assist the marketing process by making appropriate<br />
arrangements/ facilities where the two parties (suppliers <strong>and</strong> buyers) can convenietly meet, like auction<br />
centres or trade fairs; <strong>and</strong> does also assist in organising <strong>and</strong> training small scale suppliers/ farmers into<br />
viable organisations, such as coo<strong>per</strong>atives, in order, among other things, to enhance their negotiation<br />
power <strong>and</strong> skills.<br />
2.6.4 Marketing Efforts by Both Public <strong>and</strong> Private Sector<br />
However, the sector has in recent years taken a number of steps in order to improve marketing<br />
of the farmers' crops <strong>and</strong> livestock; there are a number of ongoing activities by the public <strong>and</strong><br />
private sector. Thus:<br />
On-going activities<br />
The programme being implemented under AMSDP has been putting up market centres<br />
for both crops <strong>and</strong> livestock <strong>and</strong> is also improving/ rehabilitating storage facilities<br />
(godowns) in various districts of the country. Some of the market centres are Makuyuni<br />
Market Centre (Korogwe District), Kwasadala Market Centre (in Hai District), Kikatiti<br />
Livestock Market Centre ( Arumeru District), Himo Market centre (under construction in<br />
Moshi Rural District), <strong>and</strong> many more both in the northern zone <strong>and</strong> in the Southern<br />
Zone. Under the AMSDP programme some of the rural roads in the project areas have<br />
been improved in order to increase farmers produce access to market.<br />
Market centres have also been constructed under funding by government alone or with<br />
support from development partners. These include the Hedaru Livestock Market Centre<br />
(Same District), Mwika Banana Market (Moshi Rural), Mwanga Town Market <strong>and</strong> so on.<br />
The Government, through TANROADS, <strong>and</strong> under funding by itself or with assistance<br />
from development partners has been construction both trunk roads <strong>and</strong> regional roads;<br />
again one of the main reason being improving market access to farmers produce. District<br />
councils, with support from central government <strong>and</strong> or development partners has also<br />
88
een busy undertaking repair <strong>and</strong> maintenance of district <strong>and</strong> rural roads; again one of<br />
the reason being to improve market access.<br />
Government has continued to maintain liberal economic <strong>and</strong> marketing policy to<br />
facilitate private sector. However, there are still some nagging problems to farmer’s<br />
taxation, ban on cross-border trade in food crops, a thing farmers interviewed did not<br />
like.<br />
A quite positive thing done in the past two years is the introduction of the Warehouse<br />
Receipt System, where producers, through their coo<strong>per</strong>atives deposit their produce,<br />
having been given advance payment (about 70%); <strong>and</strong> are then paid the balance after the<br />
crop has been sold <strong>and</strong> all charges deducted. This system has raised farmer’s produce<br />
price to over three times what he was paid before. The programme is already in<br />
o<strong>per</strong>ation in both Mtwara <strong>and</strong> Lindi regions on cashew nuts marketing.<br />
The government has already a number of crop boards in place for all the traditional cash<br />
crops (Cotton, Coffee, Tea, Pyrethrum, Sugar, <strong>and</strong> so on) <strong>and</strong> is now in the process of<br />
establishing a crop board for the various crops not yet covered by the present crop<br />
boards. There has also been established a National Ranching Board, with its chair<strong>per</strong>son<br />
appointed in November, 2009. The boards had in the past been funded by a 5% levy<br />
charged on the respective export crop, but recently this has been changed; <strong>and</strong> the boards<br />
are now financed directly from the Treasury on a fixed, yearly budget. Some of those<br />
board leaders met by the consultant complained that the budget being allocated to them<br />
was too small to meet their costs.<br />
The Government (through MITM - BET) has been mounting agricultural produce<br />
promotional trade fairs (including Nane Nane) where producers have the opportunity to<br />
show to potential buyers what they can supply to the latter; <strong>and</strong> also the buyers have<br />
chance to say what product they want in what form.<br />
MITM in recent years has been partly funding some private farmer organisations to<br />
participate on international trade fairs, such as the Dubai horticulture international Trade<br />
Fair (2009) <strong>and</strong> the Amsterdam horticultural Trade Fair (2007). The associations had<br />
opportunity to present to prospective buyers, their members’ produce samples; <strong>and</strong> even<br />
having trade possibilities discussions with both the firms attending the Trade Fair <strong>and</strong><br />
those others in the city, but are major importers/ buyers of the type of commodities<br />
presented at the Trade Fair.<br />
There is also possibility that if the government finally sets up an agricultural bank, this<br />
would ease market credit constraint to producers <strong>and</strong> even buyers<br />
Some farmer based associations/ organisations have made a difference in reducing<br />
income poverty to the poor farmers or raising incomes even to the large scale farmers;<br />
they have shown what it takes to promote farmer’s well being particularly, in the search<br />
for market. These have really been success stories as <strong>per</strong> the presentation cases below.<br />
89
Success stories in marketing<br />
i) Activities by the Moshi based KILI-CAFÉ, a non-governmental organisation, in promoting<br />
production <strong>and</strong> marketing of speciality (quality ) coffee, especially for the export market<br />
KILI-CAFÉ helped in getting established the ‘Association of Speciality Coffee Growers’ in all the<br />
areas that had been under small scale coffee production - mainly Northern Zone, Mbinga<br />
District <strong>and</strong> Mbeya Region. Prior to KILI-CAFE moving in to support the small scale coffee<br />
farmers, through financial support, mainly from TECHNO-SERVE (USAID supported NGO),<br />
many of these growers had either lost interest in the crop or had moved out of it altogether (due<br />
to continued low prices received), as was the case in several districts in the Northern Zone.<br />
KILI CAFÉ not just organised the farmers to form the association but has also been providing<br />
other support services, including training on quality coffee production; providing the association<br />
with quality processing units for purpose of having in place central pul<strong>per</strong>ies of coffee berries (to<br />
produce quality parchment coffee beans), <strong>and</strong> searching for export markets for the association.<br />
As a result of KILI-CAFÉ’s efforts, there has been a great improvement on coffee production <strong>and</strong><br />
sales by the association - sales have improved substantially, both on local auctions <strong>and</strong>,<br />
particularly so, on the export market.<br />
The sales grew from a low of 569,859 kgs in 2002/03 (with no exports made by the association -<br />
only sold at local auction market), to 4,132,693 - an increase of 625% in 2008/09. Out of this<br />
volume sales 1,112,859 kg (or 27%) was done on the export market, <strong>and</strong> the rest at local auctions.<br />
Total Revenue received from the association’s coffee sales jumped from US $ 584,934 in 2002/03<br />
to US $ 6,804,085 - an increase of 1,063%. Average price on local auctions has been fluctuating.<br />
In 2005/06 it was Tshs 2,091 (which was double what had been received in each of the previous<br />
years). In 2006/07 there was increase to Tshs 2,337 <strong>per</strong> kg (an increase of about 7%); but then the<br />
price plummeted back to less than half this amount in both 2007/08 <strong>and</strong> 2008/09, dropping to<br />
about Tshs 1,111 <strong>and</strong> Tshs 1,106, respectively. However, in 2009/10, it bounced back to shs 2,600<br />
<strong>per</strong> kg on the local auction market.<br />
On the export market, price has been much higher <strong>and</strong> has been increasing steadily. Thus in<br />
2005/06 the price was Tshs 2,896 <strong>per</strong> kg (up from Tshs 1,818 <strong>per</strong> kg in 2004/05 - an increase of<br />
59%). In 2009/10 the price has been highest reaching average price of Tshs 4,932 <strong>per</strong> kg (an<br />
increase of 70 % over 2005/06 price; <strong>and</strong> an increase of 171% over the 2004/05 price). Figure KC<br />
1, is a graphical representation of the AKSCG’s coffee sales trend both in the local auctions <strong>and</strong><br />
the export market.<br />
The success of KILI-CAFÉ’s working with the small scale farmers association is recognised here as follows:<br />
First it shows that if small scale farmers are pro<strong>per</strong>ly organised <strong>and</strong> then provided appropriate support can<br />
achieve substantial increase in incomes over quite short <strong>per</strong>iod, thereby reducing income poverty, <strong>and</strong> even<br />
reducing food insecurity.<br />
Second, it shows that it is still possible to continue increasing small scale farmers’ crop sales value if they<br />
are provided strong, innovative market support in terms of market search. KILI_CAFE has enabled this<br />
achievement, with the association’s sales value increasing even when physical volume of crop available for<br />
sale decreased; this was the case in 2005/06 to 2007/08 - volume (in kg) dropped but export sales revenue<br />
did not drop.<br />
90
Third, appropriate support, can even bring up an almost dying export crop to attractive income heights,<br />
just as KILI –CAFÉ has done.<br />
Another lesson learnt here is that small scale farmers associations need steady continued,<br />
innovative support in capacity building for quite a <strong>per</strong>iod, in order to really succeed. KILI-<br />
CAFÉ, through donor support, has helped this association to really come up.<br />
Indeed KILI-CAFÉ has managed to improve very substantially both coffee yields <strong>and</strong> price (on<br />
the world mark) , <strong>and</strong> therefore incomes for the coffee smallholder groups <strong>and</strong> the wider<br />
association (AKSCG) it is supporting, The yield from these groups is far higher than the average<br />
yield; <strong>and</strong> the coffee is sold as premium coffee on the world market; <strong>and</strong> is very much sought<br />
after. Figure KC 1 <strong>and</strong> KC2, below illustrates the success of KILICAFE in increasing exports,<br />
both in volume <strong>and</strong> value.<br />
Figure KC1: Coffee Exports by Association of Kilimanjaro Speciality Coffee Growers – 2004/05 to 2008/09<br />
Figure KC2: Coffee Export: Assoc. of Kilimanjaro Speciality Coffee Growers – 2004/05 to 2008/09(US $)<br />
Figure KC3 Improved coffee prices to farmers <strong>and</strong> at Export market through efforts of KILI-CAFÉ (Courtesy: KILI-CAFÉ)<br />
91
2.6.4: TAHA (Tanzania Horticultural Association) Activities in Promoting Production <strong>and</strong><br />
Marketing of Horticultural crops<br />
Tanzania Horticultural Association, established formally/ registered in 2004, with the objective<br />
of promoting horticulture <strong>and</strong> addressing the general <strong>and</strong> specific needs of its members, has so<br />
far made strides so far towards promoting the horticultural business.<br />
TAHA members exports is estimated to average 9,000 to 10,000 tons <strong>per</strong> year, fetching about<br />
Euro 50 million (or about US $ 120 million) yearly. These figures were expected to double by<br />
2014 as a result of on-going private farm expansion <strong>and</strong> new investments in the industry. The<br />
current main market for the horticultural products is Europe, 75% to 80 % of fresh flowers<br />
finding room in auctions in Holl<strong>and</strong>.<br />
According to TAHA efforts are on-going to capture markets in other countries, including USA,<br />
Japan <strong>and</strong> the Middle East. Indeed it has recently been involved in strong products promotional<br />
activities, including Trade Fair participations & talks in the Middle East, specifically in the IPM<br />
Dubai International Show, where TAHA exhibited flowers (roses <strong>and</strong> other cuttings), fruits <strong>and</strong><br />
vegetables (avocado, carrots, onions, chillies, green pep<strong>per</strong>) <strong>and</strong> spice; with financial support for<br />
TAHA’s participation coming from Tanzania Government (through MITM), <strong>and</strong> the<br />
USAID/TAP project. Some of the TAHA members provided free samples for the exhibition.<br />
In this event in the UAE, the TAHA exhibition team was on almost continuous discussion with<br />
several firms from UAE <strong>and</strong> even from other Middle East countries (including Saudi Arabia)<br />
that had shown interest in buying products from Tanzania; at least 8 firms did show serious<br />
interest. The team also managed to hold discussion with major fruit <strong>and</strong> vegetables importers,<br />
including the Dubai Union Corp <strong>and</strong> the Barakat Vegetables <strong>and</strong> Fruits International. The TAHA<br />
exhibition team received logistical support from the Tanzania Trade Centre in Dubai.<br />
Previous to the Dubai event (specifically in 2007), TAHA had exhibited in (what was viewed as the<br />
biggest horticultural show in the world), the ‘International Hortifair’ in Rai, Amsterdam, where TAHA<br />
won a bronze medal for the best st<strong>and</strong> design <strong>and</strong> products presentation - there were over 1,000<br />
exhibitor from all over the world.<br />
TAHA members are reported to have been employing annually, over 10,000 <strong>per</strong>manent workers<br />
<strong>and</strong> many more casual workers. These numbers are expected to double by 2010. Its current<br />
(2009) membership is 82, drawn from all over Tanzania, <strong>and</strong> membership drive is continuing.<br />
Among its current membership are 14 exporters <strong>and</strong> 45 member companies, whose horticulture<br />
exports include fresh cut-flowers, fruits, vegetables, seeds <strong>and</strong> flower cuttings. It has also<br />
associate members including small growers/ grassroots associations <strong>and</strong> consultancy firms.<br />
TAHA has also established partner links with several entities, including government <strong>and</strong><br />
government agencies (MAFC <strong>and</strong> MITM ministries, Bank of Tanzania, Tanzania Investment<br />
Bank, Board of External Trade <strong>and</strong> Business Registration <strong>and</strong> Licensing Authority - BRELA);<br />
Development Partners (especially USAID which has been providing support), Business<br />
Environment Strengthening for Tanzania Advocacy Component (BEST – AC), World Summit<br />
on Sustainable Development (WSSD) - the Partnership on Market Access program; major<br />
private firms, including Kilimanjaro Air Ports Development Company (KADCO), Fintrac (of<br />
Tanzania Airfreight Project - supported by USAID), Swissport Tanzania Ltd (air freighting<br />
firm), Enterprise Works MTA – the Eastern Arc Tree Crop Project, Kuehn & Nagel, <strong>and</strong><br />
ACDIVOCA - Smallholder Horticulture Out-grower Promotion (SHOP).<br />
92
Other achievements of TAHA, apart from promoting the industry internationally <strong>and</strong> locally,<br />
include:<br />
Successful initiation <strong>and</strong> implementation of various development projects, among which<br />
is the WSSD Public Private Partnership projects<br />
Initiating <strong>and</strong> implementing USAID funded projects<br />
Advocacy Projects, addressing infrastructural constraints under funding by BEST – AC<br />
Initiation <strong>and</strong> implementing the Small growers capacity Wider membership network in<br />
the country<br />
Members Technical Capacity building through various technical training programs<br />
Building the industry <strong>and</strong> TAHA through media sensitization initiatives; <strong>and</strong><br />
Formation of HODECT (Horticultural Development Council of Tanzania), Public/<br />
Private Platform (a policy body) that is seeking to fast truck horticultural issues on<br />
social – economic growth.<br />
However, TAHA members business is facing a number of constraints, including:<br />
The Global Economic Meltdown is likely reversing the fortunes of TAHA. From October 2008,<br />
vegetable <strong>and</strong> flower prices on average have declined by 30 to 50% as compared to same <strong>per</strong>iod in<br />
2007. Some flower types <strong>and</strong> lengths lost market all together, from October 2008.[Source: Internet]<br />
Unfavourable banking financing term - no long term (7 to 10 year) loans. Banks consider<br />
horticulture as high risk funding venture<br />
Inadequacy in air-freighting from Tanzania - cite absence of dedicated cargo flight<br />
services; also flights are too infrequent, forcing exporters to transport to Nairobi for the<br />
produce to be air-freighted there, a thing that add costs in terms of transport to Nairobi<br />
<strong>and</strong> the fact that Nairobi charges high unit cost for air-freighting small cargo.<br />
Inadequate road infrastructure limits the industries access to new potential l<strong>and</strong>s<br />
There is competition for irrigation water for horticultural production; <strong>and</strong> there is also<br />
inadequate enforcement of water rights laws/ regulations<br />
Unavailability of pro<strong>per</strong>ly trained people for the industry (including skilled workers for<br />
irrigation, spray application, quality control <strong>and</strong> small scale grower training)<br />
It is very difficult to obtain l<strong>and</strong>, due to wide spread squatting; <strong>and</strong> even when allocated<br />
there are almost ceaseless claims on it by those that had been compensated off; <strong>and</strong> the<br />
authorities that be seem not to enforce l<strong>and</strong> allocation firmly; <strong>and</strong> even if one resolves to<br />
go to court, the cases take far too long for justice to be expensed.<br />
Inadequate extension service; small growers, the real target for the service, can hardly<br />
access the service, which instead seems to take ‘an adversarial view to interaction with<br />
business.<br />
The government run projects like AMSDP, PEDEP, <strong>and</strong> so on are difficult to access, <strong>and</strong><br />
‘seem to be structured in a way that precludes private sector participation’<br />
93
Inadequate local input supply <strong>and</strong> the associated high costs reduce the industry’s<br />
competitiveness. It is also difficult to widen the range of inputs brought into the country<br />
due to what is called ‘ bureaucratic procedures <strong>and</strong> high costs involved in registering<br />
products in the country’, thereby de-motivating manufacturers to register a wider range<br />
of effective input products.<br />
Stringent market conditions in the horticultural products importing countries are a big<br />
constraints to exporters. There has been evolution of multiple st<strong>and</strong>ards that mean<br />
increased compliance costs to growers, rendering access to new market difficult.<br />
Drip irrigation at Kiliflora (flower farm) , in Meru District<br />
Drip irrigation at Zonal Irrigation <strong>Of</strong>fice backyard vegetable<br />
farming, Morogoro<br />
2.6.5 Marketing Constraints in General<br />
Even with the efforts being put up in promoting marketing of farm produce, still lack of reliable,<br />
developed market, both on the domestic <strong>and</strong> export market was cited (<strong>and</strong> was observed) during<br />
the study as a major constraint ham<strong>per</strong>ing farmers’ (<strong>and</strong> even smaller traders’) efforts towards<br />
achievement of reduction of income poverty <strong>and</strong> food security. Even just driving along the<br />
highways, one easily recognises the producers’ problem of getting customers once talking with<br />
them. Along the roads you see long lines of tins of vegetable <strong>and</strong> fruits yawning for customers;<br />
for instance along the Arusha to Dar highway. Market for vegetables <strong>and</strong> fruits for the small<br />
scale farmer is very much wanting, with some of these products rotting in front of the farmers<br />
eye <strong>and</strong> even those already in market places (in Dar, Iringa, Moshi, Muheza, <strong>and</strong> so on) -<br />
rotting oranges, rotting bananas, <strong>and</strong> so on.<br />
At Segera (in Korogwe District - at junction to Arusha -Tanga Highway, as one gets there from<br />
Dar es Salaam), particularly immediately after harvest time one sees heaps <strong>and</strong> heaps of oranges<br />
or tangerines poured on the ground with some of the fruits rotting. Fortunately, there are now<br />
on-going activities of constructing an international fruit <strong>and</strong> vegetable processing factory there.<br />
It is hoped that this one will take off <strong>and</strong> reduce at least part of the fruits/ vegetable that rot<br />
yearly in Tanga Region . Before there was a fruit juice processing factory in Korogwe also, but<br />
this one collapsed, largely due to competition from massive inflow of juices into the country, as<br />
result of likely inadequate industrial policy.<br />
Export crops too have been facing contracted market due to the global economic meltdown. Both<br />
coffee <strong>and</strong> cotton prices has fallen by half in the past two years, due to buyers unable to list as<br />
much crop as they did before due to credit crunch on the international market. Actually with<br />
cotton, the situation got so worse that the government saw it necessary to provide price subsidy<br />
94
to buyers that had already purchased the crop from farmers but then the world prices fell short<br />
to almost past the price at which the buyers had paid to the farmer. Coffee buyers too were also<br />
up making request to government to provide them price subsidy too. In the above section on<br />
TAHA we did indicate some of the marketing problems the horticultural producers were facing.<br />
Actually some of these affect other produce too; <strong>and</strong> are rather typical for large scale private<br />
farming investments, as whole..<br />
Below are some of the general problems facing farm produce marketing in general,<br />
particularly with small-scale producers:<br />
• Most farmers are more or less price-takers for both input, crop <strong>and</strong> livestock products;<br />
many have no price information; nor where else to sell except at farm gate <strong>and</strong> village.<br />
• Most farmers have low bargaining ability/power. Hence for some crops (cashew nut in<br />
particular) government had to step in to assist raising price to farmers by setting indicative<br />
price; <strong>and</strong> to require all the crop to be sold under the ‘Warehouse Receipt System<br />
• Existence of price cartels - practiced by some groups of particular export crop buyers;<br />
<strong>and</strong> even domestic market crop buyers. These exist at auctions <strong>and</strong> is also with<br />
wholesalers (for instance fruit markets at Buguruni <strong>and</strong> is reported to be even at some<br />
neighbouring market centres).<br />
• Existence of some traders who trick some farmers to sell them cashew nut at throw-away<br />
price; for instance buying even before crop mature (say) in paddy field ; or buying fruit<br />
while still immature on the tree; or by buying using non-st<strong>and</strong>ard measures, such as<br />
‘Rumbesa of paddy’ buying at Dakawa Irrigation Scheme; or use of ‘kiroba’; or<br />
‘kangomba ‘for cashew buying; all of whose fill is not determined.<br />
• Over-dependence on one export market (for instance India for raw cashew nut). Or<br />
having too few buyers at auction. Both reduce market competition, <strong>and</strong> indeed prices<br />
• Price fluctuation; unstable prices, at local markets; hence unreliable export market.<br />
• High cost of transport of produce to market (to primary societies; warehouses receipt<br />
system centres, <strong>and</strong> so on).<br />
• Poor grading of crop by farmers, prior to getting it into the primary society store; hence<br />
down- priced or rejected (for instance at the warehouse receipt system point of outward sale; or<br />
at time of resale to processors or wholesale buyers).<br />
• The buying primary societies (or agent) not doing grading due to either pressure of the<br />
buying exercise from the farmers, or due to not having grading equipment<br />
• Some farmers bringing for sale produce containing some produce that is either immature<br />
or unripe, or (soaked in water to increase weight) <strong>and</strong> this is unwittingly mixed with<br />
good one (say at primary marketing society) it does spoil the rest of the produce<br />
• High interest charges by the banks to crop buying coo<strong>per</strong>ative unions/ primary societies;<br />
(<strong>and</strong> this may be charged on the whole loan immediately contract is signed, though<br />
actually the amount is taken out by the borrower, slowly as the crop buying proceeds).<br />
High interest charges have made some coo<strong>per</strong>ative unions to either go bankrupt or<br />
accumulate unserviceable debts.<br />
95
• Bureaucracy <strong>and</strong> complexities in securing bank loans for purchase of crop (by<br />
coo<strong>per</strong>ative societies/ unions)<br />
• High storage charges by warehouse owners. Some private firms charge a fixed amount<br />
irrespective of how much of the coo<strong>per</strong>atives/ union’s crop was still in store<br />
• Inadequate (physical, financial) management knowledge/ skills in coo<strong>per</strong>ative societies<br />
or marketing societies - low / poor physical, financial <strong>and</strong> negotiating skill.<br />
• Coo<strong>per</strong>ative societies/ unions have no working capital of their own to contribute to<br />
purchase of the crop from their farmers<br />
• Poor management of SACCOS; hence unable to support their members by providing<br />
them with credit while (for instance in case of warehoused crop) awaiting for the<br />
warehoused crop to be sold (instead of the unions having to borrow money expensively from<br />
the banks to enable first payment to such members).<br />
• Sometimes too much time lapse between purchase from farmers <strong>and</strong> eventual sale to<br />
exporters/ processors. [This can build up cost of sales in terms of interest charges or collateral<br />
management]<br />
• Primary societies/ Farmers not knowing the final selling price of their cash crop sold<br />
(either under warehouse receipt system or under various auctions). This may reduce<br />
farmer’s power to negotiate on price received.<br />
• Under-developed domestic market for both crops <strong>and</strong> livestock - no clear linkages,<br />
market information/ communication difficult; market facilities still very inadequate.<br />
• Use of poor quality packing materials can reduce quality; <strong>and</strong> eventually overall price to<br />
farmers.<br />
• Poor packaging, that would make the product being sold attractive <strong>and</strong> also clearly,<br />
attractively packaged.<br />
• Poor h<strong>and</strong>ling <strong>and</strong> storage facilities at farmer <strong>and</strong> even at coo<strong>per</strong>ative society.<br />
• The promotion of the Tanzania cash crops is still inadequate; needs much more<br />
aggressiveness.<br />
• Marketing training to farmers <strong>and</strong> small traders is inadequate; even the Warehouse<br />
Receipt System is still not clear to many farmers contacted<br />
• Most farmers still sell their crop without even primary processing to add value; for<br />
instance paddy.<br />
• No District level section/ unit charged with promoting marketing of district crops<br />
• Overall quality of most produce still far unsatisfactory for most crops; <strong>and</strong> livestock.<br />
• Spaces that had been set aside as market centres have almost disappeared in several<br />
urban centres (<strong>and</strong> in districts with high population density); as in the case of Moshi <strong>and</strong><br />
Rombo districts. The areas had been encroached or eaten up by residential housing. There<br />
is need for designated market places to be provided with l<strong>and</strong> titles. Similarly, for all designated<br />
public services places.<br />
96
2.7 PROCESSING - BY ENTIRE AGRICULTURE SECTOR<br />
2.7.1 On Small-scale Processing<br />
In the area of agro-processing as a whole much remains to be done; particularly so for small<br />
scale processing to add value.<br />
There has been some attempt in small scale processing, for instance for cassava in the Coast<br />
Region; <strong>and</strong> in the processing of fruits, for instance in producing banana wine done in<br />
Kilimanjaro <strong>and</strong> Kigoma Regions. In Tanga <strong>and</strong> Kilimanjaro Regions there are in addition small<br />
scale/ group processing of milk (like the Tanga Fresh long life milk), soybean processing to<br />
produce various products, including milk <strong>and</strong> sausages; a processing now being undertaken in<br />
Hai District; as well as small scale processing of cashew nuts in Coast Regions; <strong>and</strong> small scale<br />
oil processing in various places, including Singida <strong>and</strong> Arusha Regions.<br />
On the other h<strong>and</strong> small scale grain milling machines for maize <strong>and</strong> paddy (to produce rice) are<br />
well spread throughout the country; even in the district visited this was observed. There are also<br />
large scale grain milling machines for wheat, maize <strong>and</strong> paddy/rice, mostly in major urban<br />
areas; unlike the small ones found in most wards. These small machines also mill millet for local<br />
brewing. There are also few that mill sorghum.<br />
There are in addition, a number of small scale animal feed processing plants in places such as<br />
Arusha, Moshi, Tanga <strong>and</strong> Dar es Salaam. Otherwise much of on-going agro-processing is being<br />
done under large scale processing.<br />
2.7.2 On Large-scale Processing<br />
2.7.2.1 Large scale seed cotton ginning / processing<br />
Private sector investment in (large scale) seed cotton ginning/ processing since 2001<br />
revolutionized the cotton ginning industry. Gone more or less is the agony of slow ginning<br />
which saw a year’s seed cotton ginning, spilling over up to three years even, with consequent<br />
loss in quality or total loss by the buyers; under then public administered coo<strong>per</strong>ative unions,<br />
which totally failed in this business, <strong>and</strong> even went bankrupt almost, only to have their debt (to<br />
banks <strong>and</strong> others) taken over by the Government. Even after this big assistance they seem not to<br />
have been able to run profitable business in this field. The unions that still have ginneries, <strong>and</strong><br />
these are the slow roller gins, have hired them out to private entrepreneurs. The ginning<br />
industry can now gin within a fairly short <strong>per</strong>iod all the seed cotton produced each year. There<br />
are some 20 saw gins in the WCGA, <strong>and</strong> 50% of these were built in the <strong>per</strong>iod 2006 to 2008. All<br />
together there are 65 ginneries in the WCGA, most of which (54) are in Shinyanga <strong>and</strong> Mwanza<br />
regions. The rest (11) are in Mara, Tabora <strong>and</strong> Kagera <strong>and</strong> Singida regions.<br />
The private sector investors brought into the industry fast saw ginning technology, machines<br />
that are mounted with gins that can process seed cotton, turning out 40 bales lint, (each 200 kg)<br />
<strong>per</strong> 8 hours or 120 bales <strong>per</strong> 3 shifts (24 hours); compare this with the old technology of using<br />
roller gins that can only turn out 4.5 bales (each 1821 kgs) in 8 hours, or 13.5 bales <strong>per</strong> 3 shifts (24<br />
hours)!. Besides in these ginneries, the investors are local people either wholly or in partnership.<br />
These private sector people have enabled the spreading of ginneries to the entire WCGA, which<br />
produces almost all the cotton in Tanzania. Producers are now within short distance of their<br />
97
nearest ginnery; no need to travel long distances, using a lot of time <strong>and</strong> money to take seedcotton<br />
to market. Furthermore, these new ginning plants have oil processing units attached to<br />
them; they thus can produce lint <strong>and</strong> cooking oil (cotton seed oil) alternately. The ginning<br />
The main setbacks/ constraints in this ginning industry are two -fold:<br />
i) Increasing deterioration of seed cotton quality both at farm level <strong>and</strong> at buying posts. The<br />
quality control services that used to be provided at entry to ginneries by the Cotton<br />
Board have been terminated recently by the buyers, who insist that the cotton they are<br />
buying <strong>and</strong> bringing to the ginneries is theirs <strong>and</strong> if there was going to be made any loss<br />
it is themselves who will bear it!. This is very dangerous st<strong>and</strong> indeed; this can kill the<br />
cotton market on the export market; or Tanzania would be condemned to producing<br />
poor cotton that fetches low export prices <strong>and</strong> in turn unable to offer cotton farmers<br />
rewarding price! This situation should be arrested sooner than later. Indeed such a<br />
situation should not be allowed for any export crop. It is a pity when countries like India,<br />
Vietnam <strong>and</strong> others are fighting for ISO st<strong>and</strong>ard award for almost all their export<br />
products (in order to guarantee premium market <strong>and</strong> therefore high prices), Tanzania<br />
should find itself in such mess.<br />
ii) Farmers whose seed cotton would lead to premium grade lint are not paid premium<br />
prices. This again is due to this grading mess. No sufficiently dis-aggregative grading.<br />
Currently there are only two grades of seed cotton AR (first grade) & BR (second grade).<br />
In some countries like Zimbabwe there are 6 seed cotton grades (A – F), with those with<br />
premium quality seed cotton paid premium price, <strong>and</strong> so on, till the sixth grade which is<br />
F.<br />
iii) Seed cotton marketing centres/ point are a ramshackle of sight. It is a pity that in areas<br />
where so many billions of shillings are reportedly received by farmers <strong>and</strong> traders every<br />
year, there are no market centres or even a semblance of that.<br />
iv) The Ukiriguru Zonal Research Centre, which for almost three-quarters of a century has<br />
been responsible for guiding technological infusion into the WCGA was reported to be<br />
seriously short of staff, with almost all the ex<strong>per</strong>ienced ones due to retire shortly. This is a<br />
serious matter that has to be addressed quickly. The centre has <strong>per</strong>iodically been turning<br />
out improved cotton varieties, for instance its UK 99 released in 1999, is a much higher<br />
yielding variety than its predecessor <strong>and</strong> has much higher Ginning Out Turn (GOT) of 37<br />
% lint <strong>and</strong> 34% seed. The new UKM, originally from Mali <strong>and</strong> adopted into Tanzania <strong>and</strong><br />
whose seed is now being bulked by selected seed farmers was released in 2008; <strong>and</strong> even<br />
higher GOT of 42% lint. Currently the research centre is being funded by a basket fund<br />
(called Cotton Development Fund - CDF) of cotton stakeholders comprising Tanzania<br />
Cotton Farmers Association (shs 20 <strong>per</strong> kg seed-cotton sold), Ginners (0.3% of turn-over),<br />
Traders (0.5% of turn-over). [The former two plus the Tanzania Cotton Board (the government<br />
Regulatory Body for cotton) form the Tanzania Cotton Association (TCA)].This is a good<br />
example of Public Private Partnership.<br />
v) Some of the researchers were reported to have left work due to what they said was low<br />
salaries <strong>and</strong> lack of incentives. Apparently, by regulation their salaries cannot be topped<br />
up from the CDF. Lack of incentives breed poor work, so it is an area the government<br />
<strong>and</strong> stakeholders should look into <strong>and</strong> redress, particularly in the current world times of<br />
highly competitive technology <strong>and</strong> trade; <strong>and</strong> the climate change.<br />
98
Overall the ginning industry is a success story for local industrialization, producing semifinished<br />
products. However, the industrialists, need to up-scale their industrialization <strong>and</strong> move<br />
also into production of textile material to add value to Tanzania lint cotton instead of allowing<br />
nearly all to be exported raw; about 75 to 80% of Tanzania cotton is exported raw. Yet the market<br />
opportunity for products like cotton yarn, blended yarn, grey <strong>and</strong> finished fabrics, are said to be<br />
still in high dem<strong>and</strong> locally, regionally <strong>and</strong> even on the export market. One local firm which<br />
took over a privatised public textile mill in 2003, <strong>and</strong> highly modernised it (to be the largest<br />
textile mill <strong>and</strong> one of the most modern in the whole of East Africa) is now turning out yearly,<br />
some 4,000 tons of cotton <strong>and</strong> blended yarns <strong>and</strong> 16 million metres of grey <strong>and</strong> finished fabrics,<br />
<strong>and</strong> most of this sold on the domestic market; while some of the grey fabrics <strong>and</strong> cotton yarn<br />
have found a growing markets in EU <strong>and</strong> USA. [Internet]<br />
Quick action required on the cotton industry:<br />
o<br />
o<br />
o<br />
o<br />
o<br />
o<br />
o<br />
Provide sensitization to farmers <strong>and</strong> traders <strong>and</strong> other relevant stakeholders<br />
(transporters, <strong>and</strong> so on) on quality assurance for seed cotton, from farm right to buying<br />
centres <strong>and</strong> into ginnery.<br />
Institute cotton by-laws that will bind farmers, ginners, traders <strong>and</strong> other stakeholders to<br />
maintain seed cotton quality<br />
Institute a by-law/ regulation that will require more ranges of grading for seed cotton in<br />
order to reward premium producers<br />
Seed cotton market centres be modernised<br />
Mount search for more market niches for the ginned cotton<br />
Provide more funding <strong>and</strong> incentives to cotton researchers<br />
Promote more textile products manufacturing to add value to the raw crop<br />
2.7.2.2 Other Large scale Agro- processing factories<br />
Other large-scale factories which are all private sector o<strong>per</strong>ated <strong>and</strong> fully owned or are owned in<br />
partnership with local entities. These large scale factories include the tea factories (in Iringa<br />
Region <strong>and</strong> Lushoto District); the large scale Sugar processing factories of Kilombero (I &II),<br />
Mtibwa (Morogoro), <strong>and</strong> the TPC Ltd (Moshi); there are also the big flour mills in major cities,<br />
especially Dar es salaam; the major Bakery factories in the major cities including Dar es Salaam;<br />
the Sisal Decorticating factories in (Tanga Region), the Pyrethrum Processing Factory in Iringa,<br />
the Paprika Spices processing factory in Iringa; <strong>and</strong> even much bigger, the Tobacco Processing<br />
factory (producing cigarettes <strong>and</strong> other forms of tobacco products) in Dar es Salaam {This one<br />
may not be a really friendly factory due to its high dem<strong>and</strong> on wood for flue-cured tobacco preliminary<br />
processing - decimating trees <strong>and</strong> leaving l<strong>and</strong> bare of trees in its wake; it is better if it is barley tobacco<br />
type produced as this is sun- cured. May be for the flue-cured type they could use coal from Kiwira!.<br />
Tobacco enterprise/ business is a controversial business in any case}.<br />
There are also some large scale private cashew nut processing plants in o<strong>per</strong>ation in Lindi,<br />
Mtwara, Coast <strong>and</strong> Ruvuma regions. But there are also a number of the so-called privatised<br />
factories that have been idle for some 5 years or more. It seems the owners’ pace of getting the<br />
factories into o<strong>per</strong>ation, if at all, is far too slow. Actually, out of existing twelve cashew nut<br />
factories only four were reported to be in o<strong>per</strong>ation; one in each of Newala, Masasi, Lindi <strong>and</strong><br />
99
Tunduru districts. Two of the idle factories in Dar es Salaam may not come on board for quite a<br />
while, as one of these TANITA II was reported to have been v<strong>and</strong>alized, <strong>and</strong> the other TANITA<br />
I, has had its machines sold out.<br />
As for large scale fruits processing; there are two large scale fruit processing factories, one in<br />
Morogoro <strong>and</strong> one in Dar es Salaam; <strong>and</strong> another one called International Fruit Processing<br />
Factory is under construction at Segera (as already stated above). There is also a fruit <strong>and</strong><br />
vegetable processing plant in Soni, Lushoto District.<br />
As for livestock; after the demise of the big Tanganyika Packers Factory in the late 1960s; <strong>and</strong><br />
the never completed plants at Mbeya <strong>and</strong> Shinyanga, the Government did build a meat<br />
processing factory in Dodoma Region, but this was recently privatised; <strong>and</strong> is therefore privately<br />
run. The Government, after waiting for rather long time to get serious investors for its national<br />
ranches (at Ruvu, Kongwa, Kagera, Morogoro, Tanga <strong>and</strong> so on) without success, has recently<br />
decided to revive the National Ranching Company (NARCO), <strong>and</strong> run it under this agency<br />
company. Lately a Board Chair<strong>per</strong>son has been appointed; <strong>and</strong> construction of what is said to<br />
become very major Meat Processing Factory, is underway, <strong>and</strong> a manager for running the<br />
factory is already on board.<br />
Further, there are leather tanning factories in various parts of the country, including Mwanza,<br />
Moshi <strong>and</strong> Himo.<br />
As for crop inputs production, there is only the Minjingu Rock Phosphate factory, producing, as<br />
its name suggests, rock phosphate for applying on feed crops. But it is not producing enough for<br />
the country. Otherwise, additional phosphorus fertilizer together with all other fertilizer needed<br />
in the country is imported. There was a fertilizer production factory in Tanga but then this died<br />
in the 1980’s, due to what it is said, poor management.<br />
Nevertheless, agro-processing capacity in the country is still very low both in large scale <strong>and</strong><br />
small scale levels: Many crops, for years, have been exported raw, without any value added to<br />
raise the farmer’s income <strong>and</strong> thus reduce income poverty. Most of the coffee has been exported<br />
raw since 1920s; not even as roasted, a thing that could increase value by over 20 times in some<br />
cases. Quality roasted coffee is in dem<strong>and</strong> in Europe, Japan <strong>and</strong> other countries too. Most of the<br />
cotton, for nearly a century has been exported raw; no even processing it to produce yarn! Most<br />
of the animal skins are exported as raw products in form of hides <strong>and</strong> skins. Most of the sisal<br />
(produced mostly by the large scale private investors), is also exported raw. Almost all the sugar<br />
produced (from sugar cane under large scale investor enterprises in collaboration with small<br />
scale out-growers) is all for the cup; there is hardly any further processing done on it in the<br />
country.<br />
Most of the raw cashew nut (up to 90%) have been exported raw for almost 70 years, now. Yet<br />
there are several world-dem<strong>and</strong> products that could be produced from this, including kernels, cashew nut<br />
liquid oil, wine, leather tanning chemical, motor vehicle hydraulic oil, biscuits, <strong>and</strong> many more - up to 30<br />
products it is said)! Processed cashew-nut products are reported to be a hot cake on the world market<br />
kernels fetch as much as US $ 7to 8 <strong>per</strong> kg on the USA market. But subsequent roasters can fetch as much<br />
as 4 to 5 times <strong>per</strong> kg, according to sources from CBT.<br />
This scenario (of low agro-processing) is not a comfortable position at all for the country,<br />
particularly if the country is to meet its MGDs, MKUKUTA <strong>and</strong> TDV 2025 goals.<br />
100
There are a number of constraints ham<strong>per</strong>ing agro-processing in the country. These are<br />
presented below.<br />
• Part of the low large scale processing capacity, is contributed by the fact:<br />
o most of the large-scale cashew nut processing factories built in the 1980s <strong>and</strong> privatized in<br />
the 1990s are yet to restart cashew nut processing.<br />
o -Some meat packing plants that were in construction in the 1970s are yet to be completed<br />
• Scarcity of / lack of small scale agro-processing machines (including for cashew nuts)<br />
• There seems to exist several small scale agro-processing groups for various produce, whose<br />
whereabouts are not quite known; therefore not easy to be provided with training <strong>and</strong> other business<br />
support services<br />
• Most small scale agro-processors have not been provided adequate training on processing skills<br />
• Scarcity of qualified agro- processing trainers<br />
• Currently crop processing as a whole (including for raw cashew nuts) is viewed as women <strong>and</strong><br />
youth activity; <strong>and</strong> even if training is done is only for the two categories of population, with no<br />
participation of men<br />
• The few existing small scale processing plants lack adequate o<strong>per</strong>ating capital<br />
• There is limited market for small-scale processed goods (including cashew nuts)<br />
• Farmers/ coo<strong>per</strong>ative societies/ unions have not been provided training on how to add value to<br />
their raw produce through processing<br />
• In a number of cases there is low % out-turn of processed products due to low quality raw<br />
materials sent in for processing<br />
• Lack of as yet, vigorous promotional programmes for sensitization directed at small scale agroprocessing<br />
activity enhancement<br />
• Low wages paid to workers in the few existing, (large-scale) o<strong>per</strong>ating factories, may be a<br />
disincentive to workers in increasing productivity<br />
• There are possible health risks as result of workers congestion in major factories; <strong>and</strong> the constant<br />
odour from the actual processing activities (for example in cashew nut <strong>and</strong> leather tanning<br />
factories).<br />
• Complaint by Large scale Processors that not sufficient raw material (in the case of raw cashew<br />
nuts) were available for local processing due to unfair competition from foreign buyers; as a result<br />
wanting Government to promulgate a policy where a substantial <strong>per</strong>cent of cashew nut crop<br />
produced would be destined for local processing in order to sustain the local industry <strong>and</strong> to<br />
guarantee cashew nut factory workers’ jobs<br />
• The act of hiring the premises of privatized large scale cashew nut factories’ premises to be used<br />
as raw cashew nut warehouses under the ‘Warehouse Receipt System’ seemed to be a factor in<br />
slowing down further of their pace of rehabilitation of the factories.<br />
Quality Cashew nuts – 1 st Grade’ from small –<br />
scale processors in Mtwara Region<br />
Cashew nut Kernels of good grade, but quality reduced due to uneven<br />
roasting<br />
101
2.8 Assessment on Progress Made in Planning, Formulation <strong>and</strong> Implementation of<br />
the District Agricultural Development Plans (DADPs)<br />
- (by both men <strong>and</strong> women; <strong>and</strong> determining the outcomes so far started to be achieved, towards<br />
reducing rural poverty).<br />
2.8.1 Preamble<br />
Information/ data for undertaking this assessment was obtained from both secondary <strong>and</strong><br />
primary sources. The <strong>Agriculture</strong> Sector Development Programme (ASDP) is the sector’s tool for<br />
implementing the sector’s agricultural Development Strategies (ASDS); at the district level ASDP<br />
does the implementation of the sector’s development through the District Agricultural<br />
Development Plans (DADP). The objectives of ASDP are threefold; enhancing agricultural<br />
productivity <strong>and</strong> profitability, reducing poverty <strong>and</strong> ensuring food security. To achieve the<br />
ASDP objectives the DADPs that are prepared for implementation have to be of good quality. In<br />
this ASDP tool/ programme, District Councils are charged with the responsibility of overall<br />
formulation, preparation <strong>and</strong> implementing the DADPs as part of overall District Development<br />
Plans (DDPs). ASLMs on the other h<strong>and</strong> are charged with the role of to ensuring the quality of<br />
DADPs design <strong>and</strong> implementation.<br />
ASLMs carried out quality assessment of DADPs in 2008, using what is called ‘updated DADPs<br />
assessment framework’.<br />
The basic structure of the criteria for the assessment comprises seven aspects, which are:<br />
Structure of the DADP;<br />
DADP context;<br />
Performance Assessment (PA);<br />
Grant utilization;<br />
Budget;<br />
Action Plan <strong>and</strong><br />
M&E Plan.<br />
In 2008, major amendments were made to the characteristics used for the assessment, these<br />
being:<br />
• Addition of “Phasing in/out of villages”, i.e. selection of a few villages of high potential.<br />
Also as LGAs have presently been required to prepare write-ups for investment projects,<br />
assessment on DADPs was also made on:<br />
• Profitability <strong>and</strong>/or Economic viability (for investments),<br />
• Sustainability <strong>and</strong><br />
• Environmental <strong>and</strong> social management consideration<br />
102
The weighting assessment for different aspects as provided under Table W1; maximum score,<br />
being 100%; with 80 to 100, being ‘very good’<br />
Table 2 w1: Number of Characteristics <strong>and</strong> Weight given to various assessment aspects<br />
Weight given in the present<br />
Aspect<br />
assessment<br />
DADP Structure 5<br />
DADP Context 40<br />
Considerations to the Performance Assessment (PA)<br />
25<br />
Criteria<br />
Grant utilization 10<br />
Budget 10<br />
Action Plan 5<br />
M&E 5<br />
Total 100<br />
2.8.2 The team assessment results<br />
Results of the assessment showed that the <strong>per</strong>centage of districts producing good quality<br />
DADPs in 2008 had improved, being 48%, as against 20% in 2007. DADPs found to be fair in<br />
2008 were 37% compared to 50% in 2007; <strong>and</strong> the poor ones in 2008, were 14% as against 29% in<br />
the previous year. The three best councils (i.e. scoring most points) Tabora Municipal (92 points),<br />
Iringa District (84) <strong>and</strong> Kilombero (83 points). The districts scoring least in 2008 were Kilolo (22),<br />
Makete (26) <strong>and</strong> Simanjiro (29). National average score was 58 points. At regional level, the best<br />
three in 2008 were Tanga, Tabora <strong>and</strong> Mbeya; while the least <strong>per</strong>formers were Arusha, Kigoma<br />
<strong>and</strong> Iringa. Performance<br />
As for specific findings in 2009, in respect of assessment aspects, these were as follows:<br />
a) On Presentation format: 93% of the LGAs adhered to the Presentation format (DADP<br />
structure)<br />
Observation made during the field visits to Misungwi, Musoma rural, Rorya, Kilombero,<br />
Korogwe, Mvomero, Meru, Moshi rural <strong>and</strong> Mbeya districts was that the DADP formats are<br />
adhered to.<br />
b) On planning aspect: 73% of LGAs <strong>per</strong>formed well in respect of link of mission/objectives/<br />
target with ASDP objectives; 69% on linkage with targets; <strong>and</strong> 59% on analysis of key problems<br />
(59).<br />
It was also found that:<br />
• There is weak underst<strong>and</strong>ing of village phasing out by LGAs where by about 52% of total<br />
LGAs did not indicate the village phasing out plan.<br />
• There is weak linkage with Zone Research Institute, that 51% of LGAs did not show any<br />
linkage.<br />
103
• There is a weakness in prioritization criteria for intervention where 41% of LGAs did not<br />
show the prioritization process <strong>and</strong> criteria used to select interventions.<br />
• 35% of DADPs submitted did not show the link with VADPs<br />
FIELD OBSERVATIONS BY THE CONSULTANTS<br />
I) Most of districts visited it was found that all the project plans show activities to be<br />
completed in the particular year i.e. plans do not show long term implementation<br />
programs for the projects <strong>and</strong> phasing.<br />
II) It the districts where the research centers were based there was close interactions with<br />
LGA’s for instance Misungwi District research activities of Ukiriguru centre were<br />
undertaken in the farmers fields with extension staff involvement. Similarly for<br />
Mvemero district with Dakawa irrigation scheme, research plots were based there<br />
with researchers, extension staff <strong>and</strong> farmers interacting freely.<br />
III) Most of the districts visited do not seem to disaggregate agricultural intervention<br />
requirements; they prefer quick wins (e.g. deeps, chaco dams, item purchasing <strong>and</strong><br />
sensitization).<br />
IV) In some districts such as Korogwe, some villages were not informed the outcome VADP’s<br />
as there were not feedback provided.<br />
c) On <strong>per</strong>formance assessment criteria considerations:<br />
• It was observed that 61% of LGAs did not attach community/group project write ups of<br />
investment projects. Due to that important aspects like Economic viability, sustainability,<br />
environmental <strong>and</strong> social management were not sufficiently addressed.<br />
• Some 44% of LGAs failed to plan for Ward Agricultural Resource Centers (WRCs)<br />
• There is improvement in involving private sector participation in provision of agricultural<br />
services. In 2008/09 the involvement of PS was 22% compared to 38% in year 2009/10<br />
• 70% of LGAs scored 2 in analysis of the district agricultural potential, compared to 54% of<br />
previous year.<br />
FIELD OBSERVATIONS BY THE CONSULTANTS<br />
1) None attachment of write ups of community investment projects was also learnt in the field.<br />
But it was thought that this oversight was due to many small projects that are included in the<br />
DADP’s that go to TAMISEMI, otherwise these documents were seen to be in existence in the<br />
LGAs.<br />
2) The field observations did not come across so-called Ward Agricultural Resource Centers<br />
(WRCs)<br />
3) It was observed that in the districts visited such as Korogwe, there was wide private sector<br />
collaboration with LGAs.<br />
4) All the districts visited had acceptable district profile showing among other things the<br />
district agricultural potential.<br />
e) On grant utilization<br />
There was improvement in grant utilization. 46% depicted appropriate use of grant, compared<br />
with 33% in 2007.<br />
104
FIELD OBSERVATIONS BY THE STUDY CONSULTANTS<br />
1) It was observed in district visited most of the funds disbursed had been utilised for the<br />
intended projects except where there were late disbursements<br />
f) On Budget<br />
There was improvement in realistic costing; 48% of LGAs budgets were realistic, compare with<br />
30% of 2008/09.<br />
FIELD OBSERVATION BY THE STUDY CONSULTANTS<br />
From the field visits it was observed that most of the funds disbursed were utilized for the<br />
intended purpose <strong>and</strong> the activities planned were accomplished as had been specified.<br />
g) On Action Plan<br />
It was noted that 56% of LGAs prepared <strong>and</strong> attached an action plan, compared to 21% of<br />
2008/09.<br />
FIELD OBSERVATION BY THE STUDY CONSULTANTS<br />
In most of the districts visited action plans showing activities <strong>and</strong> time schedule were shown.<br />
h) On Monitoring <strong>and</strong> Evaluation (M&E)<br />
It was found that M&E plan was not available for many LGAs<br />
FIELD OBSERVATION BY THE STUDY CONSULTANTS<br />
It was reported in some of the districts that M&E systems were under preparation.<br />
2.8.3 On Challenges <strong>and</strong> Constraints<br />
FIELD OBSERVATION BY THE STUDY CONSULTANTS<br />
i. Disbursement of Funds: Generally, there is late disbursement of funds to LGAs although<br />
the situation has improved since last year. For example, in Rorya District Council funds<br />
for first quarter FY 2009/2010 were received on 11 th of September 2009. Nevertheless, that<br />
is not the only problem as shown below.<br />
ii. Poor fund flow information: In spite of the funds reaching Rorya DC late, the district<br />
agricultural authorities were unaware until the 8 th of October 2009 when the ASR/PER<br />
Team quizzed them to enquire whether they have received DADPs funds or not. It was a<br />
month later.<br />
iii. Procurement procedures: This still poses a great challenge in the smooth implementation<br />
of DADPs.<br />
iv. Inadequate technical services <strong>per</strong>sonnel: Many investment projects fail to be<br />
implemented in time due to inadequate number of district <strong>per</strong>sonnel to su<strong>per</strong>vise them.<br />
105
This in many instances has resulted in poor quality of infrastructure developed or<br />
constructed. For instance irrigation infrastructure; there are hardly qualified irrigation<br />
engineers in districts to su<strong>per</strong>vise irrigation development schemes.<br />
2.8.4 General Recommendations on DADPs<br />
a) General Recommendations<br />
• LGAs must carry out village phasing out before the approval of full council.<br />
• LGAs must attach project write ups for investment interventions which contain<br />
important aspects such as economic viability, sustainability, environmental <strong>and</strong> social<br />
management etc.<br />
• The LGAs are required to follow the recommended DADP structure, including<br />
formatting, organizing <strong>and</strong> overall arrangement. All sections should be covered in the<br />
document.<br />
• The RS should scrutinise the DADP documents before submission to PMO-RALG.<br />
• Planning skills should be enhanced with particular emphasis on identification of<br />
potentials <strong>and</strong> determination of priorities.<br />
• DFTs should be trained more on the project write up.<br />
• The link between LGAs <strong>and</strong> Zonal Agricultural Research Development Institutes should<br />
be strengthened to address research issue in DADPs.<br />
• RS <strong>and</strong> DFT backstopping on DADP planning <strong>and</strong> implementation should strengthened.<br />
• In all DADPs more attention should be given to marketing <strong>and</strong> private sector.<br />
• Cost sharing should be observed according to DADP Guidelines.<br />
• The DADP Guidelines should be reviewed to provide clear guidance about the pro<strong>per</strong><br />
use of ASDP grants.<br />
106
2.9 Assessment of the Effect of the Current Global Economic Meltdown on<br />
Agricultural Performance <strong>and</strong> Likely Outturn in Future<br />
2.9.1 Negative effects of Global Meltdown<br />
The Global Meltdown has been a real havoc to countries, the world over; it has had quite<br />
devastating effects. Some of the implication to global economic growth was, for instance the<br />
USA economy contracted by 6 <strong>per</strong>cent in 2008 <strong>and</strong> that 3.6 million Americans lost jobs. The<br />
growth rate of Sub-Sahara Africa contracted by 5.4 <strong>per</strong>cent (IMF, January,2009 .World Economic<br />
Outlook). The price of oil had fallen by 60 <strong>per</strong>cent in 2009; compared to peak prices in July, 2008.<br />
None-oil commodities prices fell by 29 <strong>per</strong>cent in 2009 compared to 2008. In particular cotton<br />
prices in the world market declined by about 19.38 <strong>per</strong>cent between January,2008 <strong>and</strong> January,<br />
2009. Also coffee prices in the world market were 6.09 <strong>per</strong>cent below the projection for 2009.<br />
World market price index of export commodities<br />
(2005 = 100)<br />
Three months average ending December<br />
8<br />
World Prices of Traditional Export Crops<br />
The export prices on the world market for traditional exports have been quite disheartening. They are on<br />
the down ward trend.<br />
USD/KG<br />
3.5<br />
3<br />
2.5<br />
2<br />
1.5<br />
1<br />
0.5<br />
Prices of Traditional Export<br />
commodities<br />
Chart1: Monthly Commodity Prices<br />
6000.00<br />
5000.00<br />
4000.00<br />
3000.00<br />
2000.00<br />
1000.00<br />
USD/TON<br />
0<br />
Aug Sept Oct Nov Dec<br />
Period<br />
0.00<br />
Robusta Coffee (USD/kg) Arabica Coffee (USD/kg) Tea (Average price) USD/kg)<br />
Tea (Mombasa Auction) (USD/kg) Cotton, "A Index" (USD/kg) Cotton, Memphis" (USD/kg)<br />
Sisal (UG) (USD / metric ton)<br />
Cloves (USD/metric ton)<br />
Tanzania, like several other countries, has been affected much by the Global Meltdown arising<br />
from the world financial crisis that has resulted in serious credit crunch in country’s main<br />
107
trading partners, notably USA, Western Europe <strong>and</strong> Japan. The credit crunch (or credit squeeze)<br />
was a result of banks cutting down on lending due to <strong>per</strong>ceived risk of loss due to likely non–<br />
repayment ability of prospective borrowers, who would in turn be facing uncertain market for<br />
their intended products. Now, due to the credit crunch in these countries, firms have been forced<br />
to cut down on costs; including industrial inputs, which include imports of raw materials (some<br />
of which come from poor countries such as Tanzania); <strong>and</strong> also labour, which in turn reduced<br />
the purchasing power of the forced out workers.<br />
The reduced purchasing power meant cutting down on consumption of commodities, including<br />
products like coffee, tea <strong>and</strong> cashew nut, some of which come from poor countries like Tanzania.<br />
The credit crunch has been so severe that even some firms in the rich countries were forced to<br />
close, rendering thous<strong>and</strong>s of workers unemployed, <strong>and</strong> therefore, with little or no purchasing<br />
power. In addition due to difficulties of accessing adequate capital <strong>and</strong> o<strong>per</strong>ational credit several<br />
major firms are reported to have shelved plans for business expansion both within <strong>and</strong> outside<br />
their own countries; thereby shelving new investments, including those called ‘Foreign Direct<br />
Investment FDI ’in developing countries. Similarly, some prospective new investors have also<br />
shelved their investment plans, including those they had intended in sectors like agriculture in<br />
poor countries.<br />
Thus the above scenario translated into reduced dem<strong>and</strong>, <strong>and</strong> in turn lower prices to the raw<br />
materials (<strong>and</strong> even the limited finished products) that were being exported by the poor<br />
countries to the rich ones. True to economic theory when dem<strong>and</strong> (of raw materials <strong>and</strong> some<br />
finished goods in poor exporting countries) in the rich importing countries falls, while the<br />
production of the said goods in the production is at the same level as previously or has actually<br />
increased (hence keeping supply the same or even increased), prices are bound to fall. This is<br />
what has happened to Tanzania export crops prices, For instance the prices of cotton <strong>and</strong> coffee<br />
fell to about half towards the beginning of 2009 (after going up in 2008 see Figure G1, below -<br />
also provided above in section on marketing).<br />
This was attributed pressure from economic slowdown as a result of dem<strong>and</strong> decline on the<br />
export market. It is thought prices of some of the key export crops may even fall further as<br />
consumer dem<strong>and</strong> in advanced countries continue to fall; a <strong>per</strong>ception that has sent some major<br />
cotton dealers in the world to cancel orders from Tanzania. In fact up to January, 2009 some<br />
138,011 bales of the 2008 cotton crop (almost one quarter of the year’s output) were still piled up<br />
in ginneries due to lack of orders. During the consultant’s visit in Mwanza Region, in<br />
October,2009 , over 30,000 bales were found lying in godowns in Mwanza, Misungwi, Kwimba<br />
<strong>and</strong> Magu districts for lack of orders. To make matters worse quality of the cotton bales lying at<br />
the ginneries was reported at being at risk of deteriorating in quality.<br />
Vegetables <strong>and</strong> flowers, as we have seen under the marketing section above, are other export<br />
crops that have been seriously affected by the Global Economic Meltdown, since late 2008. From<br />
October 2008, vegetable <strong>and</strong> flower prices on average have declined by 30 to 50% as compared<br />
to same <strong>per</strong>iod in 2007. Some flower types <strong>and</strong> lengths lost market all together, from October<br />
2008. [Source: Internet- Tanzania: Global Crisis Hits Flower Industry. Africa News. 30/11/2009]<br />
108
Table G1: Global Meltdown Effect on the Performance of <strong>Agriculture</strong> sector<br />
Indeed during this year’s (2009/10) buying season some cotton traders in Western Cotton<br />
Growing Areas (WCGA) were hardly buying any seed cotton from farmers as they were failing<br />
to secure loans from banks due to their failure to repay previous bank loans. The traders<br />
intimated that they made a loss in the previous year as a direct consequence of the global<br />
financial crisis. Actually in June, 2009the Government had to intervene by providing a financial<br />
stimulus package (in form of price subsidy) of about Tshs 23 billion to off-set un -paid cotton<br />
bank loans associated with the global financial crisis. Furthermore, cotton prices to be paid to<br />
farmers for the 2009/10 were uncertain as a result of the global financial crisis.<br />
Initially traders had announced the price to be paid to cotton farmers for the 2009/10 season was<br />
to be Tshs360/- <strong>per</strong> kilogram which was much lower than the previous season of Tshs455/- <strong>per</strong><br />
kilogram. Again the government in the 2009/10 budget had to make a provision on price<br />
subsidy to farmers of Thshs.80/- <strong>per</strong> kg of seed cotton.<br />
It is not just export crops farmers that have seen their fortunes being kicked away by the<br />
Global Meltdown. The livestock sector too is having similar trouble.<br />
Indeed the Livestock sub-sector provides a vivid example on the effects of this Global<br />
Meltdown: Thus:<br />
• Domestic prices for salted skins plummeted badly in 2008/09, from USD 1.30 <strong>per</strong> kg in<br />
2007/08 to US$ 0.30 in 2008/09 - a drop of over 330%!. Prices of salted export skins (for<br />
instance to South Africa) fell from US $ 1.75 <strong>per</strong> kg in January 2008, down to US$ 0.50 ( a<br />
fall of some 250% !). [See Table H1, below].<br />
• There are signs that hides quality may now being compromised due to the depressing<br />
prices on the world market - some producers see their effort in maintaining hides<br />
quality not being rewarded.<br />
• New investments are not coming into the subsector; even some of those already in are<br />
pulling out; for example an American investor for a Shinyanga Meat Processing Plant has<br />
pulled out; sending hopes of incomes by prospective employees flying out too.<br />
109
• Domestically consumption of livestock products, which is already low is likely going<br />
down further due to rise in the commodities prices, in turn forced up by, among other<br />
things, rise in prices of inputs, which are all almost all imported, save for forage <strong>and</strong><br />
some feeds. [Current consumption of livestock products <strong>per</strong> year is currently estimated at<br />
Country<br />
Table H1: :Price of Skin (welt salted) (USD/Kg)<br />
Price<br />
Price(USD/KG)<br />
(USD/KG)<br />
Jan 2008<br />
Jan 2009<br />
South Africa 1.75 0.55 0.50<br />
Tanzania 1.30 0.45 0.30<br />
Source: [MLFD Annual Report 2008/9]<br />
Price (USD/KG)<br />
Mach 2009<br />
Still there are other factors that are likely to affect the agriculture sector negatively. These<br />
include:<br />
Rising prices of agricultural inputs: The rocketing fossil oil prices of the latter half of the 2000<br />
decade, pushed up prices of farm inputs (fertilizers, seed, <strong>and</strong> agro chemicals) <strong>and</strong> farm<br />
machineries/ equipment to virtually out of reach of poor countries, <strong>and</strong> in turn of their poor<br />
farmers. In fact on the local market input prices more than doubled in the <strong>per</strong>iod, forcing the<br />
government to pay more than double for input subsidy <strong>per</strong> unit compared to 5 years ago.<br />
Continued down sliding (depreciating) value of the Tanzania shilling<br />
The continued down sliding of the value of the Tanzania shilling against hard currencies, though<br />
it may have positive effect of pushing up exports as would make them chea<strong>per</strong> for buyers, it has<br />
also the effect of raising prices of farm inputs <strong>and</strong> equipment (as already stated) <strong>and</strong> also prices<br />
of related services, particularly transportation costs.<br />
Curtailment in Foreign Direct Investments: There is now some roll back in foreign direct<br />
investment (FDI), as already indicated for the prospective meat processing investor in for<br />
Shinyanga. There could be more in the offing.<br />
Curtailment in <strong>Of</strong>ficial Development Assistance (ODA): There is likelihood ODA flows are<br />
under pressure notwithst<strong>and</strong>ing the commitments as donor countries spend huge sums of<br />
money to bail out their economies hit by the Global Financial Crisis.<br />
Speculative activities on the financial market<br />
The interbank foreign exchange market was affected by the global financial crisis.<br />
Over the past few years the Tanzania Shilling depreciated by about 15 <strong>per</strong>cent; a depreciation<br />
thought by (some quarters), to be largely a result of the turmoil in the global financial market<br />
associated with the local business community who believed that the supply of foreign exchange<br />
might dry up, thus triggering a buying frenzy for hording <strong>and</strong> speculating for profit making.<br />
110
2.9. 2 Positive effects of the Global Meltdown<br />
While there are several effects of the Global Meltdown on the Agricultural Sector, there are, what<br />
may appear, positive ones. We have already seen that down sliding of the value of Tanzania<br />
shilling may push up exports, as the country’s exportable goods would be chea<strong>per</strong> to foreign<br />
buyers, <strong>and</strong> would thus be attracted to buy from the country.<br />
The other positive benefit would be to food producers. The very high prices for fossil oil<br />
ex<strong>per</strong>ienced recently on the world market have sent global <strong>and</strong> local food prices soaring. For<br />
farmers producing surplus <strong>and</strong> able to export (if no bans imposed) it is a very welcome thing.<br />
However, for urban dwellers this could present serious food insecurity; a problem for them <strong>and</strong> the<br />
Government, which has had a system in place to ensure food security.<br />
Nevertheless, if the farmers respond very positively to rising prices, there could be large<br />
surpluses of food produced, <strong>and</strong> therefore have the effect of lowering domestic food prices for<br />
exportable food commodities (largely rice, maize, beans, cassava, some fruits <strong>and</strong> vegetables).<br />
Actually the soaring global food prices are already attracting foreign food production investors<br />
to come <strong>and</strong> undertake large/ commercial food farming in the country. There is for instance the<br />
rice production investor who has entered into investment partnership with Rubada; another one<br />
expected to do the same with RUBADA for production in the Rufiji Basin.<br />
Furthermore, Tanzania can still sell well on the global market for its quality products like the<br />
premium quality coffee of KILI_CAFE’s associations; <strong>and</strong> also quality cashew nuts, as such<br />
products are still on very much dem<strong>and</strong> on the export market..<br />
On balance, however, the Global Meltdown has hit the Agricultural Sector hard <strong>per</strong>haps there is<br />
more to come. It is a big challenge in the efforts to fight income poverty. Low prices to farmers/<br />
local exporters, means less income <strong>and</strong> therefore decreased chance of reducing income poverty<br />
to over half of the country’s population who sustain their livelihoods through small scale<br />
farming <strong>and</strong> livestock keeping. What is required is to move quickly to making farming more<br />
attractive <strong>and</strong> more technology oriented, right from l<strong>and</strong> conservation, l<strong>and</strong> preparation, inputs<br />
use, h<strong>and</strong>ling, storage, processing, marketing - right to exporting; aiming at premium quality in<br />
both products <strong>and</strong> related services. Livestock production, processing <strong>and</strong> marketing must be<br />
modernised in its entirety. Measures for addressing this rather gloomy situation in the medium<br />
term are given below.<br />
2.9.3 Outturn (recovery process)<br />
The recovery process of the global financial crisis to a large extent will depend on the recovery in<br />
leading economies through stimulus spending <strong>and</strong> recovery in the credit markets. These will<br />
enhance the recovery of dem<strong>and</strong> <strong>and</strong> growth in those countries.<br />
In Tanzania what is most crucial is to undertake the following:<br />
Speed up irrigation development <strong>and</strong> the delivery of farm machinery through lease<br />
finance, agricultural development <strong>and</strong> microfinance banks; these should be more<br />
vigorously pursued.<br />
111
Government to speed up investment in infrastructure development (marketing <strong>and</strong><br />
physical communication services - railways, roads, marine, air-freighting; these hold the<br />
key for exploiting the country’s growth drivers<br />
Government should identify new alternative sources of infrastructure financing <strong>and</strong><br />
provide a leverage for private sector participation.<br />
Minimize interruptions in the growth process during the 2009/10<br />
Find ways of cushioning potential of employment loss <strong>and</strong> food cost - find ways of<br />
helping to bring down inflation.<br />
Boost food production; this is a key point - food inflation in January,2009 was 18.2<br />
<strong>per</strong>cent.<br />
Beef up strategic grain reserves for smooth supplies <strong>and</strong> prices.<br />
Government needs to ensure continuing investments by reducing the cost of investments<br />
<strong>and</strong> doing business, in Tanzania - procuring l<strong>and</strong> for large scale investment (in<br />
partnership with local, if foreigner) be speedy <strong>and</strong> clear-cut, with title deeds being<br />
readied within a few days; inputs <strong>and</strong> capital equipment clearance from ports should be<br />
fast; likewise shipping off-loading <strong>and</strong> outward of ports.<br />
Eliminate red tapes <strong>and</strong> bureaucracy in investment promotion/ attraction<br />
Bring down cost of utilities e.g. water, electricity,<br />
Bring down cost of credit.<br />
Bring down cost of communication.<br />
The agriculture sector should work with banks <strong>and</strong> other sectoral organizations to<br />
identify main areas of distress such as cotton, sisal, horticulture, textiles, <strong>and</strong> beef<br />
livestock farming, <strong>and</strong> so on.<br />
The agriculture sector should enhance credit via blending finance <strong>and</strong> guarantee<br />
schemes<br />
The agriculture sector should exp<strong>and</strong> out-growers schemes which integrate smallholders<br />
<strong>and</strong> commercial farmers with agro processing for an effective way of delivering credit,<br />
inputs, mechanization <strong>and</strong> value addition to the smallholder farmer.<br />
The agriculture sector should work vigorously to ensure maximum value addition of<br />
key marketed products, along the entire value chain of the products commodities - look<br />
vigorously <strong>and</strong> retain worthy markets; ensure pro<strong>per</strong> commodity storage; enhance agroprocessing;<br />
have in place quality assurance system all the way.<br />
112
2.10 Assessment of Relevance of the ASDP M&E Framework <strong>and</strong> Shortlisted<br />
Indicators for Assessing the Performance of the Programme<br />
In addressing Relevance of ASDP M&E Framework <strong>and</strong> shortlisted indicators for assessing the<br />
<strong>per</strong>formance of the ASDP programme , one is bound to be guided by the ‘MKUKUTA<br />
Monitoring Master Plan - MKUKUTA Indicator List’ as first <strong>and</strong> foremost, <strong>and</strong> subsequently<br />
the ‘ASDP M&E Framework <strong>and</strong> Shortlisted Indicators’.<br />
The shortlisted indicators for monitoring ASDP implementation are as presented under Table S1,<br />
below. As indeed indicated in this table, Impact Indicator 1 <strong>and</strong> 2 are (as shown in the table)<br />
MKUKUTA indicators <strong>and</strong> are in MKUKUTA Cluster 1: Growth <strong>and</strong> Reduction of Income<br />
Poverty (cluster-wide indicators). Outcome indicator 3, seems to be feeding into MKUKUTA<br />
Cluster 1 (cluster-wide indicators - GDP growth of sectors <strong>per</strong> annum). In a way this is<br />
therefore a partial measure of sector’s contribution to GDP; it measures foreign exchange<br />
earnings contribution by the sector. It is also a quick yardstick for partial sector <strong>per</strong>formance as<br />
its data is readily available, <strong>and</strong> is from fairly reliable source, <strong>and</strong> is continually compiled by<br />
both TRA <strong>and</strong> BOT.<br />
This study has also used this yardstick to measure sector <strong>per</strong>formance of past three years; as<br />
done under section 3.1 above. But it would have been better if there was also continuous, reliable<br />
data on sector produce production <strong>and</strong> on domestic trading. If production data could be<br />
recorded (on sight), <strong>and</strong> accurately at village level, one could have a stronger indicator at both<br />
LGA level <strong>and</strong> national level. But at the moment it is very hard to have in place continuous,<br />
accurate production data at LGAs level (from village upwards) due to lack of capacity. Yet it is<br />
very important to have such data, particularly also when one wants to assess value for money<br />
for production resources deployed to LGAs.<br />
Outcome indicator 1, <strong>and</strong> 7 are also, as indicated, MKUKUTA indicator. <strong>Food</strong> self sufficiency<br />
measurement is a very important measure for ASDP <strong>per</strong>formance, <strong>and</strong> data for this (though<br />
largely estimates) have been continually collected by NFSD of MAFC , through the LGA’s<br />
relevant units - again there appears to be problem of data accuracy at LGA level due to<br />
inadequate capacity. Nevertheless, it is essential this yardstick is continually in place, despite<br />
any shortcoming due to its national importance, <strong>and</strong> therefore important indicator for ASDP<br />
<strong>per</strong>formance. This study also used this type of indicator to gauge <strong>per</strong>formance of the sector.<br />
Outcome indicator 7 is also one that data can be easily obtained <strong>and</strong> would measure ASDP<br />
ability in enhancing partnership (between private sector investors <strong>and</strong> small scale farmer), a<br />
move towards reduction of income poverty <strong>and</strong> enhanced food security for the small scale<br />
farmers; <strong>and</strong> even for urban dwellers; who would access more food directly (if it is food<br />
produced in particular production) or indirectly through provision of services such as inputs,<br />
transport <strong>and</strong> marketing; thereby contributing to broad- based development as <strong>per</strong> MKUKUTA<br />
requirement.<br />
113
Table S1: The short-listed impact, outcome <strong>and</strong> output indicators for the ASDP<br />
Indicators<br />
Frequency<br />
Disaggregation<br />
Data source<br />
Impact<br />
Outcome<br />
Output<br />
1. Real GDP growth rate <strong>per</strong> annum<br />
[MKUKUTA]<br />
2. Headcount ratio in rural areas – basic needs<br />
poverty line [MKUKUTA]<br />
District Region National<br />
Annual √ NBS<br />
Periodical √ √ NBS (HBS)<br />
3. Value of agricultural exports Annual √ TRA<br />
1. <strong>Food</strong> self-sufficiency ratio [MKUKUTA] Annual √ √ MAFC<br />
2. Average consumption expenditure levels in<br />
rural areas<br />
3. Proportion of smallholder households using<br />
improved technologies<br />
4. Flow of private funds into agricultural <strong>and</strong><br />
livestock sectors<br />
5. Proportion of smallholder households using<br />
mechanization<br />
6. Ratio of processed exported agricultural<br />
products to total exported agricultural<br />
products<br />
7. Proportion of smallholder households<br />
participating in contracting production <strong>and</strong><br />
out-growers schemes [MKUKUTA]<br />
8. Proportion of LGAs that qualify to receive<br />
top-up grants<br />
9. Proportion of LGAs that qualify to receive<br />
<strong>per</strong>formance bonus<br />
1. Number of agricultural production<br />
infrastructure<br />
2. Number of agricultural marketing<br />
infrastructure <strong>and</strong> machinery<br />
3. Number of extension officers trained on<br />
improved technologies<br />
4. Rural micro finance institutions serving<br />
farmers<br />
5. Number of agricultural marketing<br />
regulations <strong>and</strong> legislation in place<br />
6. Number of markets where wholesale or retail<br />
prices are collected<br />
7. Number of Inter-Ministerial Coordination<br />
Committee (ICC) meetings held<br />
8. Proportion of quarterly progress reports<br />
submitted on time<br />
9. Proportion of female members of Planning<br />
<strong>and</strong> Finance Committee<br />
Periodical √ √ NBS (HBS)<br />
Periodical √ √ √ NBS (NSCA)<br />
Annual √ √ TIC<br />
Periodical √ √ √ NBS (NSCA)<br />
Annual √ TRA<br />
Annual √ √ √ LGAs<br />
Annual √ PMO-RALG<br />
Annual √ PMO-RALG<br />
Annual √ √ √ LGAs<br />
Annual √ √ √ LGAs<br />
Annual √ √ √ LGAs<br />
Annual √ √ √ LGAs<br />
Annual √ MITM (MAFC,<br />
MLD)<br />
Annual √ MITM<br />
Annual √ ASDP<br />
Secretariat<br />
Annual √ √ √ Regions,<br />
ASLMs<br />
Annual √ √ √ LGAs<br />
114
Note: Indicators with [MKUKUTA] are from the Poverty Monitoring Master Plan<br />
Table S2: Current shortlisted indicators (for ASDP <strong>per</strong>formance assessment) <strong>and</strong> improvement required<br />
Current Indicators Improvement required on<br />
indicator<br />
Impact<br />
Outcome<br />
Output<br />
1. Real GDP growth rate <strong>per</strong> annum [MKUKUTA] nil<br />
2. Headcount ratio in rural areas – basic needs poverty line<br />
Nil<br />
[MKUKUTA]<br />
3. Value of agricultural exports Nil<br />
1. <strong>Food</strong> self-sufficiency ratio [MKUKUTA] Nil<br />
2. Average consumption expenditure levels in rural areas Also add another (average investment<br />
expenditure)<br />
3. Proportion of smallholder households using improved Improved technologies should be<br />
technologies<br />
specified <strong>and</strong> possibly graded<br />
4. Flow of private funds into agricultural <strong>and</strong> livestock sectors i) Good to specify entry point of<br />
investment (production, processing,<br />
marketing<br />
(ii) Good to specify into categories of<br />
large investment projects <strong>and</strong> medium to<br />
low investment volumes<br />
5. Proportion of smallholder households using mechanization Need to categorise level of mechanisation<br />
use : small implements (power tillers <strong>and</strong><br />
ox-plough use; as against use of tractors;<br />
<strong>and</strong> also in what activities each of these<br />
are used<br />
6. Ratio of processed exported agricultural products to total Also specify <strong>per</strong> crop/ livestock type<br />
exported agricultural products<br />
7. Proportion of smallholder households participating in<br />
nil<br />
contracting production <strong>and</strong> out-growers schemes [MKUKUTA]<br />
8. Proportion of LGAs that qualify to receive top-up grants<br />
9. Proportion of LGAs that qualify to receive <strong>per</strong>formance bonus Also monitor rate of disbursement <strong>and</strong><br />
expenditure<br />
1. Number of agricultural production infrastructure Also categorise infrastructure into types,<br />
quantity <strong>and</strong> value<br />
2. Number of agricultural marketing infrastructure <strong>and</strong> Also categorise infrastructure into types,<br />
machinery<br />
quantity <strong>and</strong> value<br />
3. Number of extension officers trained on improved Also categorise into technology types<br />
technologies<br />
received<br />
4. Rural micro finance institutions serving farmers Also categorise into MFI <strong>and</strong> banks<br />
5. Number of agricultural marketing regulations <strong>and</strong> legislation Performance best assessed on<br />
in place<br />
agricultural problems solved<br />
6. Number of markets where wholesale or retail prices are nil<br />
collected<br />
7. Number of Inter-Ministerial Coordination Committee (ICC) Should be categorised into scheduled <strong>and</strong><br />
meetings held<br />
non-scheduled meetings<br />
8. Proportion of quarterly progress reports submitted on time Also categorise into complete <strong>and</strong><br />
incomplete reports<br />
9. Proportion of female members of Planning <strong>and</strong> Finance Target should be towards gender balance<br />
Committee<br />
115
Furthermore, the shortlisted indicators are a bit silent on:<br />
• Market search <strong>and</strong> retention; both international <strong>and</strong> domestic; market collection points/<br />
centres<br />
• Small to medium scale training <strong>and</strong> marketing <strong>per</strong>formance in agricultural commodities<br />
• More Irrigation <strong>per</strong>formance coverage - number of irrigation schemes; number of<br />
farmers participating in irrigation; average irrigated area <strong>per</strong> farmer; number of<br />
beneficiaries<br />
• Quality assurance for– products marketed; market collection points; inputs & equipment<br />
supply; infrastructural facilities accomplished (including rural roads <strong>and</strong> market centres)<br />
• DADPs plans <strong>and</strong> implementation rate<br />
Finally, the indicators will necessarily have to be stated in the appropriate, complete format as<br />
originally stated in the ASDP Document. Indicators must be SMART: i.e. specific (clearly <strong>and</strong><br />
directly related to objective or output being measured), measurable (data definition is<br />
unambiguous <strong>and</strong> collection feasible) attributable (indicator should measure changes that are<br />
direct consequences of the project/ programme intervention), relevant (indicator should add<br />
value in measuring project/ programme outcome or progress), <strong>and</strong> timely (indicator to be such<br />
that it is possible to collect <strong>and</strong> analyse data fairly quickly to ensure relevance of information).<br />
Thus indicators must provide good monitoring basis, remembering that in monitoring we are<br />
asking ourselves ‘Are we doing the things right?’; <strong>and</strong> when we come to undertake evaluation we will<br />
be asking ourselves ‘Are we doing/ have we done the right things?’<br />
116
2.11 Assessment of Relevance of Wealth Creation Indicators to be Used to Measure<br />
Rural Poverty Reduction in other Reports Undertaken by Other Consultants<br />
In MKUKUTA the wealth creation indicators to be used to measure rural poverty reduction are<br />
also essentially those for measuring wealth creation. An attempt has been made here to look into<br />
their relevance in terms of assessing wealth creation; this is summarised under Table R1, below:<br />
Table R1: MKUKUTA indicators for wealth creation (excluding for GDP <strong>and</strong> Sectors Growth)<br />
Cluster Goal in the cluster Indicator Comments on appropriateness of<br />
the indicator<br />
Cluster 1: Growth<br />
<strong>and</strong> Reduction of<br />
Cluster- wide indicators • Head count - basic needs poverty line<br />
(%); target for year 2010 being 24% for<br />
This indicator does not take into account:<br />
- Quality of basic needs (housing type,<br />
Income Poverty<br />
Rural <strong>and</strong> 12% for urban - down from type of food, type of clothing, heath care<br />
36% in 2001<br />
Y child education)<br />
Goal 2: Promoting • % of rural population who live within 2 This is a good indicator as it serves to<br />
Sustainable <strong>and</strong> Broad –<br />
Based Growth<br />
kms of all season passable road (or are<br />
within 30 minutes walk of such road).<br />
This reported to be 86.4% in 2006<br />
address a very serious source of rural<br />
poverty; that is market access<br />
Goal 3: Improved <strong>Food</strong><br />
Availability<br />
<strong>and</strong><br />
Accessibility at Household<br />
level in Urban <strong>and</strong> Rural<br />
Areas<br />
Goal 4 & 5: Reducing<br />
Income Poverty of Both<br />
Men <strong>and</strong> women in Rural<br />
<strong>and</strong> Urban Areas<br />
• <strong>Food</strong> self-sufficiency ratio (%); targeted<br />
to be 119% by 2010 (up from estimated<br />
94% in 2000/01)<br />
• Number of districts reported to have<br />
food shortages; estimated to be 15 in<br />
2000/01; but then rose to 50 districts in<br />
2006/07) - no target set for 2010, (<strong>per</strong>haps<br />
assumed to be nil)<br />
• % change in production by small<br />
holder households of key staple crop<br />
(maize, rice <strong>and</strong> sorghum, in million<br />
tons; targeted to be 12 million tons in<br />
20010 (up from estimated 2 million tons in<br />
2000/01; <strong>and</strong> 3.5 million tonnes in 2004/05<br />
• Proportion of households who<br />
consume no more than one meal a day<br />
(%); estimated at national average of 1.1% ,<br />
but 1.2% in Rural in 2000/01; <strong>and</strong> was 1.9<br />
<strong>and</strong> 2.2, respectively in 2005)<br />
• % of small holders participating in<br />
contracting production <strong>and</strong> outgrowers<br />
scheme; targeted to reach 1.3 %<br />
in 2010 (up from 0.9% in 2003)<br />
• Total smallholder area under irrigation<br />
as % of total cultivable l<strong>and</strong>; targeted at<br />
13% in 2010 (up from estimated 2.7% in<br />
2002/03) in 200<br />
• % of small holders who accessed<br />
formal credit for agricultural purposes;<br />
targeted to reach 10% in 2010 (up from<br />
estimated 0.32 % in 2002/03)<br />
This indicator needs to take into account:<br />
need for balanced diet (in terms of<br />
calorific level, protein, fat, vitamins <strong>and</strong><br />
minerals)<br />
Here care must be taken to ensure reports<br />
of shortage come from reliable source,<br />
including village/ ward community<br />
groups/ leadership<br />
This is sound indicator<br />
Need to elaborate on meal quality<br />
This is sound indicator as, such<br />
partnerships, apart from employment <strong>and</strong><br />
income creation, also may result in<br />
technology transfer<br />
This is sound indicator; but one could<br />
improve on this by also looking into<br />
number of irrigation schemes; <strong>and</strong><br />
number of farmers participating in the<br />
production at the schemes.<br />
This is sound indicator<br />
117
Table R1: MKUKUTA indicators for wealth creation (excluding for GDP <strong>and</strong> Sectors Growth) - (continued)<br />
Cluster Goal in the cluster Indicator Comments on appropriateness of<br />
the indicator<br />
Goal 4 & 5: Goal 4 & 5: Reducing • % of smallholders (rural) households Need to categorize the type of income<br />
Reducing Income Income Poverty of Both<br />
with one or more income generating generating activity <strong>and</strong> levels of<br />
Poverty of Both Men <strong>and</strong> women in Rural<br />
activities; no targeted set for 2010, but o<strong>per</strong>ation (very low, small or<br />
Men <strong>and</strong> women <strong>and</strong> Urban Areas<br />
was 72% in 2002/03; <strong>and</strong> 81.9% 2006. medium)<br />
in Rural <strong>and</strong> (continued)<br />
Urban Areas<br />
(continued)<br />
Goal 6: Provision of<br />
Reliable <strong>and</strong> Affordable<br />
Energy to Customers<br />
• % of households with access to<br />
electricity; no target set but was estimated<br />
at 10% in 2003; <strong>and</strong> was 11.1% in 2004)<br />
• % increase in number of customers<br />
connected to national grid <strong>and</strong> offgrid;<br />
no target set for 2010, but was 2.99<br />
in 2001, <strong>and</strong> reached 1.17% <strong>and</strong> 6.69 %, in<br />
2005 <strong>and</strong> 2006, respectively<br />
• % of households in both rural <strong>and</strong><br />
urban households using alternative<br />
sources of energy to wood fuel<br />
(including charcoal) as their main<br />
sources of energy; targeted at national<br />
average of 10% in 2010 (from national<br />
average of 7.8%; with Rural 2.7% <strong>and</strong><br />
urban 12.9% in 2003)<br />
• Actual electricity generated as % of<br />
capacity; no target set for 2010 (but was<br />
40% in 2002 <strong>and</strong> went down to 26% in<br />
2006)<br />
This is a very sound indicator; as<br />
electricity enriches life in several ways<br />
(lighting, allowing studying for children,<br />
allows one to have good listening of<br />
important radio programmes; may also<br />
provide energy pumping water, <strong>and</strong> for<br />
small scale agro-processing, other small<br />
scale industries, etc). It reduces<br />
undesirable rural-urban migration -<br />
makes rural life attractive.<br />
Again this is sound indicator for the same<br />
reason of making life attractive <strong>and</strong><br />
providing other opportunities, not just for<br />
rural, but urban too, in terms of engaging<br />
in cottage industries, <strong>and</strong> so on.<br />
This is a very sound indicator; as it<br />
addresses the need to care for the wealth<br />
creating basic resource (l<strong>and</strong> <strong>and</strong> water<br />
catchments); <strong>and</strong> also contributes to<br />
fighting adverse climate change<br />
This is also a very sound indicator, for<br />
the same reason of making life attractive<br />
<strong>and</strong> providing for adequate energy to both<br />
small <strong>and</strong> major industries; both of which<br />
are source of employment <strong>and</strong> therefore<br />
income.<br />
In addition to the brief assessment <strong>and</strong> suggestions made on the MKUKUTA indicators, there is<br />
also possibility that some wealth creation sources may not be netted by the MKUKUTA<br />
indicators, particularly so in the livestock sub-sector <strong>and</strong> the informal sector. Thus in livestock<br />
keeping areas new stock are born almost daily, but then there seems to be under reporting even<br />
during census. Therefore base income for defining poverty may not really bring in such<br />
producers, who may actually have very little cash money (much lower than defined by REPOA<br />
<strong>and</strong> others) but have all the food they need (milk <strong>and</strong> meat) at h<strong>and</strong>; <strong>and</strong> may even barter to get<br />
other things. The same goes for subsistence crop farmers, particularly in the case of non-cereal<br />
crops, which are not even touched by MKUKUTA indicators; data are hard to get here either.<br />
There is also the vending, hawking, cottage processing <strong>and</strong> skills trades (mechanics, <strong>and</strong> so on),<br />
as well as other informal trade businesses. All these are very difficult to track <strong>and</strong> judge how<br />
much wealth has been created. No wonder the informal sector is very resilient, including<br />
cushioning sudden price changes, <strong>and</strong> even some level of food shortage.<br />
118
Therefore what one could conclude here is that the wealth creation indicators as <strong>per</strong> MKUKUTA,<br />
<strong>and</strong> also as others, including REPOA (who define poverty incidence as % of people living<br />
below the basic needs line), are relevant, only that they are unable to monitor all wealth creation<br />
sources particularly under crop subsistence farming, free livestock grazing (or nomadic)<br />
farming, enterprises <strong>and</strong> informal sector business as a whole. More indicators are needed in<br />
order to capture these businesses.<br />
119
2.12 Status of implementation of recommendations made in the 2008/09 ASR/PER<br />
The status of implementation of recommendations is summarized in table T1 below.<br />
Table T1.: Summary of emerging issues, recommendations in ASR 2008/09<br />
Issues Recommendations Action taken<br />
The global climate<br />
change negatively<br />
impacting the agriculture<br />
sector<br />
Integrated agriculture<br />
sector database<br />
Government to continue to<br />
conduct area specific studies for<br />
identification of problems <strong>and</strong><br />
implementation of appropriate<br />
interventions that will lead to<br />
sustainable agriculture <strong>and</strong> food<br />
security.<br />
ASLMs should make efforts in<br />
completion of setting up an<br />
integrated agriculture database,<br />
where all data <strong>and</strong> information<br />
on the sector can be obtained<br />
from one location.<br />
ASDP M&E framework MITM <strong>and</strong> MWID should<br />
complete development of their<br />
M&E systems in conformity<br />
with the ASDP M&E framework<br />
to ensure adequate information<br />
<strong>and</strong> data is available for<br />
planning <strong>and</strong> monitoring of the<br />
programme <strong>and</strong> sector<br />
<strong>per</strong>formance.<br />
Simplified sector ASLMs should undertake a<br />
reporting system<br />
detailed study <strong>and</strong> agree on a<br />
simplified agriculture sector<br />
reporting system at LGAs.<br />
<strong>Agriculture</strong> Crops Policy<br />
The <strong>Agriculture</strong> Crops Policy<br />
should be completed timely <strong>and</strong><br />
be disseminated widely.<br />
The <strong>Ministry</strong> of <strong>Agriculture</strong> food<br />
security <strong>and</strong> coo<strong>per</strong>atives in<br />
collaboration with Vice Presidents<br />
<strong>Of</strong>fice Division of Environment<br />
conducted a study in 2008/2009 on<br />
impact of climate change on crops.<br />
Also, in 2009/2010 through the Joint<br />
Implementation Programme on<br />
Environment, MAFC in collaboration<br />
with VPO, MNRT, MLDF <strong>and</strong> FAO is<br />
going to conduct a study on impact of<br />
climate change on agriculture as a<br />
whole.<br />
The ASLMS are currently trying to<br />
establish individual sector ministry<br />
databases. Once this over, it could be a<br />
good starting point for developing the<br />
integrated agriculture database.<br />
The MLDF has already developed her<br />
M&E system in conformity to the<br />
ASDP M&E framework. MITM is<br />
currently engaging a consultant to<br />
develop the system while MWI has<br />
not yet started developing the said<br />
M&E system.<br />
The ASLMs have finalized the<br />
preparation of the LGMD2 system that<br />
will highly simplify the agriculture<br />
sector reporting system at LGAs. The<br />
LGMD2 covers from national, regional<br />
<strong>and</strong> district levels. Training on<br />
application of the system will begin in<br />
November, 2009 for a few selected<br />
pilot LGAs but it will be fully applied<br />
in Dodoma <strong>and</strong> Morogoro Regions of<br />
March, 2010.<br />
The <strong>Agriculture</strong> Crops Policy is ready<br />
<strong>and</strong> currently awaiting approval by<br />
the cabinet so that it can be printed<br />
<strong>and</strong> distributed widely to the public.<br />
120
Table T1: Summary of emerging issues, recommendations in ASR 2008/09 -(continued)<br />
Issues Recommendations Action taken<br />
Agricultural credit<br />
The Government should as a<br />
matter of national priority<br />
establish the Tanzania<br />
Agricultural Development Bank<br />
to spearhead credit facilities for<br />
investment in agriculture.<br />
<strong>Agriculture</strong> taxes The Government should<br />
consider removing VAT on<br />
agricultural equipments <strong>and</strong><br />
tools related to tractors such as<br />
trailers <strong>and</strong> spare parts.<br />
Furthermore, produce cess from<br />
agriculture should also be<br />
reduced from 5% to 0.3% similar<br />
to the industrial sector.<br />
<strong>Agriculture</strong> sector census ASLMs should setup a<br />
coordination team to ensure that<br />
the <strong>Agriculture</strong> sector census<br />
planned during FY 2008/09 is<br />
carried out effectively <strong>and</strong><br />
efficiently to meet information<br />
need for planning in the sector.<br />
The Government in collaboration with<br />
the Bank of Tanzania has already<br />
issued a tender on consultancy<br />
services for conducting feasibility<br />
study for the establishment of the<br />
Tanzania Agricultural Development<br />
Bank (TADB). The deadline for<br />
application is 3 rd November, 2009.<br />
A proposal was submitted to the<br />
National Task Force on Tax Reform in<br />
February, 2009. However, after a<br />
number of deliberation meetings, it<br />
was rejected on grounds that the<br />
decision to remove the tax might be<br />
abused because it is very difficult to<br />
isolate spare parts specific for<br />
agricultural machinery from other<br />
machinery.<br />
The agriculture sector census is<br />
progressing well under the overall<br />
coordination from NBS <strong>and</strong> at the<br />
moment it is in the data processing<br />
stage. Final output is expected to be<br />
out by next year.<br />
121
PART II<br />
3 PUBLIC EXPENDITURE REVIEW2009/10<br />
3.0: Public sector planning, resource allocation, expenditure <strong>and</strong> financial<br />
management in the agriculture sector<br />
3.1. Public Sector Planning, Resource Allocation <strong>and</strong> Expenditure<br />
• The public sector planning process is guided each year by issuance of the guidelines for<br />
the preparation of medium term plan <strong>and</strong> budget framework. The guidelines are<br />
developed through a consultative process between central ministries <strong>and</strong> sector<br />
ministries whereby national <strong>and</strong> sectoral priorities for resource allocation are derived.<br />
• The sector ministries are supposed to decide on the priority expenditure areas through<br />
sector working groups under MKUKUTA clusters 1 to 3. This is because the resource<br />
allocation for other charges <strong>and</strong> development budget are based on MKUKUTA clusters.<br />
In FY 2008/2009 MKUKUTA cluster allocations were 48.3%, 34.1% <strong>and</strong> 17.6% for<br />
cluster 1, cluster 2 <strong>and</strong> cluster 3 respectively.<br />
• However, deciding on the priority expenditure areas through sector working groups<br />
under MKUKUTA clusters has been a challenge <strong>and</strong> the agriculture sector working<br />
group has hardly been functioning. Nevertheless, the effects of this shortcoming have<br />
always been cushioned by the implementation of ASDP through the ASDP institutional<br />
arrangement.<br />
• This latter is comprised of the ASDP Basket Fund Steering Committee, Inter-Ministerial<br />
Coordination Committee, Committee of ASLMs Directors <strong>and</strong> the <strong>Agriculture</strong> Sector<br />
Consultative Group meetings between DPs, the Government, private sector <strong>and</strong> other<br />
stakeholders.<br />
• Therefore, allocation of resources to sector priorities is mainly effectively done for the<br />
development budget rather than for recurrent budget. Nevertheless, resources are<br />
allocated according to priority areas set out in the budget guidelines. The resource<br />
allocations, for the ASLMs for the past three years is as shown in tables immediately<br />
below.<br />
122
Table Q1: Approved Budgets For MAFC, MLFD, MITM & MWI<br />
Approved Recurrent Budget<br />
<strong>Ministry</strong><br />
Financial Year (FY)<br />
2007/8 2008/9 2009/10<br />
MAFC 74,753,052,979 143,498,218,358 160,870,333,000<br />
MLFD 12,621,516,000 24,078,614,200 31,441,286,140<br />
MWI 13,427,915,000 18,048,579,608 19,277,172,000<br />
MITM 17,234,547,000 20,335,088,166 26,498,512,000<br />
Approved Development Budget<br />
<strong>Ministry</strong><br />
Financial Year (FY)<br />
2007/8 2008/9 2009/10<br />
MAFC 60,061,912,600 20,032,832,400 92,694,254,000<br />
MLFD 9,776,000,000 12,378,682,000 18,728,627,000<br />
MWI 224,990,752,600 139,954,882,700 245,656,445,000<br />
MITM 7,395,376,000 31,762,134,600 29,206,157,000<br />
Total Approved Budget<br />
<strong>Ministry</strong><br />
Financial Year (FY)<br />
2007/8 2008/9 2009/10<br />
MAFC 134,814,965,579 163,531,050,758 253,564,587,000<br />
MLFD 22,397,516,000 36,457,296,200 50,169,913,140<br />
MWI 238,418,667,600 156,243,094,700 264,933,617,000<br />
MITM 24,629,923,000 52,097,222,766 55,704,669,000<br />
Source: MAFC, MLFD, MWI & MITM<br />
• Resource allocations for the ministries for the three FYs had been on the increase for<br />
MAFC <strong>and</strong> MITM <strong>and</strong> MLFD, but is a mixed trend for MWI. These trends are<br />
demonstrated by chart no.1 below ;<br />
Chart Q1.1: Approved Budgets For MAFC, MLFD, MITM & MWI<br />
Total Approved Budgets For MAFC, MLFD <strong>and</strong> MWI<br />
for FRs 2007/8 to 2009/10<br />
Tshs<br />
300,000,000,000<br />
250,000,000,000<br />
200,000,000,000<br />
150,000,000,000<br />
100,000,000,000<br />
50,000,000,000<br />
0<br />
2007/8 2008/9<br />
Financial Years (FYs)<br />
2009/10<br />
MAFC<br />
MLFD<br />
MWI<br />
123
• Percentage of Development Resource Allocation Vis Total Budget: The<br />
<strong>per</strong>centages of development budgets to total budgets for the FYs 2007/8 to 2009/10 are<br />
as shown under Table Q2 <strong>and</strong> Chart Q2.1 below.<br />
Table Q2: Percentage of Development vis a vis Total Budgets FYs 2007/8 to FY 2009/10<br />
<strong>Ministry</strong> 2007/8 2008/9 2009/10<br />
MAFC 44.55 12.25 36.56<br />
MLFD 43.65 33.95 37.33<br />
MWI 94.4 89.6 92.7<br />
MITM 30.0 60.97 52.4<br />
Chart Q2.2: Percentage of Development vis a vis Total Budgets FYs 2007/8 to FY 2009/10<br />
Percentages of Development vis Total Budgets for<br />
MAFC, MLFD <strong>and</strong> MWI for FYs 2007/8 to FY 2009/10<br />
MWI<br />
<strong>Ministry</strong><br />
MLFD<br />
MAFC<br />
2009/10<br />
2008/9<br />
2007/8<br />
0 20 40 60 80 100<br />
Percent<br />
• From the Table Q2 above, it can be deduced that a big portion (above 80 <strong>per</strong>cent) of the<br />
resource allocation for MWI goes for development purposes while less than 45 <strong>per</strong>cent of<br />
the total budgets for the MAFC <strong>and</strong> MLDF were allocated to development programmes.<br />
• Composition (sources) of Development Budgets: Table Q3 below shows the sources of<br />
development budgets for MAFC, MLFD <strong>and</strong> MWI; it indicates that over 80 <strong>per</strong>cent of<br />
development funding is from foreign sources.<br />
124
Table Q3: Composition in Percentages of Local <strong>and</strong> Foreign Development Budgets<br />
FYs MAFC MWI MLDF<br />
Foreign Local Foreign Local Foreign Local<br />
2006/07 81.76 18.24 47.2 52.8 82.9 17.1<br />
2007/08 88.75 11.25 68.6 31.4 85.4 14.6<br />
2008/09 87.44 12.56 66.8 33.2 89.4 10.6<br />
2009/10 97.28 2.72 79.5 20.5 55.3 44.7<br />
For the MAFC the <strong>per</strong>centage of local funding for development programs has been declining;<br />
from 18 <strong>per</strong>cent in 2006/7, this went down to 2.7 <strong>per</strong>cent in 2009/10. On the other h<strong>and</strong>, the<br />
recurrent budget has been increasing, largely due to the provision of subsidized fertilizers <strong>and</strong><br />
seeds.<br />
Chart Q3.1: Composition in Amounts of Recurrent <strong>and</strong> Development Budgets (combined Local <strong>and</strong> Foreign)<br />
Comparison Recurrent <strong>and</strong> Development Budget<br />
TSHS. MAFC FYs 2006/7 to 2009/10<br />
300,000,000,000<br />
250,000,000,000<br />
200,000,000,000<br />
150,000,000,000<br />
100,000,000,000<br />
Development<br />
Recurrent<br />
50,000,000,000<br />
0<br />
2006/7 2007/8 2008/9 2009/10<br />
Resource Disbursement <strong>and</strong> Expenditure Priority Areas/Targets in the Resource<br />
Allocation FY 2008/09: Resource allocation priority areas FY 2008/09 for the MAFC, MWI,<br />
MLFD <strong>and</strong> MITM had been defined, <strong>and</strong> both fund <strong>and</strong> expenditure approved, as <strong>per</strong> Table Q4<br />
<strong>and</strong> Chart Q4.1 below. Provision of fertilizer subsidy was given the highest priority among<br />
priorities <strong>and</strong> fund allocated in the priorities areas had been utilized as <strong>per</strong> table below.<br />
125
Table Q4: Resource Allocation Vis. Priority Areas FY 2008/2009 – for MAFC, MLFD, MWI <strong>and</strong><br />
MITM<br />
Vote/<br />
<strong>Ministry</strong><br />
43: MAFC<br />
Total Budget<br />
(OC)<br />
148,786,965,793<br />
Priority Areas/targets Approved<br />
Budget<br />
Expenditure %Expe/<br />
Approv<br />
% Priority/<br />
Total OC<br />
Provision of fertilizer<br />
99.97 36.13<br />
subsidy 53,750,000,000 53,735,500,000<br />
Provision of subsidized<br />
99.49 9.07<br />
certified seeds <strong>and</strong> 13,500,000,000 13,431,769,300<br />
agrochemicals<br />
Acquisition of grains<br />
for national food<br />
reserve<br />
21,656,840,000 21,656,840,000<br />
Conducting dem<strong>and</strong><br />
driven research<br />
3,570,720,000 2,264,215,507<br />
services<br />
Training for extension<br />
revamping programme 1,875,000,000 1,566,711,400<br />
100.00 14.56<br />
63.41 2.40<br />
83.56 1.26<br />
Control of outbreak<br />
pests <strong>and</strong> diseases 1,549,950,000 1,549,950,000<br />
Promotion of agromechanization<br />
420,000,000 380,000,000<br />
100.00 1.04<br />
90.48 0.28<br />
Sub total 148,786,965,793 96,322,510,000 94,584,986,207 98.20 64.74<br />
49:MWI 18,048,579,608 18,048,579,608 17,535,525,344 97.2<br />
99: MLDF 17,970,322,900 17,970,322,900 17,503,094,505 97.4<br />
44:MITM 7,998,509,000 Establishment <strong>and</strong><br />
79,904,000 np 1.0<br />
improvement of<br />
markets information<br />
systems <strong>and</strong> Trade<br />
Infrastructure<br />
Design <strong>and</strong> establish 71,000,000 np 0.09<br />
industrial parks <strong>and</strong><br />
Trade Centres<br />
Development <strong>and</strong> 1,066,624,000 np 13.34<br />
Expansion of<br />
Domestic <strong>and</strong><br />
International Markets<br />
Sub-total 1,217,528,000 15.22<br />
Source: ASLMs<br />
126
Chart Q4.1: Resource Allocation Vis. Priority Areas FY 2008/2009 – for MAFC, MLFD, MWI<br />
<strong>and</strong> MITM<br />
Priorities MAFC 2008/9<br />
Provision of fertilizer<br />
subsidy<br />
Approved Budget<br />
60,000,000,000<br />
50,000,000,000<br />
40,000,000,000<br />
30,000,000,000<br />
20,000,000,000<br />
10,000,000,000<br />
Recurrent Budgets 0<br />
Table P5: Recurrent Budget: Approved Vs. 1 Expenditure<br />
Priority<br />
Provision of subsidized<br />
certified seeds <strong>and</strong><br />
agrochemicals<br />
Acquisition of grains for<br />
national food reserve<br />
Conducting dem<strong>and</strong><br />
driven research services<br />
Training for extension<br />
revamping programme<br />
Control of outbreak<br />
pests <strong>and</strong> diseases<br />
Promotion of<br />
agromechanization<br />
Table Q5 Approved Budget <strong>and</strong> Expenditure FY 2007 to 2009<br />
Vote 2007/08 2008/09<br />
Approved Expenditure %<br />
Exp/<br />
Appr<br />
Approved Expenditure %<br />
Exp/App<br />
r<br />
43: MAFC 74,753,052,979 69,975,770,000 93.61 143,498,218,358 141,314,086,645 98.48<br />
99: MLDF 12,621,516,000 12,102,168,000 96 24,086,614,200 24,078,614,200 99<br />
49: MWI 22,525,466,000 22,013,630,000 97.7 18,048,579,608 17,535,525,344 97.2<br />
44:MITM 24,629,923,000 np 48,109,136,600 np Np<br />
TOTAL 134,529,957,979 104,091,568,000 233,742,548,866 182,928,226,189<br />
The recurrent budgets of the ministries had all been spent by a level of over 90 <strong>per</strong>cent of the<br />
approved budget for both the FYs 2007/8 <strong>and</strong> 2008/9.<br />
127
Development Budget<br />
Table Q6: Development Budget: Approved Vs. Expenditure<br />
Vote 2007/08 2008/09<br />
Approved Expenditure %<br />
Exp/<br />
Appr<br />
Approved Expenditure %<br />
Exp/App<br />
r<br />
43: MAFC 60,061,912,600 54,105,060,000 90.08 20,032,832,400 18,472,453,400 92.21<br />
99: MLDF 9,776,000,000 5,482,005,000 56 12,378,682,000 12,378,682,000 100<br />
49: MWI 222,427,748,000 129,702,616,000 57 141,126,668,700 119,741,566,626 84.8<br />
TOTAL 292,265,660,600 189,389,681,000 173,538,188,100 150,592,702,026<br />
The MAFC had spent her development budget to a level of 90.08% <strong>and</strong> 92.21% for the FY 2007/8<br />
<strong>and</strong> 2008/9 respectively <strong>and</strong> while the MWI spent 57% of the funds allocated for development<br />
programmes for FY 2007/8, <strong>and</strong> 2008/9 it utilized 84.4%.<br />
3.2.0 The ASDP Basket Fund Budget; Planned versus Disbursement <strong>and</strong> Expenditure<br />
3.2.1 Development Partners (DPs) that are currently contributing to the ASDP BF include the<br />
World Bank (WB), International Fund for Agricultural Development (IFAD), Government of<br />
Japan (through JICA), Government of Irel<strong>and</strong> (through Irish Aid) <strong>and</strong> the African Development<br />
Bank (AfDB). The status of contribution in financing the ASDP since July 2006 by both the<br />
Government <strong>and</strong> DPs through ASDP BF lags has been very much lagging behind the financing<br />
requirements over the <strong>per</strong>iod. As at end of August 2009, USD 238.15 million for both<br />
Government <strong>and</strong> DPs has been made available for ASDP; this amount equals approximately 35<br />
<strong>per</strong>cent of the financing requirements up to the time.<br />
Furthermore, considering DPs commitment of USD 99 million for the programme, the overall<br />
funding gap for the ASDP st<strong>and</strong>s at around USD 1.0 billion. Hence, the status of the BF is not<br />
very encouraging in respect to the attainment of ASDP objectives <strong>and</strong> targets.<br />
3.2.2 Nevertheless, the Agricultural Sector Lead Ministries (ASLMs) in FY 2008/2009 had<br />
approval to spend a total of Tshs. 96,140,930,000 for development expenses through ASDP<br />
Basket Fund. Out of the total approved sum, TZS 37,251,348,000 (comprising TZS 18,523,810,000<br />
local funds <strong>and</strong> TZS 18,727,538,000 foreign funds) was for the implementation of the ASDP<br />
National Level Component <strong>and</strong> TZS 58,889,582,000 for the implementation of District<br />
Agricultural Development Plans (DADPs).<br />
128
3.2.3 Planned Budget versus Disbursement <strong>and</strong> Expenditure FY 2008/2009<br />
• Up to 30 th June, 2009 ASLMs (national level component) had been allocated a total of<br />
TZS 20,737,549,000 from the ASDP Basket Fund for the implementation of planned<br />
activities. <strong>Of</strong> the allocated amount TZS 19,557,310,000 (94%) was spent <strong>and</strong> the<br />
remaining amount returned to the Basket Fund Holding Account managed by the Bank<br />
of Tanzania.<br />
• For the local level component, disbursement up to June 30 th 2009, was TZS<br />
58,812,233,431 (100%); <strong>and</strong> a total of TZS 39,803,851,000 (TZS 4,634,795,000 Local <strong>and</strong><br />
TZS 35,169,056.000 Foreign) was spent from ASDP Basket (68 %); see hart 6.1 below.<br />
Chart Q6.1: Status of Basket Fund - approved <strong>and</strong> Expended 2008/09<br />
Status of ASDP Basket Fund FY 2008/9<br />
60,000,000,000<br />
50,000,000,000<br />
40,000,000,000<br />
Tshs.<br />
30,000,000,000<br />
20,000,000,000<br />
10,000,000,000<br />
0<br />
At National<br />
Level<br />
At District Level<br />
(LGAs)<br />
Approved<br />
Spent<br />
Levels<br />
• The unspent amount was carried forward in financial year 2009/2010. Table Q7 below<br />
depicts the financial <strong>per</strong>formance for the ASDP BF for the ASLMs.<br />
129
Table Q7: Summary of Disbursement <strong>and</strong> Expenditure for ASDP BF FY 2008/09 (Tshs ‘000)<br />
Approved Annual Budget Disbursement Expenditure % of Disbursement<br />
Vs. Expenditure<br />
VOTE Local(L) Foreign(F) Local(L) Foreign(F) Local(L) Foreign(F) Local(L) Foreign(F)<br />
43:<br />
MAFC 800,000 10,317,500 400,000 10,317,500 400,000 9,139,428 100 89<br />
99:<br />
MLDF 6,723,810 4,102,812<br />
4,730,000<br />
4,102,812 4,730,000 4,102,812 100 100<br />
44:<br />
MITM 2,476,400 2,476,400 2,474,232 100<br />
49:<br />
MWI 11,000,000 3,357,375<br />
5,632,140<br />
3,357,375 4,707,189 3,357,375 84 100<br />
56:<br />
PMO-<br />
RALG 30,000 483,462 30,000 483,462 30,000 483,462 100 100<br />
Total 18,553,810 20,737,549 10,792,140 20,737,549 9,867,189 19,557,310 91 94<br />
LGAs 4,634,795.000 54,177,438.431 4,634,795.000 54,177,438.431 4,634,795.000 35,169,056.000<br />
100 65<br />
• It can be seen that there were a lot of carryover funds from FY 2008/2009 to FY 2009/10.<br />
The reasons for this large unspent amount of funds were mainly to do with late<br />
disbursement of funds, delayed procurement processes as well as passiveness of<br />
district agricultural authorities in some LGAs. These were discussed thoroughly under<br />
the section on assessment of progress made in planning, formulation <strong>and</strong><br />
implementation of DADPs.<br />
3.2.4 ASDP Basket Fund Commitment for FY 2009/2010<br />
• The DPs have committed USD 91.4 million, equal to around TZS 118.9 billion to fund<br />
ASDP programme activities for FY 2009/2010. Likewise, the ASLMs <strong>and</strong> Regional<br />
Secretariats have committed TZS 27.08 billion for the same, making total commitment<br />
of TZS 145.98 billion. We can see that the Government is increasing its efforts towards<br />
financing the programme by a 46.2% rise compared to previous year.<br />
• We can conclude that there is still much to be done by both the DPs <strong>and</strong> the Government<br />
in order mobilize resources for financing implementation of ASDP effectively. It is<br />
because being in the fourth year of implementing the seven year programme, we are still<br />
under 40 <strong>per</strong>cent of the financing requirements for the said <strong>per</strong>iod.<br />
Further budget votes analysis is provided under Annexes Group 1 for PER; Tables X1 to X10, below.<br />
3.3 Financial Management<br />
3.3.1 Financial Statements: Section 25(4) of the Public Finance Act, 2001 (as amended in 2004)<br />
requires management to prepare financial statements for each financial year, requires<br />
management to ensure the reporting entity keeps pro<strong>per</strong> accounting records <strong>and</strong> safeguards the<br />
assets of the reporting entity. The management had prepared the 2008/9 annual financial<br />
130
statements for FY 2008/09 using appropriate accounting policies supported by reasonable <strong>and</strong><br />
prudent judgments <strong>and</strong> estimates , in conformity with the Cash Basis International Public<br />
Sector Accounting St<strong>and</strong>ard (IPSAS): Financial Reporting under cash basis of Accounting <strong>and</strong><br />
in the manner required by the section 25(4) of the Public Finance Act, 2001 (as amended in 2004).<br />
3.3.2 Financial Control: The system of internal audit control had o<strong>per</strong>ated adequately<br />
throughout the reporting <strong>per</strong>iod <strong>and</strong> that the records <strong>and</strong> underlying accounts provide a<br />
reasonable basis for the preparation of the financial statements for the FY 2008/09 <strong>and</strong> in<br />
accordance with Regulation 30(1) of the public Finance Regulations of 2001 <strong>and</strong> as <strong>revis</strong>ed in<br />
2004.<br />
3.3.3 Procurement of goods <strong>and</strong> services; Procurement of goods, works <strong>and</strong> consultancy <strong>and</strong><br />
non-consultancy services have been done through the Ministerial Tender Board <strong>and</strong> in<br />
accordance the Public Procurement Act, 2004 <strong>and</strong> Public Procurement Regulations, 2005 for<br />
procurement of goods, services <strong>and</strong> works<br />
3.4 Assessment of the Value for Money in the Smart Agricultural Inputs Subsidy<br />
Programme<br />
Agricultural Input Subsidies: Subsidies <strong>and</strong> voucher programs were designed after it was<br />
realized that many smallholder farmers <strong>and</strong> cattle kee<strong>per</strong>s could not afford to buy agricultural<br />
inputs because of escalating prices. Subsidies given by the Government were reintroduced in the<br />
FY 2003/04, under which it provided fertilizer subsidy for grain production in the southern zone<br />
(Mbeya, Ruvuma, Iringa <strong>and</strong> Rukwa regions) by setting aside Tshs 2 billion to meet part of the<br />
transport cost.<br />
In 2006/07 a total of 108,703 tons of subsidized fertilizer was provided to the farmers, resulting<br />
in total production of 3,423,025 tons maize, whereas in season 2007/08 a total of 81,980 tons of<br />
subsidized fertilizer was provided to the farmers, producing 3,555,833 tons maize. In 2008/09<br />
the agricultural input subsidy for fertilizer reached Tshs 53.75 billion; <strong>and</strong> for certified seeds <strong>and</strong><br />
agro chemicals reached Tshs13.5 billion. Table Q8 below shows the level of subsidies for the 2006<br />
to 2008 years. In the FY 2008/09 a total of 141,050 metric tons of subsidized fertilizers <strong>and</strong> 7,180<br />
metric tons of seeds were distributed to 11 regions of Tanzania under voucher system. As a<br />
result of this Government intervention, maize production increased in Rukwa, Iringa, Mbeya,<br />
Ruvuma <strong>and</strong> Kigoma. Total national production for maize was 3,424,984 tons; thus maintaining<br />
almost the previous production level.<br />
In addition, 7,830,000 improved seedlings for tea crop were produced by 141 farmer groups from<br />
11 districts under the subsidy program; <strong>and</strong> also, 1,141,758 acre packs of agrochemicals for<br />
cotton crop were distributed to cotton farmers under the subsidy arrangement; as a result cotton<br />
production in the WCGA increased from 199,954,126 kgs of seed cotton in 2007/08 to 366,244,696<br />
kgs in 2008/09.<br />
Value for money here can be seen in that maize production level has been maintained, most<br />
likely because of inputs subsidies, in particular fertilizer <strong>and</strong> seed. Similarly for seed cotton,<br />
which increased as <strong>per</strong> provided figures above.<br />
131
Table Q8 Level of Input Subsidies by the Government from 2006/07 to 2007/08<br />
Input type Unit of 2006/07 2007/08<br />
%<br />
measure Target Actual Target Actual Change<br />
Achievement<br />
Achievement<br />
Fertilizer Ton 385,000 284,925 385,000 111,530 -60.9<br />
Fertilizer Ton 108,703 108,703 89,820 81,980 -24.6<br />
Subsidy<br />
Seeds Ton 29,640 12,119.8 29,640 16,392 35.2<br />
Chemicals: Lts 1,692,048 1,269036 1,844,617.3 1,383,463 9<br />
Liquids<br />
Powder Ton 1,472 1,103.61 4,296 3,222 192<br />
Furthermore, 3,616,522 litres of agrochemicals were issued to cashew-nut farmers as subsidies,<br />
<strong>and</strong> this helped to sustain cashew nut production at good level of about 97,000 tones.<br />
As for livestock, a total of 649,552 litres of accaricide were procured <strong>and</strong> distributed to 21 regions<br />
for controlling tick <strong>and</strong> tick borne diseases. The result was that cattle deaths especially in calves,<br />
went down, as was reported by cattle kee<strong>per</strong>s in Ngombe village, Misungwi district, that was<br />
visited..<br />
3.5 Constraints: - Mwanza example<br />
• In Mwanza Region the usage/utilization of agrochemicals for cotton production was low<br />
compared to 2007/08 because farmers failed to pay their share of the cost in cash. In the<br />
previous seasons they were able to pay their share contribution through passbook system<br />
whereby a farmer was deducted part of his/her seed cotton sales proceeds Farmers in<br />
Ngombe village, Misungwi District had said this “We don’t use fertilizers because we<br />
don’t have money to pay for the input at the time of its application”. It is therefore<br />
recommended that the passbook system should be reintroduced as farmers do not have<br />
the culture of saving in anticipation of the following season.<br />
• The subsidy arrangement for cotton production does not cover fertilizers. Fertilizers are<br />
of paramount importance in increasing the productivity of cotton. It is recommended that<br />
fertilizers subsidy should be included in input subsidy program for cotton production.<br />
• It was noted that in Mwanza Region there were very few agrochemical stockists (79) who<br />
are mostly in towns making it difficult for farmers in the rural areas to access subsidized<br />
inputs. It is highly recommended that villages through agricultural <strong>and</strong> marketing<br />
coo<strong>per</strong>atives (AMCOs), establish village stores whereby farmers will access subsidized<br />
agro- inputs as has been the case in some of the districts in the Southern Zone..<br />
• The use of subsidized inputs should go h<strong>and</strong> in h<strong>and</strong> with the provision of extension<br />
services to support its utilization. In Mara Region there was a shortage of 300 village<br />
132
extension staff thereby impairing the effective use of subsidized inputs. In Rorya District<br />
most of the subsidized accaricides sent for cattle dipping could not be utilized since the<br />
cattle kee<strong>per</strong>s in the area were not sensitized on the importance <strong>and</strong> use of the input. It is<br />
recommended that since farmers <strong>and</strong> livestock kee<strong>per</strong>s are ignorant about the<br />
government initiatives on voucher <strong>and</strong> subsidy programme, more training be provided to<br />
the farmers in order to have effective implementation of the programme; <strong>and</strong> therefore<br />
achieve intended results..<br />
• Loans which could be used to assist farmers in acquiring subsidized inputs are not<br />
readily available as the Agricultural Input Fund <strong>and</strong> commercial banks find it difficult to<br />
lend farmers due to lack of reliable loan security. The formation of agriculture bank<br />
should be speeded up.<br />
Thus, if these recommendations were implemented, there would be enhanced value for money on<br />
the subsidies provided.<br />
133
4.0 RECOMMENDATIONS<br />
4.1 FROM SECTOR REVIEW<br />
The study has, based on the finding, attempted to point out below priorities under each subsector.<br />
However, ideally what is required is integrated approach towards solving a particular<br />
problem; for instance the need to institute a rigorous quality assurance; this touches the entire<br />
sector, <strong>and</strong> so on. For this reason in almost each the recommendation to particular sub-sector, we<br />
have joined other parties, including the private sector. Further, at the end we have also put down<br />
what broad problem areas that Government could tackle in order to make the work of the<br />
subsectors easier. The recommendations to sub-sectors are then as provided immediately below.<br />
Irrigation Sub-sector<br />
i) Exp<strong>and</strong> <strong>and</strong> intensify large, small <strong>and</strong> medium irrigation scheme investments. This was<br />
observed to be a very reliable way for furthering MKUKUTA targets of economic growth,<br />
reducing income poverty <strong>and</strong> strengthening food security. This was observed in respect of farmers/<br />
families participating in irrigation schemes; they had no food shortage, had enough income for meeting<br />
other basic needs - they had better houses than those not in schemes; were educating their children; were<br />
meeting their medical needs, <strong>and</strong> so on. Farmers in visited irrigation schemes of Dakawa (Mvomero),<br />
Inyala (Mbeya Rural) <strong>and</strong> Mkula (Kilombero), are some of the examples. Government must push<br />
strongly along this irrigation front without delay by providing needed investment climate/<br />
environment <strong>and</strong> facilitation. There are huge bodies of water mass untapped in fresh lakes,<br />
rivers, basins, coupled with millions of untapped combined high <strong>and</strong> medium potential irrigable<br />
l<strong>and</strong>. Where irrigation funds are limited, phasing is necessary in order to complete first phase of<br />
projects before going to new ones.<br />
ii) For small scale irrigation on slope l<strong>and</strong>s it would be best to adopt the TIP type structures<br />
implemented in Same, Lushoto <strong>and</strong> other districts. Again if irrigation funds are limited, phasing<br />
is necessary - complete one phase of projects before going to new ones.<br />
iii) Working with MAFC, LGA <strong>and</strong> other stakeholders organize farmers in irrigation (water user<br />
associations) to ensure each of them contributes sufficiently into the irrigation maintenance fund<br />
for the respective schemes.<br />
Crop Sub-sector<br />
i) In consultation with the relevant stakeholders revive (<strong>and</strong> sufficiently fund) the agricultural<br />
machinery testing - there was the Tanzania Machinery Testing Unit (TAMTU), which was based<br />
in Arusha <strong>and</strong> inherited by the CARMATEC, which has not really taken on the original testing<br />
function. The revived institution would work with TRA <strong>and</strong> TBS, but would take the pivotal regulatory<br />
role to ensure sub-st<strong>and</strong>ard farming machinery/equipment (tractors, ploughs, cultivators, power tillers,<br />
seeders, fertilizer applicators, weeders, sprayers, combine harvesters, processing units, produce grading<br />
equipment, hoes, machetes <strong>and</strong> other small farming tools, <strong>and</strong> so on) do not enter this country.<br />
134
ii) Work with MITM <strong>and</strong> other stakeholders to attract investment in local manufacture of<br />
farming machinery, implements <strong>and</strong> equipment. In the production of small scale production<br />
equipment it could support SIDO to enable it revive the ‘small scale industrial estates’ for the<br />
purpose. SIDO is already producing some very useful machinery such as the small scale grading <strong>and</strong><br />
processing of cashew nuts at its Lindi Centre. However, it is constrained in bulking the production due to<br />
lack of capital.<br />
iii) In consultation with other relevant stakeholders, up-scale (<strong>and</strong> fund adequately) the agrochemicals<br />
testing function of TPRI (Tropical Pesticide Research Institute) to include field<br />
monitoring of agro-chemical in the field. This is to ensure farmers (including livestock kee<strong>per</strong>s) are not<br />
cheated or made to suffer loss due to applying sub-st<strong>and</strong>ard agrochemical in field spraying, dusting; or in<br />
storage; (or in livestock spraying, dipping or inoculation in case of livestock)<br />
iv) Working with other relevant stakeholders such as the Government Chemist to ensure testing<br />
of samples of fertilizer intended to be imported or in the country for distribution to farmers to<br />
ensure farmers are not supplied with sub-st<strong>and</strong>ard fertilizer.<br />
v) In consultation with MITM, TBS <strong>and</strong> other relevant stakeholders work to attract investment in<br />
local manufacture of wider spectrum of needed fertilizers <strong>and</strong> agro-chemical. This will help in<br />
close monitoring of quality.<br />
vi) Put in place a system that will ensure early ordering of inputs; early delivery to regional<br />
centres; <strong>and</strong> on to farmers. The system to broaden supply source; to have efficient, disciplined<br />
distribution machinery reaching even remote villages; it should also provide training to input<br />
distributors/ stockists.<br />
vii) Working in collaboration with other relevant stakeholders, facilitate SACCOS/<br />
coo<strong>per</strong>atives/ crop boards to revive the practice of making agreed deductions on farmers’ crop<br />
sales (at Warehouse Receipt system, <strong>and</strong> at auctions) to create individual savings for the farmers<br />
in a trust fund, to enable them buy inputs in the following season, <strong>and</strong> do so timely. These<br />
deductions are necessary, as many farmers were found using little or no fertilizer on their crop<br />
(no savings to buy inputs at time required), thus not attaining good yields volume.<br />
viii) Speed up establishment <strong>and</strong> strengthening of SACCOS for serving farmers <strong>and</strong> even small<br />
traders <strong>and</strong> small processors.<br />
ix) Strengthen Coo<strong>per</strong>ative Unions by providing training on organisational management, bookkeeping,<br />
business management. Also arrange for them to have firm financial discipline <strong>and</strong><br />
management.<br />
x) Strengthen SACCOS for serving farmers <strong>and</strong> even small traders <strong>and</strong> small processors.<br />
xi) Now that prices of inputs (fertilizers; agro-chemicals) are soaring Government should beef up<br />
input subsidies to even much higher level. At the same time MAFC / LGAs should facilitate<br />
famers to adopt organic manuring (use of green manure; making <strong>and</strong> using compost; <strong>and</strong> farm<br />
yard manure), <strong>and</strong> biological pest control measures (IPM) more rigorously.<br />
135
xii) As many farmers were found to be using unimproved seed/ seedlings, work with other<br />
relevant stakeholders, to put in place an incentive policy (including making l<strong>and</strong> available) that<br />
will attract large investment in local production of improved seed <strong>and</strong> seedlings across most of<br />
the food <strong>and</strong> export crops. Currently there is large importation of seed particularly for food crops (in<br />
particular maize) <strong>and</strong> vegetables seed. Request Government, among other things, to look into possibility of<br />
providing credit guarantee to prospective large scale quality seed production investors<br />
xiii) Working with other stakeholders, up-scale the training activities of KATC to ensure that<br />
their very good model of FFS training for paddy/ rice farming reaches all irrigation schemes in<br />
the country. Sufficient funds should be made available to set up <strong>and</strong> run KATC type training<br />
services for paddy/rice extension technicians the key farmers; including for setting up more<br />
model farms.<br />
xiv) Open more FFS country wide, while at the same time training <strong>and</strong> deploying more<br />
agricultural extension workers towards/ villages <strong>and</strong> irrigation schemes. At the same time it<br />
should provide adequate funding in terms of working facilities (including vehicles, moisture<br />
meters, GPS, <strong>and</strong> so on), <strong>and</strong> incentives (housing, allowances <strong>and</strong> short refresher course practical<br />
training) to the extension staff.<br />
xv) Working with MWI, LGA <strong>and</strong> other stakeholders organize farmers in irrigation (water user<br />
associations) to ensure each of them contribute sufficiently into the irrigation maintenance fund<br />
for the respective schemes.<br />
xvi) Provide training <strong>and</strong> support rainwater harvesting for farmers to enable them undertake<br />
supplementary. This is particularly important in the northern zone where field crops seem to get<br />
cut off rain at the critical cob bearing stage. At the same time provide training on an irrigation<br />
technology that is economical practicable on water use.<br />
xvii) Beef up research funding for adapting/producing improved crop varieties in order to keep<br />
up with climate change <strong>and</strong> continually evolving hazards of pests. The SARO rice variety produced<br />
locally <strong>and</strong> the high producing UKM cotton variety adapted from Mali, are st<strong>and</strong>ing successes that show<br />
what research <strong>and</strong> development (R&D) can do a good job in crop production improvement.<br />
xviii) Work with other stakeholders to up funding of Plant Sanitary <strong>and</strong> Quarantine services<br />
prevent infected seed <strong>and</strong> plant material from entering the country, particularly due to<br />
globalisation that is making people, livestock <strong>and</strong> materials move world over much more than it<br />
was in the past.<br />
xix) Working with other stakeholders draw up a code of conduct for producers for guaranteeing,<br />
through bylaws, product quality (for instance preventing poor crop commodities from reaching<br />
market places (primary societies, Warehouse receipts centres, auctions; <strong>and</strong> also preventing<br />
processors <strong>and</strong> exporter from selling sub-st<strong>and</strong>ard products)<br />
xx) In collaboration with other stakeholders, complete the indicator targets for the ‘ short listed<br />
indicators framework’ for the ASDP.<br />
xxi) L<strong>and</strong> use planning efforts (including instituting bylaws) by the sub-sector should be<br />
speeded up. Country-wide pro<strong>per</strong> l<strong>and</strong> use is not being practiced in a number of cases - for<br />
instance cultivation on slope is undertaken downward; contours are made along the slope;<br />
136
cultivation done on very hilly slopes without any terraces at all. Also some crops are grown in l<strong>and</strong>s<br />
where for years no crop has been harvested, yet the farmers continue growing the same crop in those areas;<br />
this was observed in for instance in the lower areas of Same <strong>and</strong> Mwanga (Kilimanjaro Region).<br />
ON PROCESSING<br />
xxi) In collaboration with MITM, LGAs <strong>and</strong> other relevant stakeholders, facilitate training to<br />
farmers on pro<strong>per</strong> h<strong>and</strong>ling <strong>and</strong> grading of crops.<br />
xxii) In collaboration with MITM <strong>and</strong> other relevant stakeholders, facilitate major investment in<br />
local agro-processing of currently raw exported crops, both large <strong>and</strong> small scale<br />
xxiii) In collaboration with MITM organize <strong>and</strong> provide training to small scale crop processor<br />
groups (<strong>and</strong> individuals) in order for them to produce multi-products, quality commodities.<br />
Cashew nuts can be processed to produce several quality products in dem<strong>and</strong> on the market;<br />
coffee can be roasted; <strong>and</strong> so on.<br />
xxi) In collaboration with other stakeholders, provide training on effective planning of sub-sector<br />
DADPs, particularly in those districts where this is still unsatisfactorily provided.<br />
Livestock Sub-Sector<br />
i) Targeted vaccination <strong>and</strong> inoculation of livestock campaign against various animal disease<br />
outbreaks (whether occurring in the country of in any of neighbouring countries) must be<br />
maintained; no relenting. There are the specific livestock diseases (like rinderpest) <strong>and</strong> also the zoonoses<br />
– livestock diseases that go on to affect humans (especially the bird flu, swine fever <strong>and</strong> so on). Within<br />
country livestock disease outbreaks like that Foot <strong>and</strong> mouth disease, the Rift valley Fever <strong>and</strong><br />
similar others must be fought rigorously, including instituting animal quarantines.<br />
ii)Working with other relevant stakeholders put in place a well funded programme of up-scaling<br />
the activities on the National Artificial Insemination Centre (NAIC) in order to up-grade the<br />
local Zebu breed both in milk production <strong>and</strong> in quality beef production. This can greatly reduce<br />
income poverty; <strong>and</strong> also contribute to food security in terms of milk in particular, especially for<br />
children <strong>and</strong> lactating mothers. NAIC should be quickly funded to set up <strong>and</strong> o<strong>per</strong>ate zonal<br />
centres. Up grading the livestock breeds would bring out desired results in fairly short tome. At<br />
the time of visit the centre had some 75,000 semen packs ready for use -- reason small farmers cannot<br />
afford the price. The Government should look into possibility of subsidizing this input to farmers, just like<br />
it does for fertilizer, seed <strong>and</strong> so on<br />
ii) Sub-sector to work with other stakeholders to beef up research funding for<br />
adapting/producing improved livestock breeds in order to keep up with climate change <strong>and</strong><br />
combat continuous evolving of animal pests <strong>and</strong> diseases.<br />
iii) Work with other stakeholders to increase funding of animal sanitary <strong>and</strong> quarantine services<br />
to prevent infected livestock <strong>and</strong> livestock products from entering the country, particularly due<br />
137
to globalisation that is making people, livestock <strong>and</strong> materials move world over much more than<br />
it was in the past.<br />
iv) Draw up a code of conduct for producers for guaranteeing, through bylaws, product quality<br />
(for instance preventing adulteration of milk, or selling untreated skins)<br />
v) Working with MWI, LGA <strong>and</strong> other stakeholders organize livestock kee<strong>per</strong>s to contribute<br />
adequate funds for maintenance of the livestock facilities they are using.<br />
v) Working with MWI, LGA <strong>and</strong> other stakeholders organize livestock kee<strong>per</strong>s to plan livestock<br />
facilities projects (cattle dips, charco dams), <strong>and</strong> to ensure each contributes fully their share of<br />
cost of establishing the approved projects.<br />
vi) Provide training <strong>and</strong> support rainwater harvesting for livestock kee<strong>per</strong>s to enable them<br />
undertake supplementary irrigation on livestock pastures. This is particularly important in the<br />
northern <strong>and</strong> central zones where dry season drought has been responsible for almost massive<br />
death of livestock year in, year out. At the same time provide training on appropriate technology,<br />
particularly that is economical <strong>and</strong> practicable on water use in the specific areas.<br />
vii) Free grazing livestock are known to be a destructive lot both on the l<strong>and</strong> environment<br />
(leaving l<strong>and</strong> bare in their wake <strong>and</strong> exposing it to agents of erosion – wind, rain, <strong>and</strong> so on),<br />
<strong>and</strong> also to the livestock themselves (losing weight due to long travels in search of forage <strong>and</strong><br />
water), there is urgency for the sub-sector to institute an integrated programme that will enable<br />
livestock free grazers to become settled, <strong>and</strong> even have individual livestock kee<strong>per</strong>’s area fenced<br />
in (using non costly material such as thorny bushes). But then there should be health <strong>and</strong> water<br />
facilities for both livestock <strong>and</strong> humans within short distances. Also a very important element<br />
for effecting settled livestock keeping is having in place effective pasture development <strong>and</strong><br />
management (rotational grazing, fertilizer application, weeding technology - e.g. use of<br />
herbicides); <strong>and</strong> forage conservation programmes.<br />
viii) In collaboration with other stakeholders, provide training on effective planning of subsector<br />
DADPs, particularly in those districts where this still unsatisfactorily provided.<br />
ix) In collaboration with other stakeholders, complete the indicator targets for the ‘ short listed<br />
indicators framework’ for the ASDP.<br />
ON PROCESSING<br />
x) In collaboration with MITM <strong>and</strong> other relevant stakeholders, facilitate major investment in<br />
local livestock products processing of currently raw exported products, both large <strong>and</strong> small<br />
scale<br />
xi) Organize <strong>and</strong> provide training to small scale livestock products processors in order for them<br />
to produce multi-products, quality commodities - shoes, belts, Cashew nuts can be processed to<br />
produce several quality products in dem<strong>and</strong> on the market; <strong>and</strong> so on.<br />
138
Marketing Sub-Sector<br />
Lack of reliable, rewarding market is one of the biggest constraints to development of the<br />
agricultural sector. Large volumes of fruits <strong>and</strong> vegetables rot yearly due to lack of market.<br />
Produce market centres are few <strong>and</strong> most undeveloped <strong>and</strong> space provided may be too small in<br />
a number of cases. Organised produce collection centres are few. Farmers in many areas lack<br />
bargaining power, as are not organised, <strong>and</strong> have no bargaining skills. Also market access is in<br />
many cases ham<strong>per</strong>ed due to poor or non-existence of roads; <strong>and</strong> where they exist, transport<br />
charges are in any case high. Export crops markets are likely shrinking due to the global<br />
meltdown; <strong>and</strong> prices offered are depressed. In addition there are no quality assurance measures<br />
in place for several crops almost country-wide. Indeed, one could go on <strong>and</strong> on, as the problems<br />
are many as already discussed in the market section above.<br />
Now, priority areas for this sub-sector:<br />
i) Mount vigorous search for new markets for Tanzania’s crop commodities (traditional <strong>and</strong> non<br />
traditional; raw <strong>and</strong> processed), Livestock products (live animals, beef, hides <strong>and</strong> skins), <strong>and</strong><br />
livestock tertiary livestock products (leather, shoes, belts, h<strong>and</strong> bags, <strong>and</strong> so on. Sector should all<br />
possible innovative means – work with Tanzania Trade Centres abroad & embassies abroad; arrange/<br />
participate in trade fairs (where relevant products are presented); contact prospective buyers <strong>and</strong> soliciting<br />
orders; arrange promotional trade tours (as they do for the Tourism Industry)<br />
ii) In collaboration with LGA (<strong>and</strong> respective communities) <strong>and</strong> other stakeholders develop a<br />
nation-wide marketing infrastructural packages system, This will be an extension of what<br />
AMSDP is doing; but should be more intensified horizontally <strong>and</strong> vertically. The system<br />
packages could in fact be a mirror image of what was done <strong>and</strong> how it was done under PEDP<br />
(Primary Education Development Programme) or now SEDP (Secondary Education<br />
Development Programme). Thus government in partnership with the LGA communities (<strong>and</strong><br />
other stakeholders, including the private sector) will implement LGA level marketing<br />
infrastructural packages that will comprise:<br />
- construction of attractive village (or at least ward) level modern produce collection/<br />
marketing centres (with full facilities - fence, receiving concrete floor-provided sheds,<br />
concrete floor-provided sheds selling sheds, ample storage, reasonable secure parking for<br />
lorries <strong>and</strong> other vehicles; <strong>and</strong> should also be provided with utilities (water <strong>and</strong> even<br />
electricity if possible) <strong>and</strong> paid for, private run, toilets <strong>and</strong> baths. Even the surroundings<br />
could be provided with modern restaurants <strong>and</strong> good l<strong>and</strong>scape, to make the<br />
marketplace area really attractive; <strong>and</strong> do away with the current ramshackle existing in<br />
many so- called markets. To avoid too much congestion only raw <strong>and</strong> processed<br />
agricultural commodities would be sold in the area designated as market area, including<br />
any of its developed area. There should be no other construction in the premises of the<br />
market area, except the ones indicated<br />
- construction of modern District level agricultural produce market place. This would be<br />
much larger ( anything from 4 to 10 ha); <strong>and</strong> this does to be built in the present<br />
municipal centres. It should have facilities much as stated for the villa, but they will be<br />
much larger. There could also be a large, budget hostel to house customers that would<br />
139
have come from far <strong>and</strong>s would want to have a place to stay overnight or so; but this<br />
should be built outside the market designated area.<br />
- Sustainable rural road repair <strong>and</strong> maintenance fund (at both village <strong>and</strong> district level);<br />
<strong>and</strong> this be used for repair of the respective roads.<br />
- Modern market information services unit (at both levels), complete with internet services<br />
(if power <strong>and</strong> competent staff are available).<br />
ii) Working with LGAs, private sector <strong>and</strong> other stakeholders, institute innovative promotional<br />
campaign domestically in order to have more of local products reach even the furthest of<br />
customers; at the same time stimulating further production; thereby stimulating economic<br />
growth; contributing to fighting income poverty <strong>and</strong> food insecurity.<br />
iii) Working with MAFC, MLDF, LGAs, TBS, the private sector <strong>and</strong> other stakeholders, work to<br />
put in place rigorous st<strong>and</strong>ards requirement (quality assurance programme), first for export<br />
crops, <strong>and</strong> subsequently for domestic crops.<br />
iv) Working with the <strong>Ministry</strong> of Infrastructural Development, private sector <strong>and</strong> other<br />
stakeholders, work to put in place a system that will ensure that export crops are h<strong>and</strong>led<br />
pro<strong>per</strong>ly at ports <strong>and</strong> at airports, <strong>and</strong> that they leave timely to the destined markets, on a<br />
sustainable basis.<br />
v) In collaboration with other ASLMs <strong>and</strong> private sector, provide training on marketing (in the<br />
4Ps - promotion, packaging, placement /distribution <strong>and</strong> pricing) <strong>and</strong> also on bargaining skills<br />
(trade negotiations) to agricultural marketing coo<strong>per</strong>atives/ associations, small scale trader<br />
groups <strong>and</strong> other relevant groups along the agricultural commodity value chain.<br />
vi) Work with other ASLMs, MoFE, private sector <strong>and</strong> other stakeholders on ways of reducing<br />
commodities marketing costs in order to increase take-home by producers.<br />
RECOMMENDATIONS ON PRIORITY FOR POLICY AND REGULATORY FRAMEWORK.<br />
Currently the regulatory framework for the sector seems not to be working to expectation in<br />
some areas. For instance there is now, as observed by the consultant, erosion of quality all along<br />
the value chain; from input <strong>and</strong> equipment supply to the field crop <strong>and</strong> livestock beasts, to<br />
h<strong>and</strong>ling <strong>and</strong> storage of harvested produce, to processing, <strong>and</strong> to marketed produce (at both<br />
domestic <strong>and</strong> export market). There must be quality production <strong>and</strong> quality marketed produce,<br />
whether crop based or livestock based commodities.<br />
In any case the recommendations made above for the sub-sectors are a reflection of what is<br />
needed in policy <strong>and</strong> regulatory requirement. It is therefore not necessary to go much further<br />
into specifying new interventions in this area; as the different sub-sectors have opportunity to<br />
select/ phase policies <strong>and</strong> regulations that they would want to put in place for purpose of<br />
uplifting the sector. However, policy <strong>and</strong> regulatory framework on:<br />
140
i) Quality assurance along the entire agricultural commodities chain in respect of export crops<br />
(both traditional <strong>and</strong> non-traditional). The aim must be to eventually secure iso-product<br />
certificates in order to position well in the various market/ market niches.<br />
ii) More incentive packages are needed to enable attracting major agri-business investments;<br />
including favourable resources (l<strong>and</strong>, irrigation water, <strong>and</strong> so on) access; more favourable tax<br />
regime on both inputs <strong>and</strong> products; as well as favourable credit arrangements - possibly<br />
involving government guarantees.<br />
iii) Medium <strong>and</strong> long-term policies are needed for development <strong>and</strong> management of marketing<br />
centres; including fencing them <strong>and</strong> provision of title deeds.<br />
iii) Medium <strong>and</strong> long-term policies are needed to ensure hitherto unused l<strong>and</strong> in villages is unequivocally<br />
made available for allocation to prospective farm develo<strong>per</strong>s, particularly medium<br />
scale investors<br />
ii) Streamline arrangements for rural roads management (role for district councils <strong>and</strong><br />
communities in terms of funding <strong>and</strong> management)<br />
v) Favourable credit environment is needed for coo<strong>per</strong>atives crop marketing role.<br />
vi) Speeding up of establishment of the Agricultural Investment Bank is crucial.<br />
vii) Policy framework is needed to enable agricultural production <strong>and</strong> marketing coo<strong>per</strong>atives/<br />
associations to run efficiently <strong>and</strong> to grow; similarly for sector related SACCOS<br />
viii) Policy framework is needed to ensure farmers have their own funds set aside for purchase/<br />
provision of inputs at the time the inputs are needed; a comprehensive, sustained policy of<br />
making deductions on farmers sales would help. Spreading country-wide, a well managed <strong>and</strong><br />
regulated ware-house receipt system could be a good starting point.<br />
ix) Contract farming arrangements need to have policy framework that will ensure each part has<br />
a fair deal that is legally binding - from production to marketing to distribution of proceeds.<br />
x) Medium <strong>and</strong> long-term policies are needed for promoting agro-processing at both small scale<br />
<strong>and</strong> large scale.<br />
x) Medium <strong>and</strong> long-term policies are needed for development <strong>and</strong> management of marketing<br />
centres; including fencing them <strong>and</strong> provision of title deeds.<br />
x) Medium <strong>and</strong> long-term policies are needed for farm produce h<strong>and</strong>ling <strong>and</strong> storage.<br />
x) Overall policies of reducing costs of production <strong>and</strong> of marketing are needed especially now<br />
there is this global economic meltdown <strong>and</strong> impending completion in the regional market, in<br />
particular in the East African Common Market where duties within the common market have<br />
been removed.<br />
141
RECOMMENDATIONS FOR GOVERNMENT; IN ORDER TO SUPPORT SUB-SECTOR<br />
ACTIVITIES<br />
1. Invest heavily in transport infrastructure: railway (modernise railway system), roads<br />
(especially rural roads to make them all weather), marine <strong>and</strong> air transport (this to facilitate air<br />
freighting of non traditional - horticultural crops on to the export market)<br />
2) Facilitate fast clearance of agricultural inputs/ equipment from ports to enable these reach<br />
farmer in time<br />
3) Invest heavily in development of energy; <strong>and</strong> supply this country-wide well effectively.<br />
Similarly for rural water supply <strong>and</strong> domestic supply of electricity.<br />
4) Continue investing substantially in provision of health facilities <strong>and</strong> schools in the rural areas<br />
5) Government should speed up establishment of the Tanzania Agricultural Investment Bank<br />
that will provide much needed fitting loans (especially long term ones 7 to 10 years <strong>and</strong> over) to<br />
agriculture sector.<br />
6) Government should continue striving towards reducing costs of doing farming business,<br />
including having in place policies that will make earmarked farm investment l<strong>and</strong> available to<br />
prospective investors unequivocally <strong>and</strong> with minimum of red-tape, country-wide. Big farm<br />
investments, among other things, create rural employment.<br />
All the above services will contribute very much towards making rural life attractive <strong>and</strong><br />
agriculturally much more productive. It will make youth stay on l<strong>and</strong> farming; engaging in nonfarm<br />
income generating activities; make people use alternative sources of cooking energy<br />
(instead of decimating forests in pursuit for more <strong>and</strong> more firewood).<br />
142
4.2) RECOMMENDATIONS FOR PUBLIC ALLOCATION AND EXPENDITURE<br />
i) In the study it was noted that there is good trend that all allocated money in the Basket Fund is all<br />
being disbursed. However, the disbursements seem to be effected late, with the result some of<br />
it is not expended <strong>and</strong> is returned to the Basket Fund Holding Account managed by<br />
the Bank of Tanzania. For instance in 2008/09 out of Tshs 20,737,549,000 Basket Fund<br />
allocated <strong>and</strong> disbursed to ASLMs, Tshs 1,180,239,000 (or about 5.7%) was returned<br />
unspent; it was quite substantial sum for a poor country like Tanzania. The reason for<br />
the non-spending was due to the fact that the disbursement reached ASLMs late. It<br />
was even worse for the districts where 33% (one-third) of the funds disbursed had to<br />
be returned unspent to the Basket Fund Holding Account! Again the reason was late<br />
disbursements; this was observed also in the districts visited - Rorya, for instance.<br />
Thus efforts be made to ensure disbursements in 2009/10 are effected much faster;<br />
<strong>and</strong> this is especially important for this year (2009/10) as the funds are much bigger.<br />
ii) The 2009/10 development budget seems really intended to put development resources where<br />
they are best required <strong>and</strong> in line with the need to implement cluster 1 targets of MKUKUTA<br />
– growth <strong>and</strong> reduction of income poverty, as well as towards achievement of food security.<br />
Thus the development budget for MWI (for development of irrigation infrastructure<br />
especially - there are country-wide many virtually hundreds of unfinished small irrigation<br />
projects, <strong>and</strong> many big ones too) has been increased by 75%, while that for MAFC has been<br />
increased by 363 % to enable it implement agriculture related developments. This trend of<br />
increasing development resources to MWI <strong>and</strong> MAFC, <strong>and</strong> indeed to LGAs should be<br />
sustained in order to meet MKUKUTA <strong>and</strong> TDV2025 targets (good livelihood for all,<br />
medium income country, <strong>and</strong> so on).<br />
iii) The recurrent budgets for ASLMs has been increasing over the past three years; for MAFC the<br />
rather sharp increase from 2007/08 (Tshs 74 million) to Tshs 160 million in 2008 ( an increase<br />
of about 116 %) was largely due to requirement of purchasing more <strong>and</strong> more input subsidy<br />
to the small scale, poor farmers. But overall there has been quite a bit of increase in all the<br />
ASLMs since 2007/08. Now with the global melt down the is possibility GDP growth might<br />
decline <strong>and</strong> may seriously affect local resources for having such high level recurrent budget. It<br />
is thus time for, not just ASLMs, but all other ministries to tighten belt <strong>and</strong> push more<br />
resources into the development budget. There was a good sign by the government wanting to<br />
tread along this line when it decided to keep on hold purchase of cars for its executives, <strong>and</strong><br />
instead it went to put the saved money into purchase of power tillers for the poor small scale<br />
farmers. Therefore ASLMS <strong>and</strong> indeed the Government would be well advised to increase<br />
(what is called in Economics) Propensity to Save (as against Propensity to Consume).<br />
143
ANNEXES<br />
Annex es Group 1: Analytical Tables for PER<br />
Table X2: Vote 43 Budget composition <strong>and</strong> trends (TZS)<br />
Budget 2006/07 2007/2008 2008/2009 2009/10<br />
Development 45,812,449,600 60,061,912,600 20,032,832,400 92,694,254,000<br />
Recurrent 77,280,932,000 74,753,052,979 143,498,218,358 160,870,333,000<br />
Total 123,093,381,600 134,814,965,579 163,531,050,758 253,564,587,000<br />
Percentage<br />
Development as % of<br />
total 37.22 44.55 12.25 36.56<br />
Recurrent as % of total 62.78 55.45 87.75 63.44<br />
Table X3. Vote 43 Composition of development budget (TZS)<br />
2006/07 2007/2008 2008/2009 2009/10<br />
Local 8,353,994,000 6,756,000,000 2,516,709,000 2,516,709,000<br />
Foreign 37,458,455,600 53,305,912,600 17,516,123,400 90,177,545,000<br />
45,812,449,600 60,061,912,600 20,032,832,400 92,694,254,000<br />
Percentage<br />
% of local 18.24 11.25 12.56 2.72<br />
% of foreign 81.76 88.75 87.44 97.28<br />
Table X4. Analysis of Vote 43 Recurrent budget (TZS)<br />
2006/07 2007/08 2008/09 2009/10<br />
PE 8,311,715,900 11,812,398,874 14,744,084,965 14,875,219,465<br />
OC 68,962,216,100 123,002,566,705 148,786,965,793 145,995,113,535<br />
Total 77,273,932,000 134,814,965,579 163,531,050,758 160,870,333,000<br />
Percentage<br />
PE as %of total 10.76 8.76 9.02 9.25<br />
OC as % of total 89.24 91.24 90.98 90.75<br />
144
Table X5: Vote 99 Budget composition <strong>and</strong> trends (TZS)<br />
Budget 2006/07 2007/2008 2008/2009 2009/10<br />
Development 9,914,660,000 9,776,000,000 12,378,682,000 18,728,627,000<br />
Recurrent 14,136,749,000 12,621,516,000 24,078,614,200 31,441,286,140<br />
Total 24,051,409,000 22,397,516,000 36,457,296,200 50,169,913,140<br />
Percentage<br />
Development as % of<br />
total 41.22278242 43.64769736 33.95392223 37.33039551<br />
Recurrent as % of total 58.77721758 56.35230264 66.04607777 62.66960449<br />
Table X6: Vote 99 Composition of development budget (TZS)<br />
2006/07 2007/2008 2008/2009 2009/10<br />
Local 1,699,998,000 1,424,000,000 673,810,000 8,363,686,000<br />
Foreign 8,214,662,000 8,352,000,000 5,654,872,000 10,364,941,000<br />
Total 9,914,660,000 9,776,000,000 6,328,682,000 18,728,627,000<br />
Percentage<br />
% of local 17.14630658 14.56628478 10.64692459 44.65722981<br />
% of foreign 82.85369342 85.43371522 89.35307541 55.34277019<br />
X7: Analysis of Vote 99 Recurrent budget (TZS)<br />
2006/07 2007/08 2008/09 2009/10<br />
PE 4,300,869,000 5,690,184,000 6,116,291,300 7,937,164,040<br />
OC 9,835,880,000 6,931,332,000 17,970,322,900 21,149,769,000<br />
Total 14,136,749,000 12,621,516,000 24,086,614,200 29,086,933,040<br />
Percentage<br />
PE as %of total 30.42332434 45.08320554 25.39290599 27.28773099<br />
OC as % of total 69.57667566 54.91679446 74.60709401 72.71226901<br />
145
Table X8: Vote 49 Budget composition <strong>and</strong> trends (TZS)<br />
Budget 2006/07 2007/2008 2008/2009 2009/10<br />
147,340,127,900 224,990,752,600 139,954,882,700 245,656,445,000<br />
Development<br />
22,562,164,000 13,427,915,000 16,288,212,000 19,277,172,000<br />
Recurrent<br />
169,902,291,900 238,418,667,600 156,243,094,700 264,933,617,000<br />
Total<br />
Percentage<br />
Development<br />
as % of total 86.8 94.4 89.6 92.7<br />
Recurrent as<br />
% of total 13.2 5.6 10.4 7.3<br />
Table X9: Vote 49 Composition of development budget (TZS)<br />
2006/07 2007/2008 2008/2009 2009/10<br />
77,864,995,000 70,754,004,000 46,463,394,000 50,463,379,000<br />
Local<br />
69,475,132,900 154,236,748,600 93,491,488,700 195,193,066,000<br />
Foreign<br />
Total 147,340,127,900 224,990,752,600 139,954,882,700 245,656,445,000<br />
Percentage<br />
% of local 52.8 31.4 33.2 20.5<br />
% of foreign 47.2 68.6 66.8 79.5<br />
Table X10: Analysis of Vote 49 Recurrent budget (TZS)<br />
2006/07 2007/08 2008/09 2009/10<br />
PE 5,770,564,000 4,662,389,000 6,722,686,000 9,711,638,000<br />
OC 16,791,600,000 8,765,526,000 11,325,893,608 9,565,534,000<br />
Total 22,562,164,000 13,427,915,000 18,048,579,608 19,277,172,000<br />
Percentage<br />
PE as %of total 25.6 34.7 37.3 50.4<br />
OC as % of total 74.4 65.3 62.7 49.6<br />
146
ANNEXES Group 2 for ASR<br />
Annex 1:<br />
Coffee Sales Volume by Association of Kilimanjaro Speciality Coffee Growers - At<br />
Local Auctions <strong>and</strong> on the Export Market<br />
Table: Kc 1: AKSCG Coffee Volume marketed 2004/05 to 2008/09 - At local auctions <strong>and</strong> at Export market<br />
AKSCG Coffee<br />
Years<br />
Sales Volume<br />
(Kgs)<br />
2004/05 2005/06 2006/07 2007/08 2008/09<br />
• At local 1,782,357 1,070,899 1,200,000 1,314,423 3,019,834<br />
auctions<br />
• At export<br />
market<br />
181,267 210,058 528,117 598,753 1,111,859<br />
• Total 1,963,624 1,280,957 1,648,117 1,913,176 4,131,693<br />
Table: Kc 2: AKSCG Coffee Value marketed 2004/05 to 2008/09 - At local auctions <strong>and</strong> at Export market<br />
AKSCG Coffee Sales<br />
Years<br />
Value<br />
(US $<br />
2004/05 2005/06 2006/07 2007/08 2008/09<br />
• At local 1,819,650 1,925,679 1,958,294 1,261,340 2,643,976<br />
auctions<br />
• At export<br />
market<br />
308,013 521,910 1,428,312 2,107,776 4,160,108<br />
• Total 2,127,663 2,447,589 3,383,606 3,369,116 6,804,084<br />
147
Annex 2:<br />
Some Coo<strong>per</strong>ative Societies that combine both production <strong>and</strong> marketing:<br />
Primary Coo<strong>per</strong>ative Societies that are members of Ilulu Coopetative Union , Lindi Region<br />
Namba<br />
1. KILWA DISTRICT<br />
Jina la Chama cha Msingi<br />
1 Tapwa AMCOS<br />
2 P<strong>and</strong>e AMCOS<br />
3 Umoja AMCOS<br />
4 Ulina AMCOS<br />
5<br />
Ujirani mwema AMCOS<br />
6 Sisi kwa sisi Amcos<br />
7 Naki Amcos<br />
8 Ukombozi Amcos<br />
8<br />
LINDI RURAL<br />
1 Ng’apa AMCOS<br />
2 Rutamba AMCOS<br />
3 Milola AMCOS<br />
4 Rondo AMCOS<br />
5 Mtua AMCOS<br />
6 Mtama AMCOS<br />
7 Nyangao AMCOS<br />
Nyangamara AMCOS<br />
10 Nachunyu AMCOS<br />
11 Sudi/Madangwa AMCOS<br />
12 Mnolela AMCOS<br />
13<br />
M/mmoja AMCOS<br />
14 Kiwalala AMCOS<br />
15 Mchinga AMCOS<br />
148
Annex 3:<br />
Some of People Contacted/ Visited (<strong>and</strong> Respective Sites Visited)<br />
<strong>Agriculture</strong> Line Ministries (ASLMs)<br />
MAFC<br />
1. E.A. Achayo - Director Policy <strong>and</strong> Panning, MAFC<br />
2. Dr. J. Mngodo - Director, National <strong>Food</strong> Security<br />
2. Charles Wambura - M&E <strong>Of</strong>ficer<br />
Dr. N.M. Msolla - Assistant Director, Inputs<br />
3. Happiness Mlaki -- Chief Facilitator ASDP Programme<br />
3. D. M. Biswalo - Planning <strong>Of</strong>ficer<br />
4. L. Lemweli Ombaeli - Statistician, National <strong>Food</strong> Security<br />
MLDF<br />
1. Nsiame Raymond - Economist<br />
2. Mr. D.A. Rwezaura - Livestock <strong>Of</strong>ficer<br />
MWI<br />
Norman Andrew<br />
- Economist<br />
KOROGWE DISTRICT<br />
DISTRICT LEVEL - DISTRICT OFFICIALS<br />
1. John Mjema - DED<br />
2. John Mbelwa - DSMS, Livestock<br />
3. Sije Lebi - District Subject Matter Specialist -Statistics<br />
4. Grace Shoo - District Subject Matter Specialist - Crops<br />
5. Charles Kweka - DSMS, Irrigation<br />
6. Menus Ch<strong>and</strong>ika - Ag, District coo<strong>per</strong>ative officer<br />
7. Besta Nyerenda - District Trade <strong>Of</strong>ficer<br />
8. Isaria Siao - Community development <strong>Of</strong>ficer(CDO)<br />
9. Lusina Raymond - (CDO)<br />
10. Hamza Musa - Trader (produce buyer & seller)<br />
11. Rashidi Sefu - Trader (produce buyer & seller)<br />
12. Shelukindo Mkufya - Inputs Trader<br />
KWEMAZANDU VILLAGE<br />
1. Paulina Waida - Village Executive <strong>Of</strong>ficer - Farmer<br />
2. Halui Abubakar - Farmer<br />
3. Rajabu Bakari - Farmer/ Trader<br />
4. Hassan Saidi - Farmer/ Trader<br />
5. Mwanaidi Sabuni - Farmer<br />
6. Zaina Rajabu - Farmer<br />
7. Hadija Hamisi - Farmer/ Trader<br />
MOMBO VILLAGE, KOROGWE DISTRICT<br />
149
1. Shufaa - Mh<strong>and</strong>o - Farmer<br />
2. Dismas Dinstan - Farmer<br />
3. Hadija Asumani - Farmer<br />
4. Sefu Makao - Farmer/ Trader<br />
5. Hadija Ismail - Farmer/ Trader<br />
MERU DISTRICT<br />
1. Grace Solomon - DALDO<br />
2. Asha Ali - District Extension <strong>Of</strong>ficer<br />
3. Amani A. Sanga - District Veterinary <strong>Of</strong>ficer<br />
4. Digna Masawe - Agricultural Extension <strong>Of</strong>ficer<br />
5. Kitambi S. Mihambo - District Irrigation <strong>Of</strong>ficer<br />
NATIONAL ARTIFICIAL INSEMINATION CENTRE<br />
1. Dr. Charles Makundi - Director<br />
2. Mr. Philbert Barongo - Technician, Semen Processing<br />
3. Thomas Mbeyela - Assistant Farm Manager<br />
MOSHI RURAL DISTRICT<br />
1. Ms. Lilian T. Matinga - DED<br />
2. Mr. Uraru Lyatuu - Ag. DALDO<br />
3. Ms. Ester Mbatiani - District Planning <strong>Of</strong>ficer<br />
5. Mr. Morad Kunambi - District Community Development <strong>Of</strong>ficer<br />
6. A. Angela - Community Development <strong>Of</strong>ficer<br />
7. Matias Kihiyo - Mechanization <strong>Of</strong>ficer<br />
8. Evans Mdoe - District Treasurer<br />
MOSHI MUNICIPAL<br />
KILI-CAFE<br />
1. Peter Minja - Internal Auditor & Data manager<br />
2. Maximillan Noel - Data <strong>Of</strong>ficer<br />
Yohana Makisoe - Data <strong>Of</strong>ficer<br />
KATC<br />
1. Adam G. Pyuza - Principal KATC<br />
2. Eng. Meregesi - Deputy Principal, KATC<br />
IMPUT TRADER - Tanganyika Farmers Association, Moshi, Arusha, Dar es Salaam<br />
MIWALENI VILLAGE, MOSHI RURAL<br />
1. Hassan Kidaya - Farmer<br />
2. Ambrose Kundi - Farmer/ Trader<br />
3. Juma Tembe - Pump Attendant & Farmer<br />
4. Sadik Paul - Farmer<br />
5. Amani Fidelis - Farmer/ Trader<br />
150
KILOMBERO DISTRICT<br />
1. Dr Kitambi - DALDO<br />
2. Mr. D. Nguga - Livestock <strong>Of</strong>ficer<br />
3. Ms. H. Ngapunya - SMS Crops<br />
4. Mr. H. Liguguda - SMS Irrigation<br />
5. Mr. Lukuringe Seuta - Coo<strong>per</strong>ative <strong>Of</strong>ficer<br />
MKula Village Irrigation Scheme<br />
1. Mr. John T. Kamuhambas - Scheme Member , Chairman<br />
2. Mrs Yahya - Scheme Member<br />
3. Mrs. Zainab Lingwala - Scheme Member<br />
MBEYA RURAL DISTRICT<br />
INYALA VILLAGE/ IRRIGATION SCHEME<br />
1. Mr. Wilbald M.Mwansamale - Chairman, Inyala Village<br />
2. Mr. Abel Maganga - Secretary, Inyala Village Irrigation Scheme<br />
3. Ms. Eda P. Nswila - Village Executive <strong>Of</strong>ficer (VEO)<br />
4 Mr. Obedi M<strong>and</strong>amenda - Irrigation Scheme Member<br />
5. Mrs Teresia Mwayalo - Irrigation Scheme Member<br />
6. Mrs Anjelina Nkala - Irrigation Scheme Member<br />
7. Mr. Ezekieli Panja - Irrigation Scheme Member<br />
8. Mr. Wilbald Stanslaus - Irrigation Scheme Member<br />
9. Mr. Mwadindi Mwansamale - Irrigation Scheme Member<br />
MWANZA REGION<br />
1. Mr. Boahara - Board Director, Cotton Board<br />
2. Mr. Swai - Cotton Inspector, Mwanza<br />
3. Mr. Hygila - Ginnery Inspector, Mwanza<br />
4. Mr. Chipolo - Accountant Mwanza<br />
5. Mr, Elia Mwalusaka - Fund Manager, Cotton Development Trust Fund (CGTF)<br />
6. Peter Kapinga - Zonal Director , Ukiriguru Research Institute<br />
7. Mrs. H. Mboyerwa - DASIP, Mwanza<br />
MARA REGION<br />
1. Mr. Sassi - RAA, Mara<br />
MUSOMA DISTRICT<br />
1. Dr. Urasa - DALDO, Musoma<br />
2. Mr. Magoti - Crop <strong>Of</strong>ficer, Musoma<br />
RORYA DISTRICT<br />
1. Mr. Jacob Kayanga - DED, Rorya<br />
151
Annex 4:<br />
References<br />
1. United Republic of Tanzania (URT) - <strong>Ministry</strong> of Planning, Economy <strong>and</strong><br />
Empowerment. MKKUKUTA Monitoring Master Plan <strong>and</strong> Indicator Information. Dar es<br />
Salaam. December 2006<br />
2. Millennium Development Goals (MDGs). Internet<br />
3. Agricultural Sector Development Strategy (ASDS). 2001. MAFC. Dae es Salam. 2001<br />
4. Agricultural Sector Development Programme (ASDP). MAFC. Dar es Salaam. 2006.<br />
5. AGSTAT for <strong>Food</strong> Security. The 2007/08 Preliminary <strong>Food</strong> Crop Production Forecast<br />
for 2008/09 <strong>Food</strong> Security. Volume 1. Dar es Salaam. January 2009.<br />
6. National Water Sector Development Strategy; 2006 to 2015. MWI. Dar es Salaam<br />
7. PADEP, Report on ‘Schemes; summary <strong>and</strong> details – (District, scheme/ owner <strong>and</strong><br />
status. Dar es Salaam. 2008.<br />
8. URT - - <strong>Ministry</strong> of Planning, Economy <strong>and</strong> Empowerment. MKKUKUTA Monitoring<br />
System. Dar es Salaam. December 2007.<br />
9. Caroline van den Berg et.al. Tanzania Public Expenditure Review of the Water Sector.<br />
September 2009.<br />
10. KILI-CAFÉ. The KILI_CAFE Value Chain <strong>and</strong> its Impact on Tanzania Smallholders -<br />
presented at the Coffee Sector Stakeholders Roundtable (sponsored by Ufadhili Trust ) -<br />
Nairobi, Kenya. 2008.<br />
11. Association of Kilimanjaro Speciality Coffee Growers Ltd. Annual Coffee Sales Value<br />
Analysis - 2004/05 to 2009/10<br />
12. The National Irrigation Master Plan – Main Report . MWI. Dar es Salaam. 2002<br />
13. Kilimanjaro Agricultural Training Centre (KATC), <strong>Ministry</strong> of <strong>Agriculture</strong> <strong>Food</strong><br />
security <strong>and</strong> Coo<strong>per</strong>atives. Final Report for Kilimanjaro Agricultural Training Centre.<br />
September 2006.<br />
14. Traditional Irrigation <strong>and</strong> Environmental Development Organization (TIP).<br />
Documentation of TIP Achievements in Partner Districts - Jan 2000 to July 2006.<br />
Monitoring <strong>and</strong> Evaluation Unit TIP. 2006<br />
15. PEDEP Report on ‘Scheme summary <strong>and</strong> details - )District schemes; owner <strong>and</strong> status)<br />
16. Microfinance Gateway > Global Economic Meltdown. November 2008. The Internet.<br />
17. ‘Madhara ya Msukosuko wa Masoko ya Fedha ya Kimataifa kwenye Mifugo na Uvuvi.<br />
Wizara ya Maendeleo ya Mifugo na Uvuvi’. Dar es Salaam. 2009.<br />
18. DPC Tanzania. Tanzania Joint Program Document. Dar es Salaam. 2006.<br />
19. Ten Years of the Tanzania Special Programme for <strong>Food</strong> Security. FAO. Dar es Salaam.<br />
2008<br />
20. National Water Sector Development Strategy . <strong>Ministry</strong> of Water - 2006 to 2015. Dar es<br />
Salaam<br />
21. URT -<strong>Ministry</strong> of Water <strong>and</strong> Irrigation. Water Sector Status Report 2009. Dar es Salaam.<br />
September 2009.<br />
22. URT. High Level Conference on Water for <strong>Agriculture</strong> an d Energy in Africa: Challenges<br />
for Climate Change, Sirte Libya Arab Jamahiriya, 15 th – 17 th December 2008 - National<br />
Investment Brief. The Internet<br />
23. <strong>Ministry</strong> of Water: National Water Sector Development Strategy - 2006-2015. Dar es<br />
Salaam.<br />
24. AGSTAT for <strong>Food</strong> Security. The 2008/09 Preliminary <strong>Food</strong> Crop Production Forecast<br />
for 2009/10 <strong>Food</strong> Security. Volume 1. Dar es Salaam. June 2009<br />
152
25. Agricultural Sector Review <strong>and</strong> Public Expenditure Review 2008/09. MAFC. Dar es<br />
Salaam. 2008<br />
26. MAFC Annual Plan. 2008/09<br />
27. <strong>Ministry</strong> of Livestock Development <strong>and</strong> Fisheries. Livestock Inputs for Agricultural<br />
Sector Review <strong>and</strong> Public Expenditure Review 2008/09. Dar es Salaam<br />
28. PMO- RALG. Annual DADP Progress Report 2008/09 - Summary<br />
29. URT. ASDP Integrated Work-plan <strong>and</strong> Budget FY 2009/10 (National <strong>and</strong> Local Level<br />
Components). June. 2009<br />
30. MAFC. International Financial Crisis: <strong>Agriculture</strong> Sector Perspective. Dar es Salaam.<br />
2009<br />
31. Tanzania Horticulture - TAHA (Tanzania Horticultural Association - various reports on<br />
the Internet<br />
32. Tanzania: Global Crisis Hits Flower Industry. Africa News. 30/11/2009. Internet<br />
33. Tanzania: Global downtown turns round to be fortune for local textile sector -Textile.<br />
30/11/2009. Internet<br />
34. URT - Statistics Unit, <strong>Ministry</strong> of <strong>Agriculture</strong> <strong>and</strong> <strong>Food</strong> Security: <strong>and</strong> National Bureau<br />
of Statistics. Rapid Appraisal Agricultural Survey - 1999/2000. Dar es Salam. 2001<br />
35. . URT - Research <strong>and</strong> Analysis Technical Working group of the MKUKUTA Monitoring<br />
System, <strong>Ministry</strong> of Planning Economy <strong>and</strong> Empowerment. Poverty at the District Level<br />
in Mainl<strong>and</strong> - Brief 2: Poverty <strong>and</strong> Human Development n Report . 2005. The Internet<br />
36. Opcit Breef4. Realising Water’s Potential to Support Growth in Tanzania.2007<br />
37. Irrigation Development in Tanzania; Draft Final Report – WG2. <strong>Ministry</strong> of Water. Dar<br />
es Salaam. 2004.<br />
38. O<strong>per</strong>eshenyi Fanya Mkoa wa Morogoro Kuwa Ghala la Taifa (FAMOGATA)- 2007/08 to<br />
2009/10. [translated as, ‘a programme for turning Morogoro Region into the national (food)<br />
warehouse’]. Morogoro Regional <strong>Of</strong>fice. Morogoro. 2007<br />
39. <strong>Ministry</strong> of Water. Rapid Water Resource Assessment (RWRA). <strong>Ministry</strong> of Water. Dar<br />
es Salaam. 1994<br />
40. National Sample Census of <strong>Agriculture</strong> 2002/2003 Small Holder farmers, Vol 11: Crop<br />
Sector.<br />
41. MAFC agricultural inputs (fertilizer) <strong>and</strong> monitoring documents/reports.<br />
42. MAFC other agricultural production <strong>and</strong> marketing documents/ reports<br />
43. Districts profiles - from districts visited.<br />
44. URT. General Budget Support Annual Review 2007 - Information Pack<br />
45. WP - 152: The Cut-flower Industry in Tanzania - sectoral activities. The Internet<br />
46. Free World Maps. Physical Map of Tanzania. 15 th November 2009.<br />
153
Annex5: Study instruments - Checklists<br />
MINISTRY OF AGRICULTURE FOOD SECURITY AND COOPERATIVES (MAFC)<br />
STUDY ON: AGRICULTURE REVIEW & PUBLIC EXPENDITURE REVIEW<br />
CHECKLIST 1: Targeted to Sub-sector Ministries <strong>Of</strong>fices National Level<br />
ISSUES TO ADDRESS:<br />
Issue 1: Sectoral (policy <strong>and</strong> Regulatory Framework) <strong>and</strong> Sub-sectoral (crop, livestock,<br />
irrigation, marketing) Performance since 2006<br />
_____________________________________________________________________________________________________________________<br />
INFORMATION<br />
REQUIRED<br />
SPECIFIC DATA REQUIRED<br />
A) Crops & Livestock Production/ productivity:<br />
SOURCE OF DATA<br />
SECONDARY PRIMARY<br />
PESPONSIBLE ENTITY - for<br />
collecting the data<br />
1. Economic Growth<br />
data for whole<br />
agricultural sector <strong>and</strong><br />
individual sub-sectors<br />
1. List of all crops <strong>and</strong> respective yearly acreages <strong>and</strong> total<br />
production <strong>and</strong> yield/ ha <strong>per</strong> season <strong>and</strong> <strong>per</strong> year under rain-fed<br />
& under irrigated for past 3 years (2006/07, 2007/08 & 2008/09)<br />
- national level.<br />
2. List of all crops <strong>and</strong> respective yearly total processed crop<br />
commodities, <strong>and</strong> average outturn for past 3 years (2006/07,<br />
2007/08 & 2008/09) - national level<br />
3. List of beef livestock <strong>and</strong> respective total production<br />
(numbers <strong>and</strong> average weight, & also sales) for past 3 years<br />
(2006/07, 2007/08 & 2008/09) - national level.<br />
- MAFC DPP office (via counterpart<br />
staff)<br />
- MAFC DPP office (via counterpart<br />
staff)MAFC<br />
- MLDF - DPP office (via counterpart<br />
staff)<br />
154
INFORMATION<br />
REQUIRED<br />
SPECIFIC DATA REQUIRED<br />
4. List of all beef livestock <strong>and</strong> respective yearly processed<br />
commodities volume <strong>and</strong> sales for past 3 years ((2006/07, 2007/08 &<br />
2008/09) - national level.<br />
5. List of dairy livestock <strong>and</strong> respective production numbers & also<br />
sales, for past 3 years ((2006/07, 2007/08 & 2008/09) - national level.<br />
6. List of all dairy livestock <strong>and</strong> respective yearly processed<br />
commodities (separate products)volume <strong>and</strong> sales for past 3 years<br />
((2006/07, 2007/08 & 2008/09) - national level.<br />
B. Irrigation:<br />
1. List of large scale irrigation projects <strong>and</strong> respective irrigable areas<br />
<strong>and</strong> actually irrigated, <strong>and</strong> total production volume <strong>and</strong> yields/ ha/<br />
season <strong>and</strong> <strong>per</strong> year for past 3 years (2006/07, 2007/08 & 2008/09) -<br />
national level.<br />
2. List of small scale irrigation projects <strong>and</strong> respective irrigable areas<br />
<strong>and</strong> actually irrigated, <strong>and</strong> total production volume <strong>per</strong> named crop<br />
<strong>and</strong> average yields/ ha/ season <strong>and</strong> <strong>per</strong> year for each crop; for past 3<br />
years (2006/07, 2007/08 & 2008/09) - national level.<br />
3. List of small scale irrigation schemes/ projects <strong>and</strong> respective<br />
actually irrigated area <strong>and</strong> number of farmers <strong>and</strong> also households<br />
actively undertaking irrigation in there; as well as average irrigated<br />
farm size <strong>per</strong> household <strong>and</strong> <strong>per</strong> farmer; for past 3 years (2006/07,<br />
2007/08 & 2008/09) - national level.<br />
SOURCE OF DATA<br />
SECONDARY PRIMARY<br />
PESPONSIBLE ENTITY - for<br />
collecting the data<br />
- MLDF - DPP office (via counterpart<br />
staff)<br />
- MLDF -- DPP office (via counterpart<br />
staff)<br />
- MLDF - DPP office (via counterpart<br />
staff)<br />
-<br />
- MWI – - DPP office (via counterpart<br />
staff)<br />
- MWI - DPP office (via counterpart<br />
staff)<br />
- MWI - DPP office (via counterpart<br />
staff)<br />
155
INFORMATION<br />
REQUIRED<br />
SPECIFIC DATA REQUIRED<br />
C. Crop Inputs supply<br />
a) Fertilizer (as a whole) type <strong>and</strong> total dem<strong>and</strong>ed, total supplied<br />
<strong>and</strong> actual purchases by farmers; in 2006/07, 2007/08 & 2008/09<br />
for:<br />
SOURCE OF DATA<br />
SECONDARY PRIMARY<br />
PESPONSIBLE ENTITY -<br />
collecting the data<br />
- MAFC Director of Inputs - DPP office<br />
(via counterpart staff)<br />
• Urea,CAN, DAP, NPKs, TSP - MAFC Director of Inputs - DPP office<br />
(via counterpart staff)<br />
-<br />
b) Subsidized Fertilizer total dem<strong>and</strong>ed, total supplied <strong>and</strong> actual<br />
purchases by farmers; in 2006/07, 2007/08 & 2008/09 for:<br />
- MAFC Director of Inputs - DPP office<br />
(via counterpart staff)<br />
• Urea, CAN, DAP, NPKs, TSP - MAFC Director of Inputs - DPP office<br />
(via counterpart staff)<br />
c) Crop insecticides (as a whole) type <strong>and</strong> total dem<strong>and</strong>ed, total<br />
supplied <strong>and</strong> actual purchases by farmers; in 2006/07, 2007/08 &<br />
2008/09<br />
-<br />
- MAFC Director of Inputs - DPP office<br />
(via counterpart staff)<br />
for<br />
d) Subsidized crop insecticides type <strong>and</strong> total dem<strong>and</strong>ed, total<br />
supplied <strong>and</strong> actual purchases by farmers; in 2006/07, 2007/08 &<br />
2008/09<br />
e) Crop fungicides (as a whole) type <strong>and</strong> total dem<strong>and</strong>ed, total<br />
supplied <strong>and</strong> actual purchases by farmers; in 2006/07, 2007/08 &<br />
2008/09<br />
f) Subsidized crop fungicides type <strong>and</strong> total dem<strong>and</strong>ed, total<br />
supplied <strong>and</strong> actual purchases by farmers; in 2006/07, 2007/08 &<br />
2008/09<br />
- MAFC Director of Inputs - DPP office<br />
(via counterpart staff)<br />
- MAFC Director of Inputs - DPP office<br />
(via counterpart staff)<br />
- MAFC Director of Inputs - DPP office<br />
(via counterpart staff)<br />
-<br />
- MAFC Director of Inputs - DPP office<br />
(via counterpart staff)<br />
156
INFORMATION<br />
REQUIRED<br />
SPECIFIC DATA REQUIRED<br />
g) Crop herbicides (as a whole) type <strong>and</strong> total dem<strong>and</strong>ed, total<br />
supplied <strong>and</strong> actual purchases by farmers; in 2006/07, 2007/08 &<br />
2008/09<br />
h) Subsidized crop herbicides type <strong>and</strong> total dem<strong>and</strong>ed, total supplied<br />
<strong>and</strong> actual purchases by farmers; in 2006/07, 2007/08 & 2008/09<br />
i) Crop seed <strong>and</strong> seedlings (as a whole) type <strong>and</strong> total dem<strong>and</strong>ed,<br />
total supplied <strong>and</strong> actual purchases by farmers; in 2006/07, 2007/08 &<br />
2008/09<br />
j) Subsidized Crop seed <strong>and</strong> seedlings type <strong>and</strong> total dem<strong>and</strong>ed, total<br />
supplied <strong>and</strong> actual purchases by farmers; in 2006/07, 2007/08 &<br />
2008/09<br />
k) Crop Nematocides (as a whole) type <strong>and</strong> total dem<strong>and</strong>ed, total<br />
supplied <strong>and</strong> actual purchases by farmers; in 2006/07, 2007/08 &<br />
2008/09<br />
l) Subsidized crop nematocides type <strong>and</strong> total dem<strong>and</strong>ed, total<br />
supplied <strong>and</strong> actual purchases by farmers; in 2006/07, 2007/08 &<br />
2008/09<br />
m) Crop farming equipment (as a whole) type <strong>and</strong> total dem<strong>and</strong>ed,<br />
total supplied <strong>and</strong> actual purchases by farmers; in 2006/07, 2007/08 &<br />
2008/09<br />
n) Subsidized Crop farming equipment type <strong>and</strong> total dem<strong>and</strong>ed,<br />
total supplied <strong>and</strong> actual purchases by farmers; in 2006/07, 2007/08 &<br />
2008/09<br />
SOURCE OF DATA<br />
SECONDARY PRIMARY<br />
PESPONSIBLE ENTITY -<br />
for collecting the data<br />
- MAFC Director of Inputs - DPP<br />
office (via counterpart staff)<br />
-<br />
- MAFC Director of Inputs - DPP<br />
office (via counterpart staff)<br />
-<br />
- MAFC Director of Inputs - DPP<br />
office (via counterpart staff)<br />
- MAFC Director of Inputs - DPP<br />
office (via counterpart staff)<br />
MAFC Director of Inputs - DPP<br />
office (via counterpart staff)<br />
- MAFC Director of Inputs - DPP<br />
office (via counterpart staff)<br />
-<br />
- MAFC – Mechanization Unit -<br />
(via counterpart staff)<br />
- MAFC – Mechanization Unit -<br />
(via counterpart staff)<br />
157
INFORMATION<br />
REQUIRED<br />
SPECIFIC DATA REQUIRED<br />
C. Livestock Inputs supply<br />
a) Livestock insecticides (as a whole) type <strong>and</strong> total dem<strong>and</strong>ed,<br />
total supplied <strong>and</strong> actual purchases by farmers; in 2006/07,<br />
2007/08 & 2008/09<br />
b) Subsidized Livestock insecticides type <strong>and</strong> total dem<strong>and</strong>ed,<br />
total supplied <strong>and</strong> actual purchases by farmers; in 2006/07,<br />
2007/08 & 2008/09<br />
c) Crop fungicides (as a whole) type <strong>and</strong> total dem<strong>and</strong>ed, total<br />
supplied <strong>and</strong> actual purchases by farmers; in 2006/07, 2007/08 &<br />
2008/09<br />
d) Subsidized livestock fungicides type <strong>and</strong> total dem<strong>and</strong>ed,<br />
total supplied <strong>and</strong> actual purchases by farmers; in 2006/07,<br />
2007/08 & 2008/09<br />
e) Livestock acaricides (as a whole) type <strong>and</strong> total dem<strong>and</strong>ed,<br />
total supplied <strong>and</strong> actual purchases by farmers; in 2006/07,<br />
2007/08 & 2008/09<br />
f) Subsidized livestock acaricides type <strong>and</strong> total dem<strong>and</strong>ed, total<br />
supplied <strong>and</strong> actual purchases by farmers; in 2006/07, 2007/08 &<br />
2008/09<br />
g) Pasture seed (as a whole) type <strong>and</strong> total dem<strong>and</strong>ed, total<br />
supplied <strong>and</strong> actual purchases by farmers; in 2006/07, 2007/08 &<br />
2008/09<br />
SOURCE OF DATA<br />
SECONDARY PRIMARY<br />
PESPONSIBLE ENTITY<br />
- for collecting the data<br />
- MLDF - DPP office (via<br />
counterpart staff)<br />
- MLDF - DPP office (via<br />
counterpart staff)<br />
- MLDF - DPP office (via<br />
counterpart staff)<br />
- MLDF - DPP office (via<br />
counterpart staff)<br />
- MLDF - DPP office (via<br />
counterpart staff)<br />
- MLDF - DPP office (via<br />
counterpart staff)<br />
- MLDF -- DPP office (via<br />
counterpart staff)<br />
INFORMATION<br />
REQUIRED<br />
SPECIFIC DATA REQUIRED<br />
SOURCE OF DATA<br />
SECONDARY PRIMARY<br />
PESPONSIBLE ENTITY - for<br />
collecting the data<br />
158
C. Crop Inputs supply<br />
h) Subsidized pasture seed type <strong>and</strong> total dem<strong>and</strong>ed, total<br />
supplied <strong>and</strong> actual purchases by farmers; in 2006/07, 2007/08 &<br />
2008/09<br />
i) Livestock production equipment (as a whole) type <strong>and</strong> total<br />
dem<strong>and</strong>ed, total supplied <strong>and</strong> actual purchases by farmers; in<br />
2006/07, 2007/08 & 2008/09<br />
j) Subsidized livestock production equipment type <strong>and</strong> total<br />
dem<strong>and</strong>ed, total supplied <strong>and</strong> actual purchases by farmers; in<br />
2006/07, 2007/08 & 2008/09<br />
D. Business Competition<br />
<br />
MLDF -- DPP office (via counterpart<br />
staff)<br />
MLDF -- DPP office (via counterpart<br />
staff)<br />
<br />
MLDF -- DPP office (via counterpart<br />
staff)<br />
<br />
INFORMATION<br />
REQUIRED<br />
a)Number of suppliers of each fertilizer types for years 2006/07,<br />
2007.08, 2008/09<br />
b) Number of suppliers of each of the insecticide types you have<br />
mentioned for years 2006/07, 2007.08, 2008/09<br />
c) Number of suppliers of each of the fungicide types you have<br />
mentioned for years 2006/07, 2007.08, 2008/09<br />
d) Number of suppliers of each of the herbicides types you have<br />
mentioned for years 2006/07, 2007.08, 2008/09<br />
e) Number of suppliers of each of the crop farming <strong>and</strong> livestock<br />
production equipment types you have mentioned for years 2006/07,<br />
2007.08, 2008/09<br />
SPECIFIC DATA REQUIRED<br />
f)Number of licensed district level distributors of each of the<br />
fertilizers pesticides, seeds <strong>and</strong> equipment you have mentioned<br />
above<br />
MAFC Director of Inputs (via<br />
counterpart staff)<br />
MAFC Director of Inputs (via<br />
counterpart staff)<br />
MAFC Director of Inputs (via<br />
counterpart staff)<br />
MAFC Director of Inputs (via<br />
counterpart staff)<br />
MAFC – Mechanization Unit - (via<br />
counterpart staff)<br />
SOURCE OF DATA<br />
SECONDARY PRIMARY<br />
PESPONSIBLE ENTITY<br />
- for collecting the data<br />
- MAFC Director of Inputs<br />
(via counterpart staff)<br />
159
g) Number of registered/ licensed major exporters of each of the<br />
various crop <strong>and</strong> livestock commodities you have mentioned<br />
above<br />
g) Number of small scale registered/ licensed major exporters of<br />
each of the various crop <strong>and</strong> livestock commodities you have<br />
mentioned above<br />
- MITM/ MAFC Coo<strong>per</strong>ative<br />
Dept<br />
(via counterpart staff)<br />
- MITM/ MAFC Coo<strong>per</strong>ative<br />
Dept<br />
(via counterpart staff)<br />
2. Sector growth<br />
data<br />
a) Total volume <strong>and</strong> value of crop sales on domestic market - MITM/ MAFC Coo<strong>per</strong>ative<br />
Dept<br />
(via counterpart staff)<br />
b) Total volume <strong>and</strong> value of crop sales on the export market - MITM/ MAFC Coo<strong>per</strong>ative<br />
Dept<br />
(via counterpart staff)<br />
160
Issue 2: District Agricultural Development Plans (DADPs) formulation, planning <strong>and</strong><br />
implementation since 2006<br />
_____________________________________________________________________________________________________________________<br />
INFORMATION<br />
REQUIRED<br />
SPECIFIC DATA REQUIRED<br />
1. DAPDs status 1. List of all initiated DADPs nationally over the past 3<br />
years ((2006/07, 2007/08 & 2008/09)<br />
2. List of all formulated DADPs nationally over the past<br />
three (3) years ((2006/07, 2007/08 & 2008/09)<br />
3. List of all implemented DADPs nationally over the<br />
past three (3) years ((2006/07, 2007/08 & 2008/09)<br />
4. Number of women, <strong>and</strong> men (separately) that have<br />
been direct beneficiaries of each of DADP projects/<br />
programme for past (3) years (2006/07, 2007/08 &<br />
2008/09)<br />
SOURCE OF DATA<br />
PESPONSIBLE<br />
SECONDARY PRIMARY ENTITY - for<br />
collecting the data+<br />
- MAFC - DPP<br />
<strong>Of</strong>fice (via<br />
counterpart staff)<br />
- MAFC - DPP<br />
<strong>Of</strong>fice (via<br />
counterpart staff)<br />
- MAFC - DPP<br />
<strong>Of</strong>fice (via<br />
counterpart staff)<br />
- MAFC - DPP<br />
<strong>Of</strong>fice (via<br />
counterpart staff)<br />
161
Issue 3: Effects of the current global economic meltdownon agricultural <strong>per</strong>formance<br />
_____________________________________________________________________________________________________________________<br />
INFORMATION<br />
REQUIRED<br />
SPECIFIC DATA REQUIRED<br />
1. Financial & physical 1.1: Tanzania shilling exchange rate against that of<br />
currencies of those of major input supplying countries (to<br />
Tanzania) over the past 3 years(2006/07, 2007/08 &<br />
2008/09)<br />
1.2 Volume <strong>and</strong> value of each agricultural import over<br />
the past 3 years(2006/07, 2007/08 & 2008/09)<br />
1.3 Volume <strong>and</strong> value of each of agricultural exports<br />
over the past 3 years(2006/07, 2007/08 & 2008/09)<br />
1.4 CIF price changes on each of major agricultural<br />
imports over the past 3 years(2006/07, 2007/08 & 2008/09)<br />
1.5 Cost of major services to agricultural sector<br />
(especially fuel/ power, transport <strong>and</strong> credit/ loans )<br />
over the past 3 years(2006/07, 2007/08 & 2008/09)<br />
1.6 Reaction of producers <strong>and</strong> other players at the crop<br />
<strong>and</strong> livestock commodity chain on the <strong>per</strong>ceived global<br />
changes for (2006/07, 2007/08 & 2008/09)<br />
1.7; Trend of investment (especially DFI) into the sector<br />
over the past 3 years(2006/07, 2007/08 & 2008/09)<br />
SOURCE OF DATA<br />
SECONDARY PRIMARY<br />
- -MoFE<br />
- BOT<br />
PESPONSIBLE<br />
ENTITY - for<br />
collecting the data<br />
- -MoFE - TRA<br />
- -MoFE - TRA<br />
- -MoFE - TRA<br />
- MAFC –DPP<br />
office; TCCIA<br />
- District councils<br />
- TIC<br />
Issue 4: Relevance of ASDP M&E Framework <strong>and</strong> shortlisted indicators for assessing the<br />
<strong>per</strong>formance of the programme<br />
162
_____________________________________________________________________________________________________________________<br />
INFORMATION SPECIFIC DATA REQUIRED<br />
SOURCE OF DATA<br />
REQUIRED<br />
SECONDARY PRIMARY<br />
1.ASDP programme /<br />
framework<br />
PESPONSIBLE ENTITY<br />
- for collecting the data<br />
1.1: ASDP components MAFC – ASDP (via<br />
counterpart staff)<br />
1.2 ASDP activities for implementation under each component via counterpart staff)<br />
1.2 ASDP result areas via counterpart staff)<br />
1.4 Current ASDP indicators via counterpart staff)<br />
Issue 5: Performance of the sector in ensuring food security<br />
INFORMATION<br />
REQUIRED<br />
1. National food<br />
requirement<br />
versus supply<br />
SPECIFIC DATA REQUIRED<br />
1.1: Annual production of major food grains for the past 3 years(2006/07,<br />
2007/08 & 2008/09)<br />
SOURCE OF DATA<br />
SECONDARY PRIMARY<br />
<br />
<br />
PESPONSIBLE ENTITY<br />
- for collecting the data<br />
National Grain Reserve<br />
Agency (NGRA)<br />
1.2 <strong>Food</strong> storage capacity for the past 3 years(2006/07, 2007/08 & 2008/09) Director <strong>Food</strong> Security;<br />
NGRA<br />
1.3: Annual production of other food staples for the past 3 years(2006/07, Director <strong>Food</strong> Security<br />
2007/08 & 2008/09)<br />
1.4 Annual grain reserves for the past 3 years(2006/07, 2007/08 & 2008/09) NGRA<br />
1.5 Level of activities for processing/ preservation of bananas, tubers <strong>and</strong> Director <strong>Food</strong> Security<br />
also fruits <strong>and</strong> vegetables to lengthen shelf life <strong>and</strong> while preserving<br />
quality<br />
1.6 Activities of the early warning system for the past 3 years(2006/07,<br />
2007/08 & 2008/09)<br />
Director <strong>Food</strong> Security<br />
Issue 6: Status of implementation of the recommendations made in the 2008/09 ASR/PER<br />
The issues raised were:<br />
- Capacity needs of extension staff<br />
- <strong>Agriculture</strong> financing<br />
163
- Production costs<br />
- Mechanization, technology transfer <strong>and</strong> resources to transform agriculture sector<br />
The 3 rd issue here is well captured in the checklists. The other issues will be subject of further discussion between consultant <strong>and</strong> client <strong>and</strong> the<br />
<strong>Ministry</strong> of Finance <strong>and</strong> Economy & Tanzania Investment Centre <strong>and</strong> the Tanzania Investment Bank<br />
164
Public Expenditure Review<br />
Issue 1: Public Sector planning resource allocation, expenditure <strong>and</strong> financial management<br />
INFORMATION<br />
REQUIRED<br />
SPECIFIC DATA REQUIRED<br />
SOURCE OF DATA<br />
SECONDARY PRIMARY<br />
PESPONSIBLE<br />
ENTITY - for<br />
collecting the data<br />
1. Budgets <strong>and</strong><br />
Disbursements<br />
1.1: Sectoral budget requirements; by sub-sector for the past 3<br />
years(2006/07, 2007/08 & 2008/09)<br />
- Sub-sector<br />
Ministries DPPs<br />
(via counterpart<br />
staff)<br />
1.2 MTEEF - Sub-sector<br />
Ministries DPPs<br />
(via counterpart<br />
1.3 Sectoral approved budget for the past 3 years(2006/07,<br />
2007/08 & 2008/09)<br />
1.4 Funds disbursement to Sector; by sub-sector for the past 3<br />
years(2006/07, 2007/08 & 2008/09)<br />
1.5 Funds expenditure for sector for the past 3 years (2006/07,<br />
2007/08 & 2008/09)<br />
staff)<br />
- Sub-sector<br />
Ministries DPPs<br />
(via counterpart<br />
staff)<br />
- Sub-sector<br />
Ministries DPPs<br />
(via counterpart<br />
staff)<br />
- Sub-sector<br />
Ministries DPPs<br />
(via counterpart<br />
staff)<br />
165
Issue 1: Value for money in the smart agricultural inputs subsidy<br />
INFORMATION<br />
REQUIRED<br />
1. Budgets <strong>and</strong><br />
Disbursements<br />
SPECIFIC DATA REQUIRED SOURCE OF DATA PESPONSIBLE<br />
ENTITY - for<br />
collecting the data<br />
SECONDARY PRIMARY<br />
1.1: Inputs budget requirements for Sector by sub-sector for<br />
- Sub-sector<br />
the past 3 years(2006/07, 2007/08 & 2008/09)<br />
Ministries inputs<br />
Directors (via<br />
counterpart staff)<br />
1.2 MTEEF - MAFC – DPP<br />
office (via<br />
1.3 Inputs approved budget for the sector for past 3 years<br />
(2006/07, 2007/08 & 2008/09)<br />
1.4 Funds disbursement to Sector; by sub-sector for the past 3<br />
years (2006/07, 2007/08 & 2008/09)<br />
1.5 Input Funds expenditure for sector; by sub-sector for the<br />
past 3 years (2006/07, 2007/08 & 2008/09)<br />
counterpart staff)<br />
- Sub-sector<br />
Ministries inputs<br />
Directors (via<br />
counterpart staff)<br />
- Sub-sector<br />
Ministries inputs<br />
Directors (via<br />
counterpart staff)<br />
- Sub-sector<br />
Ministries inputs<br />
Directors (via<br />
counterpart staff)<br />
166
Annex 5: Study instruments - Checklists<br />
MINISTRY OF AGRICULTURE FOOD SECURITY AND COOPERATIVES (MAFC)<br />
STUDY ON: AGRICULTURE REVIEW & PUBLIC EXPENDITURE REVIEW<br />
CHECKLIST 2: Targeted to Districts <strong>and</strong> communities<br />
ISSUES TO ADDRESS:<br />
Issue 1: Sectoral (policy <strong>and</strong> Regulatory Framework) <strong>and</strong> Sub-sectoral (crop, livestock,<br />
irrigation, marketing) Performance since 2006<br />
_____________________________________________________________________________________________________________________<br />
INFORMATION<br />
REQUIRED<br />
1. Economic Growth data<br />
for whole agricultural<br />
sector <strong>and</strong> individual<br />
sub-sectors<br />
SPECIFIC DATA REQUIRED<br />
B) Crops & Livestock Production/ productivity:<br />
1. List of all crops <strong>and</strong> respective yearly acreages <strong>and</strong> total<br />
production <strong>and</strong> yield/ ha <strong>per</strong> season <strong>and</strong> <strong>per</strong> year under rain-fed &<br />
under irrigated for past 3 years (2006/07, 2007/08 & 2008/09)<br />
-District Village level<br />
2. List of all crops <strong>and</strong> respective yearly total processed crop<br />
commodities, <strong>and</strong> average outturn for past 3 years (2006/07,<br />
2007/08 & 2008/09) - District level<br />
3. List of beef livestock <strong>and</strong> respective total production (numbers<br />
<strong>and</strong> average weight, & also sales) for past 3 years (2006/07,<br />
2007/08 & 2008/09) - District level<br />
SOURCE OF DATA<br />
SECONDARY PRIMARY<br />
PESPONSIBLE<br />
ENTITY - for<br />
collecting the data<br />
District Council/ Villages<br />
consultant team<br />
District Council/<br />
villages/ consultant team<br />
District Council/<br />
villages/consultant team<br />
167
INFORMATION<br />
REQUIRED<br />
SPECIFIC DATA REQUIRED<br />
4. List of all beef livestock <strong>and</strong> respective yearly processed commodities<br />
volume <strong>and</strong> sales for past 3 years ((2006/07, 2007/08 & 2008/09) - District<br />
Village level.<br />
5. List of dairy livestock <strong>and</strong> respective production numbers & also sales,<br />
for past 3 years ((2006/07, 2007/08 & 2008/09) - District Village level.<br />
6. List of all dairy livestock <strong>and</strong> respective yearly processed commodities<br />
(separate products)volume <strong>and</strong> sales for past 3 years ((2006/07, 2007/08 &<br />
2008/09) - District Village level.<br />
B. Irrigation:<br />
1. List of large scale irrigation projects <strong>and</strong> respective irrigable areas <strong>and</strong><br />
actually irrigated, <strong>and</strong> total production volume <strong>and</strong> yields/ ha/ season<br />
<strong>and</strong> <strong>per</strong> year for past 3 years (2006/07, 2007/08 & 2008/09) - District<br />
Village level.<br />
2. List of small scale irrigation projects <strong>and</strong> respective irrigable areas <strong>and</strong><br />
actually irrigated, <strong>and</strong> total production volume <strong>per</strong> named crop <strong>and</strong><br />
average yields/ ha/ season <strong>and</strong> <strong>per</strong> year for each crop; for past 3 years<br />
(2006/07, 2007/08 & 2008/09) - District Village level.<br />
3. List of small scale irrigation schemes/ projects <strong>and</strong> respective actually<br />
irrigated area <strong>and</strong> number of farmers <strong>and</strong> also households actively<br />
undertaking irrigation in there; as well as average irrigated farm size <strong>per</strong><br />
household <strong>and</strong> <strong>per</strong> farmer; for past 3 years (2006/07, 2007/08 & 2008/09) -<br />
District Village level.<br />
SOURCE OF DATA<br />
SECONDARY PRIMARY<br />
PESPONSIBLE<br />
ENTITY - for collecting<br />
the data<br />
District Council/<br />
villages/consultant team<br />
District Council/<br />
villages/consultant team<br />
District Council/<br />
villages/consultant team<br />
-<br />
District Council/<br />
consultant team<br />
District Council/<br />
villages/consultant team<br />
District Council/<br />
villages/consultant team<br />
INFORMATION<br />
REQUIRED<br />
SPECIFIC DATA REQUIRED<br />
SOURCE OF DATA<br />
SECONDARY PRIMARY<br />
PESPONSIBLE ENTITY<br />
- for collecting the data<br />
168
C. Crop Inputs supply<br />
a) Fertilizer (as a whole) type <strong>and</strong> total dem<strong>and</strong>ed, total supplied <strong>and</strong><br />
actual purchases by farmers; in 2006/07, 2007/08 & 2008/09 for:<br />
District level<br />
District Council/<br />
villages/consultant team<br />
• Urea,CAN, DAP, NPKs, TSP District Council/<br />
villages/consultant team<br />
b) Subsidized Fertilizer total dem<strong>and</strong>ed, total supplied <strong>and</strong> actual District Council/<br />
purchases by farmers; in 2006/07, 2007/08 & 2008/09 for: District level<br />
villages/consultant team<br />
• Urea, CAN, DAP, NPKs, TSP District Council/<br />
villages/consultant team<br />
c) Crop insecticides (as a whole) type <strong>and</strong> total dem<strong>and</strong>ed, total<br />
supplied <strong>and</strong> actual purchases by farmers; in 2006/07, 2007/08 &<br />
2008/09 - District level<br />
d) Subsidized crop insecticides type <strong>and</strong> total dem<strong>and</strong>ed, total<br />
supplied <strong>and</strong> actual purchases by farmers; in 2006/07, 2007/08 &<br />
2008/09 - District level<br />
e) Crop fungicides (as a whole) type <strong>and</strong> total dem<strong>and</strong>ed, total<br />
supplied <strong>and</strong> actual purchases by farmers; in 2006/07, 2007/08 &<br />
2008/09 - District level<br />
f) Subsidized crop fungicides type <strong>and</strong> total dem<strong>and</strong>ed, total supplied<br />
<strong>and</strong> actual purchases by farmers; in 2006/07, 2007/08 & 2008/09 -<br />
District level<br />
District Council/<br />
villages/consultant team<br />
District Council/<br />
villages/consultant team<br />
District Council/<br />
villages/consultant team<br />
- District Council/<br />
villages/consultant team<br />
INFORMATION<br />
REQUIRED<br />
SPECIFIC DATA REQUIRED<br />
g) Crop herbicides (as a whole) type <strong>and</strong> total dem<strong>and</strong>ed, total<br />
supplied <strong>and</strong> actual purchases by farmers; in 2006/07, 2007/08 &<br />
2008/09<br />
SOURCE OF DATA<br />
SECONDARY PRIMARY<br />
PESPONSIBLE ENTITY<br />
- for collecting the data<br />
District Council/<br />
villages/consultant team<br />
169
h) Subsidized crop herbicides type <strong>and</strong> total dem<strong>and</strong>ed, total<br />
supplied <strong>and</strong> actual purchases by farmers; in 2006/07, 2007/08 &<br />
2008/09<br />
i) Crop seed <strong>and</strong> seedlings (as a whole) type <strong>and</strong> total dem<strong>and</strong>ed,<br />
total supplied <strong>and</strong> actual purchases by farmers; in 2006/07,<br />
2007/08 & 2008/09<br />
j) Subsidized Crop seed <strong>and</strong> seedlings type <strong>and</strong> total dem<strong>and</strong>ed,<br />
total supplied <strong>and</strong> actual purchases by farmers; in 2006/07,<br />
2007/08 & 2008/09<br />
k) Crop Nematocides (as a whole) type <strong>and</strong> total dem<strong>and</strong>ed,<br />
total supplied <strong>and</strong> actual purchases by farmers; in 2006/07,<br />
2007/08 & 2008/09<br />
l) Subsidized crop nematocides type <strong>and</strong> total dem<strong>and</strong>ed, total<br />
supplied <strong>and</strong> actual purchases by farmers; in 2006/07, 2007/08 &<br />
2008/09<br />
m) Crop farming equipment (as a whole) type <strong>and</strong> total<br />
dem<strong>and</strong>ed, total supplied <strong>and</strong> actual purchases by farmers; in<br />
2006/07, 2007/08 & 2008/09<br />
n) Subsidized Crop farming equipment type <strong>and</strong> total dem<strong>and</strong>ed,<br />
total supplied <strong>and</strong> actual purchases by farmers; in 2006/07,<br />
2007/08 & 2008/09<br />
District Council/<br />
villages/consultant team<br />
District Council/<br />
villages/consultant team<br />
District Council/<br />
villages/consultant team<br />
<br />
District Council/<br />
villages/consultant team<br />
District Council/<br />
villages/consultant team<br />
District Council/<br />
villages/consultant team<br />
District Council/<br />
villages/consultant team<br />
INFORMATION<br />
REQUIRED<br />
SPECIFIC DATA REQUIRED<br />
C. Livestock Inputs supply<br />
a) Livestock insecticides (as a whole) type <strong>and</strong> total dem<strong>and</strong>ed,<br />
total supplied <strong>and</strong> actual purchases by farmers; in 2006/07,<br />
2007/08 & 2008/09<br />
SOURCE OF DATA<br />
SECONDARY PRIMARY<br />
PESPONSIBLE ENTITY<br />
- for collecting the data<br />
District Council/<br />
villages/consultant team<br />
b) Subsidized Livestock insecticides type <strong>and</strong> total dem<strong>and</strong>ed, District Council/<br />
170
total supplied <strong>and</strong> actual purchases by farmers; in 2006/07,<br />
2007/08 & 2008/09<br />
c) Crop fungicides (as a whole) type <strong>and</strong> total dem<strong>and</strong>ed, total<br />
supplied <strong>and</strong> actual purchases by farmers; in 2006/07, 2007/08 &<br />
2008/09<br />
d) Subsidized livestock fungicides type <strong>and</strong> total dem<strong>and</strong>ed,<br />
total supplied <strong>and</strong> actual purchases by farmers; in 2006/07,<br />
2007/08 & 2008/09<br />
e) Livestock acaricides (as a whole) type <strong>and</strong> total dem<strong>and</strong>ed,<br />
total supplied <strong>and</strong> actual purchases by farmers; in 2006/07,<br />
2007/08 & 2008/09<br />
f) Subsidized livestock acaricides type <strong>and</strong> total dem<strong>and</strong>ed, total<br />
supplied <strong>and</strong> actual purchases by farmers; in 2006/07, 2007/08 &<br />
2008/09<br />
g) Pasture seed (as a whole) type <strong>and</strong> total dem<strong>and</strong>ed, total<br />
supplied <strong>and</strong> actual purchases by farmers; in 2006/07, 2007/08 &<br />
2008/09<br />
villages/consultant team<br />
District Council/<br />
villages/consultant team<br />
District Council/<br />
villages/consultant team<br />
District Council/<br />
villages/consultant team<br />
District Council/<br />
villages/consultant team<br />
District Council/<br />
villages/consultant team<br />
INFORMATION<br />
REQUIRED<br />
SPECIFIC DATA REQUIRED<br />
C. Crop Inputs supply<br />
h) Subsidized pasture seed type <strong>and</strong> total dem<strong>and</strong>ed, total<br />
supplied <strong>and</strong> actual purchases by farmers; in 2006/07, 2007/08 &<br />
SOURCE OF DATA<br />
SECONDARY PRIMARY<br />
PESPONSIBLE ENTITY<br />
- for collecting the data<br />
District Council/<br />
villages/consultant team<br />
2008/09<br />
i) Livestock production equipment (as a whole) type <strong>and</strong> total District Council/<br />
dem<strong>and</strong>ed, total supplied <strong>and</strong> actual purchases by farmers; in<br />
villages/consultant team<br />
2006/07, 2007/08 & 2008/09<br />
<br />
j) Subsidized livestock production equipment type <strong>and</strong> total District Council/<br />
171
dem<strong>and</strong>ed, total supplied <strong>and</strong> actual purchases by farmers; in<br />
2006/07, 2007/08 & 2008/09<br />
villages/consultant team<br />
D. Business Competition<br />
a)Number of suppliers of each fertilizer types for years 2006/07,<br />
2007.08, 2008/09<br />
b) Number of suppliers of each of the insecticide types you have<br />
mentioned for years 2006/07, 2007.08, 2008/09<br />
c) Number of suppliers of each of the fungicide types you have<br />
mentioned for years 2006/07, 2007.08, 2008/09<br />
d) Number of suppliers of each of the herbicides types you have<br />
mentioned for years 2006/07, 2007.08, 2008/09<br />
e) Number of suppliers of each of the crop farming <strong>and</strong> livestock<br />
production equipment types you have mentioned for years<br />
2006/07, 2007.08, 2008/09<br />
f)Number of licensed district level distributors of each of the<br />
fertilizers pesticides, seeds <strong>and</strong> equipment you have mentioned<br />
above<br />
District Council/ consultant<br />
team<br />
District Council/ consultant<br />
team<br />
District Council /consultant<br />
team<br />
District Council /consultant<br />
team<br />
District Council/ consultant<br />
team<br />
District Council/ consultant<br />
team<br />
2. Sector growth<br />
data<br />
g) Number of registered/ licensed major exporters of each of the<br />
various crop <strong>and</strong> livestock commodities you have mentioned<br />
above<br />
g) Number of small scale registered/ licensed major exporters of<br />
each of the various crop <strong>and</strong> livestock commodities you have<br />
mentioned above<br />
District Council/ consultant<br />
team<br />
<br />
District Council/ consultant<br />
team<br />
a) Total volume <strong>and</strong> value of crop sales on domestic market District Council/ consultant<br />
team<br />
b) Total volume <strong>and</strong> value of crop sales on the export market MITM/ MAFC Coo<strong>per</strong>ative<br />
Dept<br />
(via counterpart staff)<br />
172
Issue 2: District Agricultural Development Plans (DADPs) formulation, planning <strong>and</strong><br />
implementation since 2006<br />
__________________________________________________________________________________________________________________<br />
INFORMATION SPECIFIC DATA REQUIRED<br />
SOURCE OF DATA PESPONSIBLE<br />
REQUIRED<br />
SECONDARY PRIMARY ENTITY - for<br />
collecting the data<br />
1. DAPDs status 1. List of all initiated DADPs nationally over the past 3 years ((2006/07, 2007/08<br />
District Council/<br />
& 2008/09)<br />
consultant<br />
2. List of all formulated DADPs nationally over the past three (3) years ((2006/07,<br />
2007/08 & 2008/09)<br />
3. List of all implemented DADPs nationally over the past three (3) years<br />
((2006/07, 2007/08 & 2008/09)<br />
4. Number of women, <strong>and</strong> men (separately) that have been direct beneficiaries of<br />
each of DADP projects/ programme for past (3) years (2006/07, 2007/08 & 2008/09)<br />
District Council/<br />
consultant<br />
District Council/<br />
consultant<br />
District Council/<br />
consultant<br />
Issue 3: Effects of the current global economic meltdownon agricultural <strong>per</strong>formance<br />
_____________________________________________________________________________________________________________________<br />
INFORMATION<br />
REQUIRED<br />
SPECIFIC DATA REQUIRED<br />
1.1 CIF price changes on each of major agricultural imports over the past 3<br />
years(2006/07, 2007/08 & 2008/09)<br />
1.2 Cost of major services to agricultural sector (especially fuel/ power, transport<br />
<strong>and</strong> credit/ loans ) over the past 3 years(2006/07, 2007/08 & 2008/09)<br />
1.4; Trend of investment (especially DFI) into the sector over the past 3<br />
years(2006/07, 2007/08 & 2008/09)<br />
SOURCE OF DATA<br />
SECONDARY PRIMARY<br />
PESPONSIBLE<br />
ENTITY - for<br />
collecting the data<br />
District Council/<br />
consultant<br />
District Council/<br />
consultant<br />
District Council/<br />
consultant<br />
173
Issue 4: Performance of the sector in ensuring food security<br />
INFORMATION<br />
REQUIRED<br />
1. National food<br />
requirement versus<br />
supply<br />
SPECIFIC DATA REQUIRED<br />
1.1: Annual production of major food grains for the past 3<br />
years(2006/07, 2007/08 & 2008/09)<br />
1.2 <strong>Food</strong> storage capacity for the past 3 years(2006/07, 2007/08 &<br />
2008/09)<br />
1.3: Annual production of other food staples for the past 3<br />
years(2006/07, 2007/08 & 2008/09)<br />
1.4 Annual grain reserves for the past 3 years(2006/07, 2007/08 &<br />
2008/09)<br />
1.5 Level of activities for processing/ preservation of bananas,<br />
tubers <strong>and</strong> also fruits <strong>and</strong> vegetables to lengthen shelf life <strong>and</strong><br />
while preserving quality<br />
1.6 Activities of the early warning system for the past 3<br />
years(2006/07, 2007/08 & 2008/09)<br />
SOURCE OF DATA<br />
SECONDARY PRIMARY<br />
<br />
<br />
<br />
PESPONSIBLE<br />
ENTITY - for<br />
collecting the data<br />
District Council/<br />
village/consultant<br />
District Council/<br />
village/consultant<br />
District Council/<br />
village<br />
/consultant<br />
District Council/<br />
village<br />
/consultant<br />
District Council/<br />
village<br />
/consultant<br />
District Council/<br />
village<br />
/consultant<br />
174
ATTACHMENT 1: CROP PRODUCTION: Years 2006/07 to 2008/09<br />
Village name: …………………………………. in Ward ……………………………… in Region<br />
…………………………………<br />
Year Crop Average<br />
farm<br />
size<br />
under<br />
Crop:<br />
Acres)<br />
Individual crop<br />
production from<br />
this farm size<br />
Unit Volume Amount<br />
(unit?<br />
Seed / seedlings<br />
used at planting<br />
on the average<br />
farm size<br />
Cost<br />
(Shs / ---<br />
-----?<br />
Type<br />
1.<br />
Fertilizer used on the average C’ nut farm size<br />
Amount<br />
kg<br />
Type<br />
2<br />
Amount<br />
kg<br />
Type<br />
3.<br />
Amount<br />
kg<br />
Pesticides applied on the average<br />
farm size<br />
Type<br />
1.<br />
Amount<br />
kg<br />
Type<br />
2<br />
Amount<br />
Kg/<br />
litre<br />
Extension<br />
service<br />
provision<br />
(very<br />
ample,<br />
ample,<br />
average,<br />
little, nil)<br />
Farming<br />
equipment<br />
used in<br />
cultivation<br />
/ planting,<br />
weeding<br />
Support &<br />
level<br />
provided<br />
by the<br />
District<br />
Council<br />
2006/07<br />
2007/08<br />
2008/09<br />
175
ATTACHMENT 2: CROP SELLING/MARKETING: Years 2006/07 to 2008/09<br />
Village name: …………………………………. in Ward …………………in Region ……………………<br />
Crop-<br />
Year<br />
2006/07<br />
Name<br />
of<br />
Crop<br />
Average<br />
Farm<br />
size<br />
(Acres)<br />
Average crop harvested<br />
on this Farm Size <strong>per</strong><br />
respective year<br />
Unit of<br />
measure<br />
Amount<br />
(Volume)<br />
Within<br />
1 st<br />
month<br />
after<br />
harvest<br />
Price<br />
(Tshs<br />
<strong>per</strong><br />
:kg)<br />
Where<br />
sold<br />
Average amount of crop sold <strong>per</strong> household/family in:<br />
In the<br />
2 -3<br />
Month<br />
from<br />
her-vest<br />
Price<br />
(Tshs<br />
<strong>per</strong><br />
kg)<br />
Where<br />
sold<br />
4 -6<br />
Mon<br />
later<br />
Price<br />
(Tshs<br />
<strong>per</strong>:kg)<br />
Where<br />
sold<br />
7 -9<br />
Mon<br />
later<br />
Price<br />
(Tsh<br />
<strong>per</strong>:<br />
kg)<br />
Whe<br />
-re<br />
sold<br />
10-<br />
12<br />
Mon<br />
later<br />
Price<br />
(Tsh<br />
<strong>per</strong><br />
kg)<br />
Where<br />
sold<br />
Crop lost<br />
(Bags @ -<br />
--------kg)<br />
Crop in<br />
HHstore<br />
at year<br />
end -<br />
(Bags<br />
@--- kg<br />
2007/08<br />
2008/09<br />
176
ATTACHMENT 3: CROP INPUTS COSTS: Years 2006]07 to 2008/09<br />
Site: Village ……………… Ward ……………………………District …………………Region…………<br />
Year Average Prices of Fertilizer Average Prices of Pesticides Average Prices of the crops seeds / seedlings<br />
2006/07<br />
Type 1<br />
Tshs/<br />
<strong>per</strong><br />
50kg<br />
bag<br />
Type 2<br />
Tshs <strong>per</strong><br />
50kgbag<br />
Type 3<br />
Tshs <strong>per</strong><br />
50kg bag<br />
Type 1<br />
Tshs/<br />
<strong>per</strong><br />
unit?<br />
Type 2<br />
Tshs<br />
<strong>per</strong><br />
unit?<br />
Type 3<br />
Tshs<br />
<strong>per</strong><br />
unit?<br />
Improved<br />
Type 1<br />
Tshs/<br />
<strong>per</strong><br />
piece<br />
Improved<br />
Type 2<br />
Tshs/<br />
<strong>per</strong><br />
piece<br />
Local<br />
type<br />
Tshs/ <strong>per</strong><br />
piece<br />
2007/08<br />
2008/09<br />
ATTACHMENT 4: FARMING EQUIPMENT COST: Years 2006/07 to 2008/09<br />
Site: Village …………Ward……………………District……………Region ……………………………<br />
Year Average cost of various Equipment Average cost of tractor hire for Average cost of labour hire for: Average cost for<br />
2006/07<br />
2007/08<br />
Oxplough<br />
(Tshs<br />
<strong>per</strong><br />
piece)<br />
H<strong>and</strong><br />
hoe<br />
(Tshs<br />
<strong>per</strong><br />
piece)<br />
Oxen<br />
pair<br />
(Tshs<br />
<strong>per</strong><br />
pair)<br />
H<strong>and</strong><br />
Spray<br />
pump<br />
(Tshs<br />
<strong>per</strong><br />
piece)<br />
Motorized<br />
spray pump<br />
(Tshs <strong>per</strong><br />
piece)<br />
Ploughing<br />
(Tshs /<br />
acre<br />
Harrowing<br />
(Tshs /<br />
acre<br />
Weeding<br />
(Tshs /<br />
acre<br />
Transporting<br />
(Tshs / <strong>per</strong><br />
trailer or?<br />
Cultivating<br />
(shs/<br />
acre)<br />
Planting<br />
(shs / acre)<br />
Weeding<br />
(shs/<br />
acre)<br />
Harvesting<br />
(Shs <strong>per</strong><br />
…..?<br />
Pump hire<br />
Motorised<br />
Sprayer<br />
(Shs/ ….?<br />
H<strong>and</strong><br />
sprayer<br />
(Shs /<br />
…….?<br />
2008/09<br />
177
178