Article - matpost 2003
Article - matpost 2003
Article - matpost 2003

You also want an ePaper? Increase the reach of your titles
YUMPU automatically turns print PDFs into web optimized ePapers that Google loves.
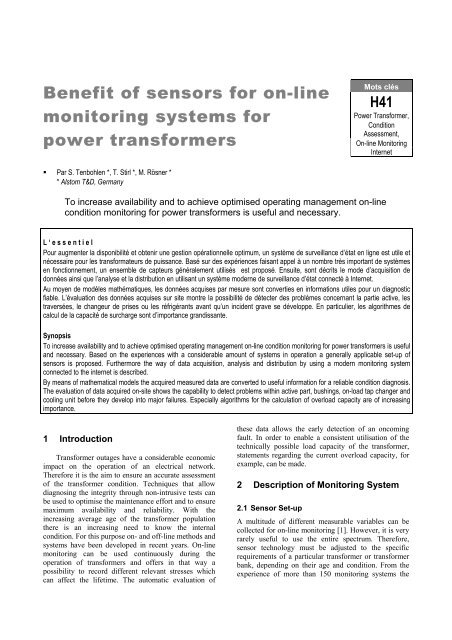
Benefit of sensors for on-line<br />
monitoring systems for<br />
power transformers<br />
Mots clés<br />
H41<br />
Power Transformer,<br />
Condition<br />
Assessment,<br />
On-line Monitoring<br />
Internet<br />
• Par S. Tenbohlen *, T. Stirl *, M. Rösner *<br />
* Alstom T&D, Germany<br />
To increase availability and to achieve optimised operating management on-line<br />
condition monitoring for power transformers is useful and necessary.<br />
L ‘ E S S E N T I E L<br />
L ‘ e s s e n t i e l<br />
Pour augmenter la disponibilité et obtenir une gestion opérationnelle optimum, un système de surveillance d’état en ligne est utile et<br />
nécessaire pour les transformateurs de puissance. Basé sur des expériences faisant appel à un nombre très important de systèmes<br />
en fonctionnement, un ensemble de capteurs généralement utilisés est proposé. Ensuite, sont décrits le mode d’acquisition de<br />
données ainsi que l’analyse et la distribution en utilisant un système moderne de surveillance d’état connecté à Internet.<br />
Au moyen de modèles mathématiques, les données acquises par mesure sont converties en informations utiles pour un diagnostic<br />
fiable. L’évaluation des données acquises sur site montre la possibilité de détecter des problèmes concernant la partie active, les<br />
traversées, le changeur de prises ou les réfrigérants avant qu’un incident grave se développe. En particulier, les algorithmes de<br />
calcul de la capacité de surcharge sont d’importance grandissante.<br />
Synopsis<br />
To increase availability and to achieve optimised operating management on-line condition monitoring for power transformers is useful<br />
and necessary. Based on the experiences with a considerable amount of systems in operation a generally applicable set-up of<br />
sensors is proposed. Furthermore the way of data acquisition, analysis and distribution by using a modern monitoring system<br />
connected to the internet is described.<br />
By means of mathematical models the acquired measured data are converted to useful information for a reliable condition diagnosis.<br />
The evaluation of data acquired on-site shows the capability to detect problems within active part, bushings, on-load tap changer and<br />
cooling unit before they develop into major failures. Especially algorithms for the calculation of overload capacity are of increasing<br />
importance.<br />
1 Introduction<br />
Transformer outages have a considerable economic<br />
impact on the operation of an electrical network.<br />
Therefore it is the aim to ensure an accurate assessment<br />
of the transformer condition. Techniques that allow<br />
diagnosing the integrity through non-intrusive tests can<br />
be used to optimise the maintenance effort and to ensure<br />
maximum availability and reliability. With the<br />
increasing average age of the transformer population<br />
there is an increasing need to know the internal<br />
condition. For this purpose on- and off-line methods and<br />
systems have been developed in recent years. On-line<br />
monitoring can be used continuously during the<br />
operation of transformers and offers in that way a<br />
possibility to record different relevant stresses which<br />
can affect the lifetime. The automatic evaluation of<br />
these data allows the early detection of an oncoming<br />
fault. In order to enable a consistent utilisation of the<br />
technically possible load capacity of the transformer,<br />
statements regarding the current overload capacity, for<br />
example, can be made.<br />
2 Description of Monitoring System<br />
2.1 Sensor Set-up<br />
A multitude of different measurable variables can be<br />
collected for on-line monitoring [1]. However, it is very<br />
rarely useful to use the entire spectrum. Therefore,<br />
sensor technology must be adjusted to the specific<br />
requirements of a particular transformer or transformer<br />
bank, depending on their age and condition. From the<br />
experience of more than 150 monitoring systems the
following general set-up of sensors for example is<br />
proposed for the use at a 400 kV power transformer:<br />
• PT100 for measurement of top oil temperature<br />
• PT100 for measurement of ambient temperature<br />
• C.T. for measurement of load current (single phase)<br />
• Measurement of voltage at measurement tap of<br />
bushing (three phase)<br />
• Measurement of oil pressure of bushing<br />
• Sensor for measurement of oil humidity<br />
• Sensor for measurement of gas-in-oil content<br />
• Tap changer position<br />
• Power consumption of motor drive<br />
• Digital inputs for switching status of fans and<br />
pumps<br />
2.2 Architecture<br />
With the Alstom monitoring system MS 2000 the<br />
outputs of the above mentioned sensors are wired onto<br />
field bus terminals in the monitoring module installed at<br />
the transformer. Within these data acquisition units the<br />
analogue signals are digitised and send via a field bus to<br />
the monitoring server. By means of this industrial<br />
proven technology it is possible to monitor all<br />
transformers in one substation with a single system<br />
which is extremely cost effective. The erection of the<br />
server in an operating building offers the advantage that<br />
the ambient conditions (e.g. temperature, vibrations) are<br />
much more suitable for a PC. The connection to the<br />
protection and control system can be done either by dry<br />
relay contacts or a digital protocol according to IEC<br />
60870-5-101 [1,2].<br />
The user expects from a monitoring system an easy and<br />
safe access to all necessary information about the<br />
installed electrical equipment. This means not only<br />
power transformers, also GIS, circuit breakers,<br />
disconnectors are of fundamental importance [3]. The<br />
dispatching centre should be informed about loading<br />
capacity (overload calculation). The operation and<br />
maintenance department should perform condition<br />
assessment and plan maintenance procedures exactly<br />
(Fig. 1).<br />
This wide distribution of information can be done by a<br />
web-based solution. An additional module installed on<br />
the monitoring server allows to generate HTML-based<br />
web pages, which show both on-line and historical data<br />
(Fig. 2). If the monitoring server is connected to the<br />
local area network (Intranet) of the utility, all<br />
departments will receive the necessary information.<br />
Therefore the number of users directly connected to the<br />
monitoring server is practically unlimited. Password<br />
protection gives only specific users the right of data<br />
access. By use of a firewall it is also possible to have<br />
access to the complete substation by use of the Internet.<br />
2.3 Distribution and visualisation of monitoring<br />
data<br />
In order to prevent outages and save maintenance<br />
expenditures on-line monitoring systems are installed at<br />
the main equipment of the substation (power<br />
transformers, circuit breaker, disconnectors). The access<br />
to the monitoring data should be done by means of a<br />
standardised platform which is the Internet Explorer.<br />
This prevents that on each desktop PC individual<br />
software has to be installed.<br />
Fig. 1:<br />
Data access by use of the Internet<br />
Fig. 2:<br />
Web-based visualisation of transformer condition<br />
3 Practical Experience<br />
The begin of on-line monitoring was characterised<br />
by the use of some individual sensors which were<br />
dedicated to monitor only a small part of the power<br />
transformer. For example a hydrogen sensor is used to<br />
detect problems within the active part such as partial<br />
discharges or hot spots. The philosophy of concentration<br />
on a specific part of the transformer was forced by the<br />
individual experience of specific failures within an<br />
utility. This means if a utility experienced problems<br />
with bushings, the main efforts were related to the<br />
diagnostic of bushings.<br />
But the analysis of reasons for failures of a larger<br />
population of transformers than these of a single utility<br />
showed that majors failures occur in all parts of the<br />
transformer [16]. So the wish of having a<br />
comprehensive system which not only monitors the<br />
active part but also other important and failure reluctant
components such as on-load tap changer and bushings is<br />
understandable. During the last years the monitoring<br />
system MS 2000 was installed world-wide at power<br />
transformers of all major manufacturers. In the<br />
beginning utilities started to test the system with gridcoupling<br />
transformers of minor importance. Due to the<br />
good experience it is now operating at such strategical<br />
important points as nuclear power stations, pumped<br />
storage power stations, coal power stations and aluminia<br />
industry. Most of these installations were retrofitted onsite<br />
at already aged transformers. Normally the<br />
installation of sensors requires no welding at the<br />
transformer and takes about two days. The transformer<br />
has to be taken out of operation only for half a day to<br />
install the voltage sensors and the tap changer<br />
monitoring module.<br />
3.1 Active Part<br />
For early failure detection, the monitoring of the<br />
active part is of particular importance. It is fundamental<br />
to measure the electrical variables load current and<br />
operating voltage directly at the transformer. A<br />
bushing-type current transformers is used for load<br />
current measurement. The load current and top oil<br />
temperature are the starting variables for calculation of<br />
hot-spot temperature according to IEC 60354 and<br />
ageing rate of active part insulation [5]. This enables the<br />
evaluation not only of information regarding lifetime<br />
consumption but also of the temporary overload<br />
capacity of the transformer [4].<br />
For the assessment of the mechanical condition of<br />
the windings the knowledge of number and amplitude of<br />
short circuit currents is of tremendous importance.<br />
These are detected and evaluated by using a high<br />
sampling rate for the load current signal.<br />
3.2 Gas-in-oil amount<br />
For the gas-in-oil detection a Hydran sensor is<br />
used which reads a composite value of gases in ppm (H 2<br />
(100%), CO (18%), C 2 H 2 (8%), C 2 H 4 (1,5%)). As<br />
hydrogen is a key gas for problems in the active part, an<br />
increase in the output signal of the sensor is an<br />
indication for irregularities such as partial discharge or<br />
hot spots [6]. The evaluation of this measuring signal,<br />
together with the dependency on the temperature of the<br />
oil and the load current, provides a reliable basis for the<br />
continuous operation of the transformer. In the event of<br />
an increase of gas-in-oil content, an immediate reaction<br />
can be effected via an off-line dissolved gas analysis<br />
(DGA) to determine the concentration of the other<br />
components dissolved in the oil in order to clarify the<br />
cause of the potential damage.<br />
In Fig. 3 the gas-in-oil amount of a 80 MVA grid<br />
coupling transformer for an aluminia plant is shown for<br />
the time interval of one year. The monitoring system<br />
detected an increase of gas-in-oil content. The reason<br />
was assumed to be the temperature increase during<br />
summer. A DGA performed in August revealed a CO<br />
content of 427 ppm of CO and 27 ppm of H2 which is<br />
in accordance with the output of the Hydran sensor<br />
(108 ppm). So the reason for the increased gas-in-oil<br />
content was the increased value of CO, which was<br />
generated because of the normal increase of oil<br />
temperature. Thus for exact interpretation of the Hydran<br />
signal the knowledge of load and temperature is needed.<br />
Fig. 3:<br />
Gas-in-oil amount dependent on load and top oil<br />
temperature of a 80 MVA grid transformer<br />
3.3 Oil humidity<br />
A capacitive thin film sensor is used for the<br />
detection of moisture in oil. There are several causes<br />
for an increase of water-in-oil content. After improper<br />
shipping and erection of the transformer on-site the oil<br />
can be contaminated with water. Breathing of the<br />
transformer can cause absorption of moisture by the oil<br />
in the conservator. Due to the fact that water is a result<br />
and also an origin of paper degradation the water-in-oil<br />
content is an important indicator for the condition of<br />
winding insulation. It is reported that 4 % water content<br />
in paper for example increases the ageing rate by a<br />
factor of about 20 [7]. So measurement of oil humidity<br />
is recommended in particular for transformers which are<br />
already aged or operate usually at high oil temperatures,<br />
because accurate calculation of ageing rate requires the<br />
input of moisture content. Up to now the transformers<br />
equipped with a sensor for oil humidity are uncritical<br />
regarding moisture in oil. So practical experience in<br />
detecting moisture problems on-line is limited, but<br />
nevertheless the sensors are needed for accurate<br />
calculation of ageing rate.<br />
As the transformer warms up, moisture migrates<br />
from the paper into the oil. From this so called<br />
equilibrium of moisture in oil and paper also the water<br />
content in the paper can be calculated by the monitoring<br />
system [8, 9]. This value is needed for the calculation of<br />
the emergency overload time. Moisture in paper restricts<br />
the loading capacity because of the risk of bubble<br />
emission. Also the release of water drops from winding<br />
paper to oil can occur. So the acceptable limit for the<br />
hot spot temperature is dependent on the water content<br />
in the paper [10].
3.4 Bushings<br />
3.4.1 Detection of overvoltages<br />
The voltage applied to the transformer is acquired at<br />
the measuring tap of the capacitor bushing by means of<br />
a voltage sensor. It acts with the capacity of the bushing<br />
as a voltage divider. This enables not only the<br />
measurement of the operational voltage but also the<br />
detection of overvoltages, because due to its design the<br />
voltage sensor has a bandwidth up to some MHz. The<br />
output of the voltage sensor is connected to a peak<br />
sampler to detect the amplitude of overvoltages by the<br />
monitoring system. Overvoltages represent an essential<br />
risk potential for the insulation of transformer windings.<br />
Taking into account the volume of noxious gases which<br />
are dissolved in oil deductions can be drawn about the<br />
possible damage to the insulation of the active part after<br />
the occurrence of overvoltages.<br />
3.4.2 Change of capacitance<br />
Failure of condenser bushings occurs often because<br />
of partial flashover of the metallic foils which are used<br />
for controlling the electrical field within the bushing.<br />
Such partial flashovers do not lead to a sudden failure of<br />
the bushing, but they are growing from layer to layer<br />
until the voltage stress of the remaining layers is so high<br />
that complete breakdown occurs. If a partial flashover<br />
of one layer occurs, the capacitance of the bushing will<br />
be increased according to table 1 by ∆C.<br />
Voltage [kV] Number of foils ∆C<br />
123 28 3.6 %<br />
245 42 2.4 %<br />
400 60 1.7 %<br />
550 70 1.4 %<br />
Tab. 1: ∆C for partial flashover of one layer for oilimpregnated<br />
bushings [9]<br />
The change of the capacitance ∆C of the bushings<br />
can be detected by the monitoring system by comparing<br />
the output of one voltage sensor with the average value<br />
of the other two phases. The result is processed by<br />
averaging algorithms to eliminate imbalances of the grid<br />
voltage and variations due to temperature changes. This<br />
is assumed to be possible, because the deterioration<br />
process normally has a considerable longer time<br />
constant. This triggers an alarm and a warning<br />
In Fig. 4 the change of capacitance of a 400 kV grid<br />
coupling transformer is shown for a time interval of two<br />
month. It can be seen that variations due to unbalanced<br />
voltages and temperature variations is in the range of<br />
0.4 %. The signal to noise ratio is therefore sufficient to<br />
assess the insulation condition reliably. At a warning<br />
level of 1 % the monitoring system triggers a message<br />
for inspection of the bushing.<br />
Fig: 4:<br />
Voltage and change of capacitance of 400 kV<br />
bushings<br />
3.5 On-load Tap Changer<br />
An important component of a power transformer<br />
and also a frequent reason for severe failures is the onload<br />
tap changer [13]. Therefore the monitoring of this<br />
highly stressed element is a necessity.<br />
3.5.1 Tap changer position<br />
Recordings of the tap changer position and the<br />
operating current help to determine the number of tap<br />
switching operations and the total switched current.<br />
As the contact wear of the diverter switch contacts is a<br />
function of the switched load current this information is<br />
needed for performing a condition based maintenance<br />
for the diverter switch [14]. If an excessive wear<br />
situation is undetected, the contacts may burn open or<br />
weld together. To avoid these problems limiting values<br />
for the time in service, number of operations and total<br />
switched load current, can be pre-set in accordance with<br />
the maintenance instructions of the OLTC<br />
manufacturer.<br />
3.5.2 Assessment of mechanical condition<br />
OLTC failures are often dominated by mechanical<br />
faults in nature. Such defects can be for example broken<br />
linkage, failure of springs, binding of contacts, worn<br />
gears and problems with the drive mechanism [15].<br />
Mechanical and control problems can be detected by<br />
measurement of the power consumption of the OLTC<br />
drive, because additional friction, extended changer<br />
operation times and other abnormalities have a<br />
significant influence on the drive current. An event<br />
record of the power consumption is captured during<br />
each tap changing process and analysed by evaluation of<br />
6 characteristic parameters which are:<br />
1. Time of inrush current:<br />
The inrush current flows during a period of about<br />
300 ms. It is related to the static friction and backlash in<br />
the linkages.<br />
2. Total switching time:<br />
Variation of time required for a tap changing<br />
process indicates problems with the control of the<br />
OLTC.
3. Power consumption index:<br />
The energy consumed by the motor drive during a<br />
tap changing process divided by the total switching time<br />
is represented as the power consumption index. This<br />
value is dependent on the operation temperature and<br />
characterises the average running conditions.<br />
4. Maximum sector 1 (S1):<br />
During the motion of the selector contacts, the<br />
amplitude of the power consumption is monitored. This<br />
value represents the maximum during opening and<br />
moving of the selector contacts.<br />
5. Maximum sector 2 (S2):<br />
This value is the maximum during the closing of the<br />
selector contacts.<br />
6. Maximum Sector 3 (S3):<br />
The amplitude of the power consumption is<br />
recorded during diverter switch action.<br />
These six parameters characterise each tap changing<br />
process and in case of deviations warning messages are<br />
generated. In Fig. 5 such a situation is presented for<br />
three successive tap changing processes recorded during<br />
maintenance of the OLTC. The first two signatures (A,<br />
B) show a regular tap changing process. The peaks on<br />
the curves are caused by the friction of opening,<br />
revolution and closing of selector switch [2]. Because<br />
tap changing process C differed significantly from a<br />
normal tap changing, the parameters for total switching<br />
time, maximum sector 2 and 3 and power consumption<br />
index showed abnormal variations. Based on this the<br />
monitoring system sent an alarm message to the<br />
responsible engineer.<br />
The root cause analysis revealed that during the tap<br />
changing process C the handcrank was inserted into the<br />
drive mechanism which interrupted the process and<br />
therefore triggered the warning message. So this<br />
problem was caused by incorrect operation and not an<br />
internal problem, but this event illustrates the<br />
capabilities as an early warning system for mechanical<br />
anomalies.<br />
3.6 Cooling Unit<br />
3.6.1 Thermal resistance<br />
The thermal resistance R th describes the efficiency<br />
of the cooling unit. For air-cooled power transformers<br />
the actual thermal resistance can be calculated by the<br />
following equation:<br />
R<br />
th,<br />
act<br />
ϑoil<br />
−ϑair<br />
=<br />
P + P ⋅ k<br />
0<br />
k , n<br />
The result has to be averaged to eliminate variations<br />
due to the dynamic behaviour of load factor oil and<br />
ambient temperature. Furthermore the number of fans<br />
and pumps in operation has to be taken into account to<br />
calculate the nominal thermal resistance R th .<br />
On-line monitoring of the cooling unit of a 420kV /<br />
600MVA grid-coupling transformer by calculation of<br />
the nominal thermal resistance Rth showed a strong<br />
increase after switching on of two additional fans which<br />
was signalled by the control system (Fig. 6). This<br />
increase triggered a warning message by the monitoring<br />
system. A local check in the substation revealed that due<br />
to a failure of energy supply only half of the cooling<br />
unit (3 fans) was in operation and therefore only three<br />
fans were running. This status was not in accordance<br />
with the information of the control system and led to the<br />
strong increase of nominal thermal resistance. With the<br />
present load and half of the cooling power the<br />
transformer could be kept in service. But it would not be<br />
possible to operate the transformer with nominal load<br />
due to the missing cooling power. This scenario shows<br />
the importance of detecting also minor failures to avoid<br />
the risk of not delivering energy<br />
Rth [K/MW], Toil[°C]<br />
80 Toil<br />
70<br />
60<br />
50<br />
40<br />
30<br />
20<br />
10<br />
RthN<br />
0<br />
7.1. 17.1. 27.1. 6.2. 16.2. 26.2. 8.3.<br />
2<br />
18<br />
16<br />
14<br />
No. of Fans<br />
12<br />
10<br />
8<br />
6<br />
4<br />
2<br />
0<br />
Fig 6:<br />
Abnormal condition of cooling unit detected by<br />
increase of thermal resistance Rth<br />
Fig. 5:<br />
Faulty tap changing process<br />
4 Conclusion<br />
The justification for on-line monitoring of power<br />
transformers is driven by the need of the electrical<br />
utilities to reduce operating costs and enhance the<br />
availability and reliability of their equipment. The<br />
evaluation of data acquired by an on-line monitoring<br />
system shows the capability to detect oncoming failures<br />
within active part, bushings, on-load tap changer and
cooling unit. Using the benefits of modern ITtechnology<br />
the distribution of information about the<br />
condition of the equipment can easily be done by means<br />
of standardised web browser technology.<br />
When considering the installation of on-line<br />
monitoring systems size, importance and condition of a<br />
power transformer have to be analysed. Especially for<br />
aged transformers and in general at strategic locations in<br />
the electrical network on-line monitoring is necessary<br />
and valuable, because by the prevention of major<br />
failures costs for outages, repair, and associated<br />
collateral damages can be saved.<br />
5 References<br />
[1] S. Tenbohlen, F. Figel: “On-line Condition<br />
Monitoring for Power Transformers”, IEEE<br />
Power Engineering Society Winter Meeting,<br />
Singapore, Jan. 2000<br />
[2] S. Tenbohlen et al.: “Enhanced Diagnosis of<br />
Power Transformers using On- and Off-line<br />
Methods: Results, Examples and Future Trends”,<br />
CIGRE Session 2000, paper 12-204, Paris, 2000.<br />
[3] J.P. Dupraz et al.: “ Electronic Control of Circuit<br />
Breakers”, CIGRE Session 2000, paper 13-206,<br />
Paris, 2000<br />
[4] T. Stirl, et al.: “Assessment of Overload Capacity<br />
of Power Transformers by on-line Monitoring<br />
Systems”, IEEE Power Engineering Society<br />
Winter Meeting, Columbus, Ohio, 2001<br />
[5] IEC 60354: “Loading guide for oil immersed<br />
power Transformers” (IEC, 1991)<br />
[6] J.P. Gibeault: “On-line monitoring of key fault<br />
gases in transformer oil“, 10 th International<br />
Symposium on High Voltage Engineering,<br />
Montreal, 1997<br />
[7] D.H. Shroff, A.W. Stannett.: “A review of paper<br />
ageing in power transformers“, IEE Proceedings,<br />
Vol.132, Pt C, No 6, November 1985<br />
[8] J. Fabre, A. Pinchon: “Deterioration processes<br />
and products of paper in oil”, CIGRE, paper 137,<br />
Paris, 1960<br />
[9] Y. Du et al.: “Moisture equilibrium in<br />
transformer paper-oil systems”, IEEE Electrical<br />
Insulation Magazine, 1999, Vol. 15, No 1<br />
[10] V. G. Davydov et al.: “Transformer Insulation<br />
Behaviour during Overload”, Proceedings of<br />
EPRI Substation Equipment Diagnostics<br />
Conference V, New Orleans, 1997<br />
[11] T. Higgins: “The difference on-line condition<br />
monitoring could have made”, CIGRE<br />
Transformer Committee Colloquium, Dublin,<br />
2001<br />
[12] N. Koch: “Monitoring for Graded Condenser<br />
Bushings”, Transform, Munich, 2001<br />
[13] "An International Survey on Failures of Large<br />
Power Transformers in Service", CIGRE<br />
Working Group 12.05, Electra, No. 88, 1983<br />
[14] A. Krämer: “On-Load Tap-Changers for Power<br />
Transformers”, MR-Publication, Regensburg,<br />
2000<br />
[15] IEEE Guide for Application of Monitoring to<br />
Liquid-Immersed Transformers and Components,<br />
IEEE PC57.XXX Draft 9, March 2001<br />
[16] “An International Survey on Failures of Large<br />
Power Transformers in Service”, CIGRE<br />
Working Group 12.05, Electra, No. 88, 1983