How to interpret the Fund Fact Sheet report - Fi360
How to interpret the Fund Fact Sheet report - Fi360
How to interpret the Fund Fact Sheet report - Fi360

Create successful ePaper yourself
Turn your PDF publications into a flip-book with our unique Google optimized e-Paper software.
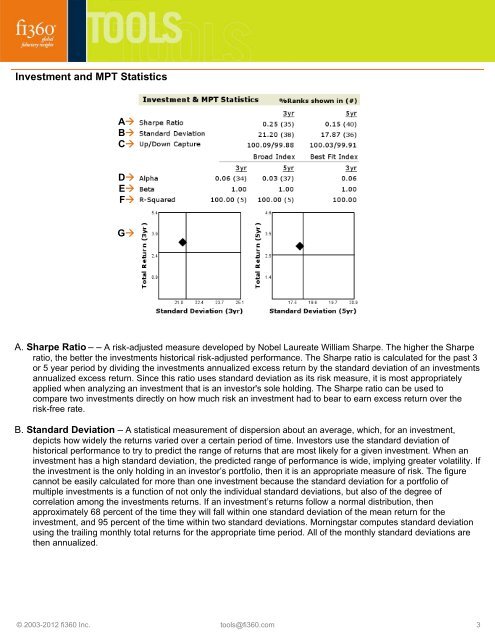
Investment and MPT Statistics<br />
A<br />
B<br />
C<br />
D<br />
E<br />
F<br />
G<br />
A. Sharpe Ratio – – A risk-adjusted measure developed by Nobel Laureate William Sharpe. The higher <strong>the</strong> Sharpe<br />
ratio, <strong>the</strong> better <strong>the</strong> investments his<strong>to</strong>rical risk-adjusted performance. The Sharpe ratio is calculated for <strong>the</strong> past 3<br />
or 5 year period by dividing <strong>the</strong> investments annualized excess return by <strong>the</strong> standard deviation of an investments<br />
annualized excess return. Since this ratio uses standard deviation as its risk measure, it is most appropriately<br />
applied when analyzing an investment that is an inves<strong>to</strong>r's sole holding. The Sharpe ratio can be used <strong>to</strong><br />
compare two investments directly on how much risk an investment had <strong>to</strong> bear <strong>to</strong> earn excess return over <strong>the</strong><br />
risk-free rate.<br />
B. Standard Deviation – A statistical measurement of dispersion about an average, which, for an investment,<br />
depicts how widely <strong>the</strong> returns varied over a certain period of time. Inves<strong>to</strong>rs use <strong>the</strong> standard deviation of<br />
his<strong>to</strong>rical performance <strong>to</strong> try <strong>to</strong> predict <strong>the</strong> range of returns that are most likely for a given investment. When an<br />
investment has a high standard deviation, <strong>the</strong> predicted range of performance is wide, implying greater volatility. If<br />
<strong>the</strong> investment is <strong>the</strong> only holding in an inves<strong>to</strong>r’s portfolio, <strong>the</strong>n it is an appropriate measure of risk. The figure<br />
cannot be easily calculated for more than one investment because <strong>the</strong> standard deviation for a portfolio of<br />
multiple investments is a function of not only <strong>the</strong> individual standard deviations, but also of <strong>the</strong> degree of<br />
correlation among <strong>the</strong> investments returns. If an investment’s returns follow a normal distribution, <strong>the</strong>n<br />
approximately 68 percent of <strong>the</strong> time <strong>the</strong>y will fall within one standard deviation of <strong>the</strong> mean return for <strong>the</strong><br />
investment, and 95 percent of <strong>the</strong> time within two standard deviations. Morningstar computes standard deviation<br />
using <strong>the</strong> trailing monthly <strong>to</strong>tal returns for <strong>the</strong> appropriate time period. All of <strong>the</strong> monthly standard deviations are<br />
<strong>the</strong>n annualized.<br />
© 2003-2012 fi360 Inc. <strong>to</strong>ols@fi360.com 3