Corporate Banking
Corporate Banking
Corporate Banking

Create successful ePaper yourself
Turn your PDF publications into a flip-book with our unique Google optimized e-Paper software.
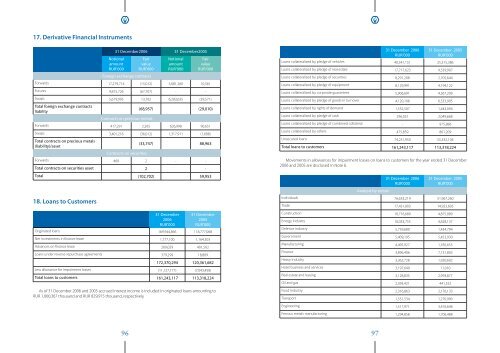
17. Derivative Financial Instruments<br />
31 December2006 31 December2005<br />
Notional<br />
amount<br />
RUR’000<br />
Fair<br />
value<br />
RUR’000<br />
Foreign exchange contracts<br />
Notional<br />
amount<br />
RUR’000<br />
Fair<br />
value<br />
RUR’000<br />
Forwards 17,279,714 (15,012) 5,681,260 10,561<br />
Futures 9,815,726 (67,707) - -<br />
Swaps 5,679,995 13,762 6,283,035 (39,571)<br />
Total foreign exchange contracts<br />
liability<br />
Contracts on precious metals<br />
(68,957) (29,010)<br />
Forwards 417,291 2,265 626,998 90,651<br />
Swaps 3,401,216 (36,012) 1,317,911 (1,688)<br />
Total contracts on precious metals<br />
(liability)/asset<br />
Contracts on securities<br />
(33,747) 88,963<br />
Forwards 460 2 - -<br />
Total contracts on securities asset 2 -<br />
31 December 2006<br />
RUR’000<br />
31 December 2005<br />
RUR’000<br />
Loans collateralized by pledge of vehicles 40,541,151 25,315,386<br />
Loans collateralized by pledge of real estate 17,717,623 9,539,907<br />
Loans collateralized by pledge of securities 8,291,208 2,705,644<br />
Loans collateralized by pledge of equipment 8,129,991 4,194,122<br />
Loans collateralized by corporate guarantees 5,906,691 4,367,209<br />
Loans collateralized by pledge of goods in turnover 4,120,106 6,533,995<br />
Loans collateralized by rights of demand 1,532,507 1,443,094<br />
Loans collateralized by pledge of cash 296,031 2,049,668<br />
Loans collateralized by pledge of combined collateral - 975,886<br />
Loans collateralized by others 475,859 861,209<br />
Unsecured loans 74,231,950 55,332,104<br />
Total loans to customers 161,243,117 113,318,224<br />
Movements in allowances for impairment losses on loans to customers for the year ended 31 December<br />
2006 and 2005 are disclosed in Note 6.<br />
Total (102,702) 59,953<br />
Analysis by sector:<br />
31 December 2006<br />
RUR’000<br />
31 December 2005<br />
RUR’000<br />
18. Loans to Customers<br />
31 December<br />
2006<br />
RUR’000<br />
31 December<br />
2005<br />
RUR’000<br />
Originated loans 169,944,866 118,777,068<br />
Net investments in finance lease 1,777,100 1,164,303<br />
Advances on finance lease 269,029 401,502<br />
Loans under reverse repurchase agreements 379,299 18,809<br />
172,370,294 120,361,682<br />
Less allowance for impairment losses (11,127,177) (7,043,458)<br />
Total loans to customers 161,243,117 113,318,224<br />
As of 31 December 2006 and 2005 accrued interest income is included in originated loans amounting to<br />
RUR 1,000,367 thousand and RUR 829,915 thousand, respectively.<br />
Individuals 76,633,219 51,967,260<br />
Trade 17,431,803 14,923,605<br />
Construction 10,716,689 4,875,089<br />
Energy industry 10,033,755 4,828,137<br />
Defence industry 5,739,680 1,434,794<br />
Government 5,409,195 5,453,930<br />
Manufacturing 4,495,927 1,185,655<br />
Finance 3,896,406 7,131,803<br />
Heavy industry 3,362,728 1,920,602<br />
Hotel business and services 3,197,649 11,010<br />
Real estate and leasing 3,128,835 2,993,877<br />
Oil and gas 2,393,421 441,552<br />
Food industry 2,316,863 2,176,133<br />
Transport 1,551,534 1,270,990<br />
Engineering 1,517,971 3,476,648<br />
Ferrous metals manufacturing 1,294,858 1,706,488<br />
96 97