Backbone sequential assigment tutorial - NMR Spectroscopy ...
Backbone sequential assigment tutorial - NMR Spectroscopy ...
Backbone sequential assigment tutorial - NMR Spectroscopy ...

You also want an ePaper? Increase the reach of your titles
YUMPU automatically turns print PDFs into web optimized ePapers that Google loves.
proton (H) of (mostly) every NH groups presents in the protein. One needs a 15 N labeled protein for<br />
this experiment. Therefore, every peak in this spectrum, represents the fingerprint of each amino acid<br />
making up the protein. Note that not only the backbone amide groups are seen, but also side chain NH<br />
groups (from Arg, Asn, Gln, His and Trp, sometimes Lys) can also be present in this spectrum.<br />
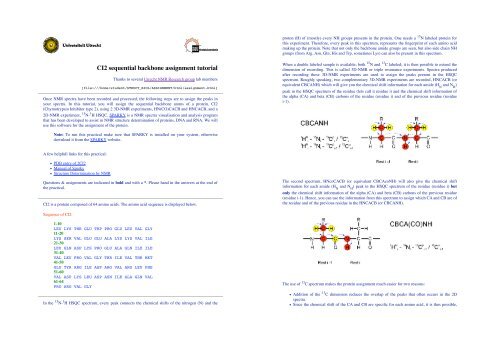
CI2 <strong>sequential</strong> backbone assignment <strong>tutorial</strong><br />
Thanks to several Utrecht <strong>NMR</strong> Research group lab members<br />
[file:///home/student/STRUCT_BIOL/ASSIGNMENT/html/assignment.html]<br />
Once <strong>NMR</strong> spectra have been recorded and processed, the following steps are to assign the peaks in<br />
your spectra. In this <strong>tutorial</strong>, you will assign the <strong>sequential</strong> backbone atoms of a protein, CI2<br />
(Chymotrypsin Inhibitor type 2), using 2 3D-<strong>NMR</strong> experiments, HN(CO)CACB and HNCACB, and a<br />
2D-<strong>NMR</strong> experiment, 15 N- 1 H HSQC. SPARKY is a <strong>NMR</strong> spectra visualisation and analysis program<br />
that has been developed to assist in <strong>NMR</strong> structure determination of proteins, DNA and RNA. We will<br />
use this software for the assignment of the protein.<br />
When a double labeled sample is available; both 15 N and 13 C labeled; it is then possible to extend the<br />
dimension of recording. This is called 3D-<strong>NMR</strong> or triple resonance experiments. Spectra produced<br />
after recording these 3D-<strong>NMR</strong> experiments are used to assign the peaks present in the HSQC<br />
spectrum. Roughly speaking, two complementary 3D-<strong>NMR</strong> experiments are recorded, HNCACB (or<br />
equivalent CBCANH) which will give you the chemical shift information for each amide (H N<br />
and N H<br />
)<br />
peak in the HSQC spectrum of the residue (lets call it residue i) and the chemical shift information of<br />
the alpha (CA) and beta (CB) carbons of the residue (residue i) and of the previous residue (residue<br />
i-1).<br />
Note: To run this practical make sure that SPARKY is installed on your system, otherwise<br />
download it from the SPARKY website.<br />
A few helpfull links for this practical:<br />
PDB entry of 2CI2<br />
Manual of Sparky<br />
Structure Determination by <strong>NMR</strong><br />
Questions & assignments are indicated in bold and with a *. Please hand in the answers at the end of<br />
the practical.<br />
CI2 is a protein composed of 64 amino acids. The amino acid sequence is displayed below.<br />
The second spectrum, HNcoCACB (or equivalent CBCAcoNH) will also give the chemical shift<br />
information for each amide (H N<br />
and N H<br />
) peak in the HSQC spectrum of the residue (residue i) but<br />
only the chemical shift information of the alpha (CA) and beta (CB) carbons of the previous residue<br />
(residue i-1). Hence, you can use the information from this spectrum to assign which CA and CB are of<br />
the residue and of the previous residue in the HNCACB (or CBCANH).<br />
Sequence of CI2:<br />
1-10<br />
LEU LYS THR GLU TRP PRO GLU LEU VAL GLY<br />
11-20<br />
LYS SER VAL GLU GLU ALA LYS LYS VAL ILE<br />
21-30<br />
LEU GLN ASP LYS PRO GLU ALA GLN ILE ILE<br />
31-40<br />
VAL LEU PRO VAL GLY THR ILE VAL THR MET<br />
41-50<br />
GLU TYR ARG ILE ASP ARG VAL ARG LEU PHE<br />
51-60<br />
VAL ASP LYS LEU ASP ASN ILE ALA GLN VAL<br />
61-64<br />
PRO ARG VAL GLY<br />
In the 15 N- 1 H HSQC spectrum, every peak connects the chemical shifts of the nitrogen (N) and the<br />
The use of 13 C spectrum makes the protein assignment much easier for two reasons:<br />
Addition of the 13 C dimension reduces the overlap of the peaks that often occurs in the 2D<br />
spectra.<br />
Since the chemical shift of the CA and CB are specific for each amino acid, it is thus possible,
just with these 2 carbon resonances, to identify each amino acid and use them for the <strong>sequential</strong><br />
backbone assignment.<br />
The average chemical shifts for the carbons alpha and beta for each amino acid is shown in the next<br />
picture. The values have been taken from the BioMagResBank. A nice tool that includes this picture is<br />
available:<br />
Go to the directory cd ~/STRUCT_BIOL/ASSIGNMENT/shift/ and type<br />
/usr/bin/wish in your terminal, then source shift.tcl, followed by<br />
hh_shift_table. Click on the button H/C to alter between proton and carbon chemical<br />
shifts.<br />
To open the project for this exercise go to File -> Project/Open project and<br />
select assign.proj (located in the /home/course*/STRUCT_BIOL<br />
/ASSIGNMENT/sparkydata/Projects/ directory). Three spectra should appear on<br />
your screen; an HSQC of CI2 and the 3D spectra; HN(CO)CACB and HNCACB. The HSQC<br />
spectrum has two scrollbars; so you can view the spectrum even when you are zoomed in.<br />
Use the shortcuts zi and zo for zooming in and out, or use the zoom pointer mode. Both 3D spectra<br />
have an extra scrollbar at the bottom, so you can go through the 3 rd dimension (of the cube). In the<br />
HSQC spectrum, peaks correspond to all the amides of CI2. The 3D spectra are put in such a way that<br />
we see the 1 H- 13 C plane of the cube. Pick a peak by typing F8 and clicking on a peak.<br />
When you select this peak in the HSQC and center on it - type vc (view center) - you will see the CA<br />
and CB carbons of this residue (and the one before) in the 3D spectra. All the spectra are connected, so<br />
when you will move through one of them, the other ones will also move. This is made possible in<br />
View -> More -> Synchronize. You will see that the 15 N, 13 C and 1 H axis are<br />
connected.<br />
Specific View options of each spectrum can be accessed by the shortcut vt or View -> View<br />
options. The menu can also be accessed by right-clicking inside the spectrum. Contour levels can<br />
be adjusted by the shortcut ct or View -> More -> Contours Levels. These<br />
levels do not have to be changed anymore.<br />
First you have to peak-pick the HSQC spectrum. The pointer mode should be selected as<br />
find/add peaks. Now you can put peaks into the spectrum by hand. The program can also<br />
do automatic peak picking by dragging a box over the spectrum. Sparky will automatically recognise<br />
the peaks according to the current contour levels. When you put a peak by hand; the peak can be<br />
centered by the shortcut pc (peak center) and integrated by pi (peak integrate). The last one can be<br />
handy for overlapping peaks; Sparky will fit the lineshape with two or more peaks.<br />
* How many (backbone & side-chain!) peaks do you expect to find in your 1 H- 15 N HSQC<br />
spectrum. Compare this to the number of peaks found by SPARKY<br />
Now the peaks have been picked; find the corresponding CA and CB values in the 3D spectra. Since<br />
the 3D experiment data that we have are really of good signal/noise ratio and well dispersed, we can<br />
do a restricted automatic peak picking. First select all the peaks in your HSQC and then open the<br />
Restricted Peak Picking panel (kr, or Extension -> Restricted Peak Pick).<br />
Select to find peaks in the HNCACB using peaks in the HSQC; the ranges are alright; then pick the<br />
peaks.<br />
* How many peaks do you expect to find in your HNCACB? Does the amount of found peaks<br />
match that number; if not try to explain the difference. What about the HN(CO)CACB?<br />
Analyzing the <strong>NMR</strong> spectra of CI2 with the software SPARKY<br />
Open a new terminal and type sparky to start the assignment software.<br />
You can make a so called 'strip plot' from the 3D experiments. This is a handy tool for the assignment.<br />
First select all the peaks in your HSQC and then open the Strip Plot panel (sp or Extension<br />
-> Strip Plot Peak Pick). Select the 3D spectra in Show -> Select<br />
Strip Spectra. Mark the HNCACB and HN(CO)CACB. Leave the axis order as HCN, click<br />
on OK and close the panel. Then make the strips by Show -> Add Selected Peak<br />
Strip. The strips are put next to each other and you are able to see which carbons belong to the<br />
residue itself and which belong to the previous one.<br />
* Use the chemical shift statistics (shift.tcl) to find some specific residues like Threonine (T),
Serine (S), Alanine (A) or Glycine (G) and write down their 1 H N<br />
, 15 N, 13 CA and 13 CB<br />
frequencies. These residues can be used as starting point for your assignments.<br />
By looking at the previous carbons of the residue; you can already guess what kind of residue it will be<br />
according to the statistics; you can map this in the sequence of CI2. Select a peak in the strip plot and<br />
go to one of your 3D spectra. Type vc (view center) and you can see this strip in your actual spectra.<br />
phi and psi backbone angles, their averages can reliably be used as angular restraints for the protein whose<br />
structure is being studied. These predictions will be indicated with Good.<br />
The flow chart of the TALOS program is shown in the figure below<br />
Now delete all strips and select one of the starting peaks in your HSQC. Make the strips of only this<br />
peak in the Strip Plot Panel. Now select the peaks from the previous residue (visible in both<br />
experiments) in the HNCACB and try to find matching peaks ( sm or Find -> Add<br />
Strips Matching Peaks). In this way it should be possible to go through the sequence<br />
and assign all the HSQC peaks.<br />
* Try to assign a stretch of about 5 residues in the protein and write down their 1 H N<br />
, 15 N, 13 CA<br />
and 13 CB frequencies. Remember that one can see the prolines only from the next residue and<br />
that the first residue can most of the time not be found.<br />
Use of backbone chemical shift information for predicting dihedral angles<br />
The following figure shows the graphical display of the TALOS output.<br />
Chemical shifts of backbone atoms in proteins are very sensitive to local conformation, and homologous<br />
amino acid sequences show quite similar patterns of secondary chemical shifts. The inverse of this relation is<br />
used to search a database for triplets of adjacent residues with secondary chemical shifts and sequence<br />
similarity which provide the best match to the query triplet of interest. The database contains 13 CA, 13 CB,<br />
13 C',<br />
1 Ha and<br />
15 N chemical shifts for 20 proteins for which a high resolution X-ray structure is available.<br />
The computer program TALOS was developed to search this database for strings of residues with chemical<br />
shift and residue type homology. The relative importance of the weighting factors attached to the secondary<br />
chemical shifts of the five types of resonances relative to that of sequence similarity was optimized<br />
empirically. TALOS yields the 10 triplets which have the closest similarity in secondary chemical shift and<br />
amino acid sequence to those of the query sequence. If the central residues in these 10 triplets exhibit similar
Go to the ~/STRUCT_BIOL/ASSIGNMENT/talos_ci2 directory. Look at the file called<br />
ci2d_shift.tab. This file contains the chemical shifts of the CA, CB, C, N and H N<br />
nuclei of each<br />
amino acid. Type in the terminal talos -help for a short description of TALOS. Then type<br />
talos.tcl -in ci2d_shift.tab. TALOS will start the predictions and will save them in<br />
the directory /pred. For a summary of the results, type vina.tcl -in<br />
ci2d_shift.tab -ref ci2.pdb -auto. That will create a summary file called<br />
pred.tab. You can then see the results of the prediction by typing rama.tcl -in<br />
ci2d_shift.tab -ref ci2.pdb.<br />
* How many residues have a helical conformation? And how many are located in a beta-strand?<br />
Open the crystal structure of CI2 in a graphical program like molmol: molmol ci2.pdb. Select all<br />
atoms Prop > Select All > Atom. Since in a crystal structure there are usually no<br />
H-atoms, we will have to calculate them: Calc > Atom > H*. In order to calculate the secondary<br />
structure elements and to show a ribbon presentation of the structure, do the following: Attr ><br />
Style > Bond > invisible and click on ribbon in the panel on the right. You can label<br />
the structure with the residue numbers by clicking on label num.<br />
To calculate the backbone angles in the crystal structure, write the following lines in the command-line:<br />
SelectAngle ':*@PHI,PSI' followed by CalcAngle.<br />
* Compare the predicted secondary structure elements & predicted dihedral angles (labeled with<br />
Good and in green) extracted from the <strong>NMR</strong> data with TALOS to the ones of the crystal structure.