RESETTLEMENT ACTION PLAN - About Department of Road
RESETTLEMENT ACTION PLAN - About Department of Road
RESETTLEMENT ACTION PLAN - About Department of Road

You also want an ePaper? Increase the reach of your titles
YUMPU automatically turns print PDFs into web optimized ePapers that Google loves.
Resettlement Action Plan January, 2013<br />
Naryanghat - Mugling <strong>Road</strong><br />
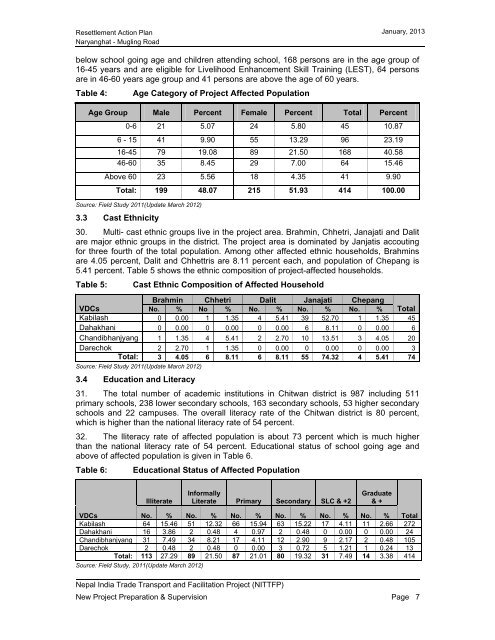
below school going age and children attending school, 168 persons are in the age group <strong>of</strong><br />
16-45 years and are eligible for Livelihood Enhancement Skill Training (LEST), 64 persons<br />
are in 46-60 years age group and 41 persons are above the age <strong>of</strong> 60 years.<br />
Table 4: Age Category <strong>of</strong> Project Affected Population<br />
Age Group Male Percent Female Percent Total Percent<br />
0-6 21 5.07 24 5.80 45 10.87<br />
6 - 15 41 9.90 55 13.29 96 23.19<br />
16-45 79 19.08 89 21.50 168 40.58<br />
46-60 35 8.45 29 7.00 64 15.46<br />
Above 60 23 5.56 18 4.35 41 9.90<br />
Total: 199 48.07 215 51.93 414 100.00<br />
Source: Field Study 2011(Update March 2012)<br />
3.3 Cast Ethnicity<br />
30. Multi- cast ethnic groups live in the project area. Brahmin, Chhetri, Janajati and Dalit<br />
are major ethnic groups in the district. The project area is dominated by Janjatis accouting<br />
for three fourth <strong>of</strong> the total population. Among other affected ethnic households, Brahmins<br />
are 4.05 percent, Dalit and Chhettris are 8.11 percent each, and population <strong>of</strong> Chepang is<br />
5.41 percent. Table 5 shows the ethnic composition <strong>of</strong> project-affected households.<br />
Table 5: Cast Ethnic Composition <strong>of</strong> Affected Household<br />
Brahmin Chhetri Dalit Janajati Chepang<br />
VDCs<br />
No. % No % No. % No. % No. % Total<br />
Kabilash 0 0.00 1 1.35 4 5.41 39 52.70 1 1.35 45<br />
Dahakhani 0 0.00 0 0.00 0 0.00 6 8.11 0 0.00 6<br />
Chandibhanjyang 1 1.35 4 5.41 2 2.70 10 13.51 3 4.05 20<br />
Darechok 2 2.70 1 1.35 0 0.00 0 0.00 0 0.00 3<br />
Total: 3 4.05 6 8.11 6 8.11 55 74.32 4 5.41 74<br />
Source: Field Study 2011(Update March 2012)<br />
3.4 Education and Literacy<br />
31. The total number <strong>of</strong> academic institutions in Chitwan district is 987 including 511<br />
primary schools, 238 lower secondary schools, 163 secondary schools, 53 higher secondary<br />
schools and 22 campuses. The overall literacy rate <strong>of</strong> the Chitwan district is 80 percent,<br />
which is higher than the national literacy rate <strong>of</strong> 54 percent.<br />
32. The lliteracy rate <strong>of</strong> affected population is about 73 percent which is much higher<br />
than the national literacy rate <strong>of</strong> 54 percent. Educational status <strong>of</strong> school going age and<br />
above <strong>of</strong> affected population is given in Table 6.<br />
Table 6: Educational Status <strong>of</strong> Affected Population<br />
Illiterate<br />
Informally<br />
Literate Primary Secondary SLC & +2<br />
Graduate<br />
& +<br />
VDCs<br />
No. % No. % No. % No. % No. % No. % Total<br />
Kabilash 64 15.46 51 12.32 66 15.94 63 15.22 17 4.11 11 2.66 272<br />
Dahakhani 16 3.86 2 0.48 4 0.97 2 0.48 0 0.00 0 0.00 24<br />
Chandibhanjyang 31 7.49 34 8.21 17 4.11 12 2.90 9 2.17 2 0.48 105<br />
Darechok 2 0.48 2 0.48 0 0.00 3 0.72 5 1.21 1 0.24 13<br />
Total: 113 27.29 89 21.50 87 21.01 80 19.32 31 7.49 14 3.38 414<br />
Source: Field Study, 2011(Update March 2012)<br />
Nepal India Trade Transport and Facilitation Project (NITTFP)<br />
New Project Preparation & Supervision Page 7
![j:6 ]zg cfof ]hgf](https://img.yumpu.com/51286794/1/190x245/j6-zg-cfof-hgf.jpg?quality=85)
![x'nfsL /fhdfu { cfof ]hgf](https://img.yumpu.com/50581959/1/190x245/xnfsl-fhdfu-cfof-hgf.jpg?quality=85)