Instructions - Computer Science 101 - West Virginia University
Instructions - Computer Science 101 - West Virginia University
Instructions - Computer Science 101 - West Virginia University

Create successful ePaper yourself
Turn your PDF publications into a flip-book with our unique Google optimized e-Paper software.
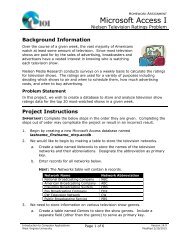
Background Information<br />
HOMEWORK ASSIGNMENT<br />
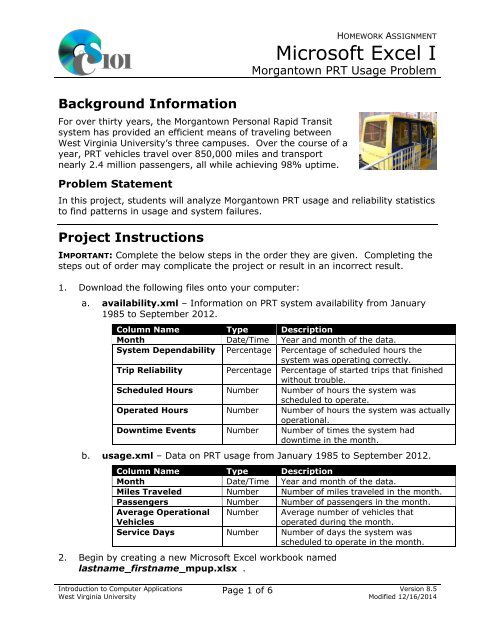
Microsoft Excel I<br />
Morgantown PRT Usage Problem<br />
For over thirty years, the Morgantown Personal Rapid Transit<br />
system has provided an efficient means of traveling between<br />
<strong>West</strong> <strong>Virginia</strong> <strong>University</strong>’s three campuses. Over the course of a<br />
year, PRT vehicles travel over 850,000 miles and transport<br />
nearly 2.4 million passengers, all while achieving 98% uptime.<br />
Problem Statement<br />
In this project, students will analyze Morgantown PRT usage and reliability statistics<br />
to find patterns in usage and system failures.<br />
Project <strong>Instructions</strong><br />
IMPORTANT: Complete the below steps in the order they are given. Completing the<br />
steps out of order may complicate the project or result in an incorrect result.<br />
1. Download the following files onto your computer:<br />
a. availability.xml – Information on PRT system availability from January<br />
1985 to September 2012.<br />
Column Name Type Description<br />
Month Date/Time Year and month of the data.<br />
System Dependability Percentage Percentage of scheduled hours the<br />
system was operating correctly.<br />
Trip Reliability Percentage Percentage of started trips that finished<br />
without trouble.<br />
Scheduled Hours Number Number of hours the system was<br />
scheduled to operate.<br />
Operated Hours Number Number of hours the system was actually<br />
operational.<br />
Downtime Events Number Number of times the system had<br />
downtime in the month.<br />
b. usage.xml – Data on PRT usage from January 1985 to September 2012.<br />
Column Name Type Description<br />
Month Date/Time Year and month of the data.<br />
Miles Traveled Number Number of miles traveled in the month.<br />
Passengers Number Number of passengers in the month.<br />
Average Operational<br />
Vehicles<br />
Number Average number of vehicles that<br />
operated during the month.<br />
Service Days Number Number of days the system was<br />
scheduled to operate in the month.<br />
2. Begin by creating a new Microsoft Excel workbook named<br />
lastname_firstname_mpup.xlsx .<br />
Introduction to <strong>Computer</strong> Applications<br />
<strong>West</strong> <strong>Virginia</strong> <strong>University</strong><br />
Page 1 of 6 Version 8.5<br />
Modified 12/16/2014
3. We must adjust the sheets in our workbook.<br />
a. Rename Sheet1 to Usage .<br />
b. Add a new sheet named Availability .<br />
c. Add a new sheet named Analysis Questions .<br />
4. We must import the PRT usage data into the Usage sheet.<br />
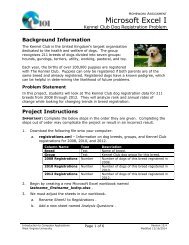
HOMEWORK ASSIGNMENT<br />
Microsoft Excel I<br />
Morgantown PRT Usage Problem<br />
Using the DATA ribbon, import the data from usage.xml and place it starting<br />
in cell A3. Excel will have to create a schema based on the XML source data.<br />
The data will be imported as an XML table.<br />
5. We wish to apply some additional formatting to the Usage sheet.<br />
a. We need to add additional columns to store usage data.<br />
i. Insert four new table columns to the right of column E.<br />
b. For the table, turn on the Total Row option.<br />
c. Enter text in the cells as indicated below.<br />
i. A1: PRT Usage - Firstname Lastname<br />
ii.<br />
iii.<br />
iv.<br />
F3: Miles Rank<br />
G3: Passengers Rank<br />
H3: Miles per Day<br />
v. I3: Passengers per Day<br />
vi.<br />
A337: Average<br />
d. Merge-and-center cells A1 through I1.<br />
e. Set the font size to 16-point for cell A1.<br />
f. Format the table using a style of your choice other than the default table<br />
style.<br />
6. We need to perform some additional calculations to analyze the Usage sheet<br />
data.<br />
a. There is nothing to do for this step. Please proceed to the next step.<br />
b. In column F, use the RANK() function to rank each month by the number<br />
of miles traveled.<br />
c. In column G, use the RANK() function to rank each month by the number<br />
of passengers.<br />
d. There is nothing to do for this step. Please proceed to the next step.<br />
Introduction to <strong>Computer</strong> Applications<br />
<strong>West</strong> <strong>Virginia</strong> <strong>University</strong><br />
Page 2 of 6 Version 8.5<br />
Modified 12/16/2014
HOMEWORK ASSIGNMENT<br />
Microsoft Excel I<br />
Morgantown PRT Usage Problem<br />
e. In column H, calculate the average distance each day using the formula:<br />
[Miles Traveled]<br />
[Service Days]<br />
f. In column I, calculate the average number of passengers per day using<br />
the formula:<br />
[Passengers]<br />
[Service Days]<br />
g. There is nothing to do for this step. Please proceed to the next step.<br />
h. In columns H and I, delete the contents of any cell displaying a divide-byzero<br />
error (#DIV/0). These occur in cases where the PRT was not<br />
operational during the month.<br />
i. We would like to summarize our usage data.<br />
i. There is nothing to do for this step. Please proceed to the next step.<br />
ii. In the total row, individually find the averages for columns B, C, D,<br />
E, H, and I.<br />
iii.<br />
There is nothing to do for this step. Please proceed to the next step.<br />
iv. In the total row, do not display any statistics in columns F and G.<br />
7. We must apply additional formatting to the Usage sheet.<br />
a. Add borders to the cells as indicated below:<br />
i. F3 through F337: left – thick solid line<br />
b. Format the cells as indicated below:<br />
i. B4 through G337: number with no decimal places, display 1000<br />
separator<br />
ii. H4 through I337: number with 1 decimal place, display 1000<br />
separator<br />
c. AutoFit the widths of columns A through I.<br />
d. Apply conditional formatting to the average number of passengers per<br />
day in cells I4 through I336.<br />
i. If the average number of passengers was at least 10,000 (≥ 10000),<br />
change the cell fill color to green and the text color to white.<br />
ii. If the average number of passengers was less than 5,000 (< 5000),<br />
change the fill color to red and the text color to white.<br />
Introduction to <strong>Computer</strong> Applications<br />
<strong>West</strong> <strong>Virginia</strong> <strong>University</strong><br />
Page 3 of 6 Version 8.5<br />
Modified 12/16/2014
HOMEWORK ASSIGNMENT<br />
Microsoft Excel I<br />
Morgantown PRT Usage Problem<br />
8. We must import the PRT availability data into the Availability sheet.<br />
Using the DATA ribbon, import the data from availability.xml and place it<br />
starting in cell A3. Excel will have to create a schema based on the XML<br />
source data. The data will be imported as an XML table.<br />
9. We also wish to apply some formatting to the Availability sheet.<br />
a. Insert one new table column to the right of column F.<br />
b. Enter text in the cells as indicated below:<br />
i. A1: PRT Availability<br />
ii.<br />
G3: Average Downtime Duration<br />
c. Merge (but do not center) cells A1 through G1.<br />
d. Apply the Title formatting style to cell A1.<br />
e. Format the table using a style of your choice other than the default table<br />
style.<br />
10. On the Availability sheet, we wish to calculate availability statistics.<br />
a. In column G, calculate the average downtime duration using the formula:<br />
([Scheduled Hours] − [Operated Hours])<br />
[Downtime Events]<br />
b. In column G, delete the contents of any cell displaying a divide-by-zero<br />
error (#DIV/0). These occur in cases where there were no downtime<br />
events.<br />
11. We must apply additional formatting to the Availability sheet.<br />
a. Format the cells as indicated below:<br />
i. B4 through C336: percentage with 1 decimal place<br />
ii.<br />
iii.<br />
iv.<br />
D4 through E336: number with 1 decimal place<br />
F4 through F336: number with no decimal places<br />
G4 through G336: number with 2 decimal places<br />
b. AutoFit the widths of columns A through G.<br />
12. We need to setup the Analysis Questions sheet so that it can store responses<br />
to the analysis questions.<br />
a. Enter text in the cells as indicated below:<br />
i. A1: Question Number<br />
ii.<br />
B1: Response<br />
b. Bold the contents of row 1.<br />
Introduction to <strong>Computer</strong> Applications<br />
<strong>West</strong> <strong>Virginia</strong> <strong>University</strong><br />
Page 4 of 6 Version 8.5<br />
Modified 12/16/2014
Introduction to <strong>Computer</strong> Applications<br />
<strong>West</strong> <strong>Virginia</strong> <strong>University</strong><br />
HOMEWORK ASSIGNMENT<br />
Microsoft Excel I<br />
Morgantown PRT Usage Problem<br />
c. AutoFit the width of column A. Set the width of column B to 100.<br />
d. Set the height for rows 2 through 5 to 110.<br />
e. Change the vertical alignment setting for columns A and B so that the<br />
text is displayed at the top of each row.<br />
f. Turn on text wrapping for column B.<br />
13. Beginning in cell B2 on the Analysis Questions sheet, type your answers to four<br />
of the five below questions. Respond to one question per row and indicate<br />
which question you are answering in column A.<br />
a. In recent years, system dependability has tended to be worse in the<br />
winter than in other times of the year. Why might this be the case?<br />
b. There are normally more passengers riding the PRT during Fall semesters<br />
than Spring semesters. Why might this be the case?<br />
c. During high usage periods, PRT cars travel directly from one station to<br />
another while bypassing intermediate stations. During lower usage<br />
periods on nights, weekends, and summers, however, it operates as a<br />
circulator and stops at each station. What might be an advantage to this<br />
circulator mode?<br />
d. System dependability measures the percentage of time that the PRT was<br />
functioning as designed. Trip reliability refers to the likelihood that a trip<br />
between stations would finish without encountering problems. Why is the<br />
trip reliability so much better than the system dependability?<br />
e. Currently, PRT riders who are not WVU students or employees must pay<br />
$0.50 per trip. Assume that this charge was eliminated. Aside from not<br />
receiving the $0.50 for each trip, what might be the financial impact of<br />
this change?<br />
Curriculum Information<br />
Project Type<br />
Microsoft Excel spreadsheet<br />
Relationship to GEC Objective 2<br />
In this assignment, students perform data management and analysis on statistics<br />
related to the Morgantown PRT. They explore the data to understand usage trends<br />
and the reasons for them, as well as possible impacts of changing PRT operations.<br />
Relationship to GEC Objective 4<br />
The PRT provides WVU students with a cost-efficient alternative to traveling<br />
between the various campuses. The PRT and public transit usage in general has a<br />
variety of spin-off effects on the Morgantown area. In this problem, students try to<br />
Page 5 of 6 Version 8.5<br />
Modified 12/16/2014
HOMEWORK ASSIGNMENT<br />
Microsoft Excel I<br />
Morgantown PRT Usage Problem<br />
understand how the PRT is used now and how it could be more effectively applied<br />
to help improve transportation in the community.<br />
Grading Rubric<br />
This project is worth 50 points and will be graded based upon the following<br />
components. The instructor may adjust the below values as he or she feels<br />
appropriate:<br />
Steps 3a-c 1.5 points total Steps 7d(i)-(ii) 4 points total<br />
Step 4 2.5 points Step 8 2.5 points<br />
Steps 5a-f 3 points total Steps 9a-e 3 points total<br />
Steps 6a-d 5 points total Steps 10a-b 3.5 points total<br />
Steps 6e-h 5 points total Steps 11a-b 1.5 points total<br />
Steps 6i(i)-(iv) 3.5 points total Steps 12a-f 3 points total<br />
Steps 7a-c 2 points total Steps 13a-e (pick 4 of 5) 2.5 points each<br />
Acknowledgments<br />
The image in the introduction appears courtesy of Sean Marshall [1].<br />
References<br />
[1] S. Marshall, PRT 3. 2008. Available:<br />
https://www.flickr.com/photos/7119320@N05/3057888160.<br />
Introduction to <strong>Computer</strong> Applications<br />
<strong>West</strong> <strong>Virginia</strong> <strong>University</strong><br />
Page 6 of 6 Version 8.5<br />
Modified 12/16/2014