Instructions - Computer Science 101 - West Virginia University
Instructions - Computer Science 101 - West Virginia University
Instructions - Computer Science 101 - West Virginia University
You also want an ePaper? Increase the reach of your titles
YUMPU automatically turns print PDFs into web optimized ePapers that Google loves.
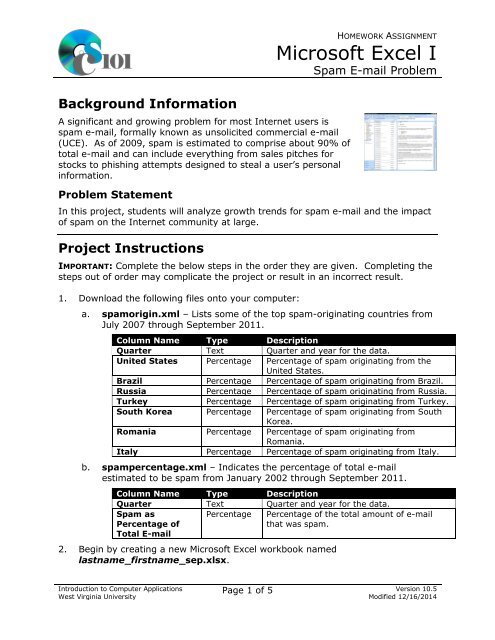
Background Information<br />
A significant and growing problem for most Internet users is<br />
spam e-mail, formally known as unsolicited commercial e-mail<br />
(UCE). As of 2009, spam is estimated to comprise about 90% of<br />
total e-mail and can include everything from sales pitches for<br />
stocks to phishing attempts designed to steal a user’s personal<br />
information.<br />
Problem Statement<br />
HOMEWORK ASSIGNMENT<br />
Microsoft Excel I<br />
Spam E-mail Problem<br />
In this project, students will analyze growth trends for spam e-mail and the impact<br />
of spam on the Internet community at large.<br />
Project <strong>Instructions</strong><br />
IMPORTANT: Complete the below steps in the order they are given. Completing the<br />
steps out of order may complicate the project or result in an incorrect result.<br />
1. Download the following files onto your computer:<br />
a. spamorigin.xml – Lists some of the top spam-originating countries from<br />
July 2007 through September 2011.<br />
Column Name Type Description<br />
Quarter Text Quarter and year for the data.<br />
United States Percentage Percentage of spam originating from the<br />
United States.<br />
Brazil Percentage Percentage of spam originating from Brazil.<br />
Russia Percentage Percentage of spam originating from Russia.<br />
Turkey Percentage Percentage of spam originating from Turkey.<br />
South Korea Percentage Percentage of spam originating from South<br />
Korea.<br />
Romania Percentage Percentage of spam originating from<br />
Romania.<br />
Italy Percentage Percentage of spam originating from Italy.<br />
b. spampercentage.xml – Indicates the percentage of total e-mail<br />
estimated to be spam from January 2002 through September 2011.<br />
Column Name Type Description<br />
Quarter Text Quarter and year for the data.<br />
Spam as<br />
Percentage of<br />
Total E-mail<br />
Percentage Percentage of the total amount of e-mail<br />
that was spam.<br />
2. Begin by creating a new Microsoft Excel workbook named<br />
lastname_firstname_sep.xlsx.<br />
Introduction to <strong>Computer</strong> Applications<br />
<strong>West</strong> <strong>Virginia</strong> <strong>University</strong><br />
Page 1 of 5 Version 10.5<br />
Modified 12/16/2014
3. We must adjust the sheets in our workbook.<br />
a. Rename Sheet1 to Spam Percentages .<br />
b. Add a new sheet named Spam Origin .<br />
c. Add a new sheet named Analysis Questions .<br />
HOMEWORK ASSIGNMENT<br />
Microsoft Excel I<br />
Spam E-mail Problem<br />
4. We must import the spam e-mail percentage data into the Spam Percentages<br />
sheet.<br />
Using the DATA ribbon, import the data from spampercentage.xml and place<br />
it starting in cell A3. Excel will have to create a schema based on the XML<br />
source data. The data will be imported as an XML table.<br />
5. We wish to apply some additional formatting to the Spam Percentages sheet.<br />
a. Insert two new table columns to the right of column B.<br />
b. For the table, turn on the Total Row option.<br />
c. Enter text in the cells as indicated below.<br />
i. A1: Spam Percentage of Total E-mails - Firstname Lastname<br />
ii.<br />
iii.<br />
iv.<br />
C3: Spam Percentage Rank<br />
D3: Change Since Previous Quarter<br />
A43: Median<br />
d. Merge-and-center cells A1 through D1.<br />
e. Set the font size to 16-point for cell A1.<br />
f. Format the table using a style of your choice other than the default table<br />
style.<br />
6. We need to perform some additional calculations to analyze the Spam<br />
Percentages sheet data.<br />
a. There is nothing to do for this step. Please proceed to the next step.<br />
b. In column C, use the RANK() function to rank each quarter by the<br />
percentage of total mail that was spam.<br />
c. There is nothing to do for this step. Please proceed to the next step.<br />
d. There is nothing to do for this step. Please proceed to the next step.<br />
e. In cells D5 through D42, calculate the quarterly rate of change in the<br />
percentage of total e-mail that was spam using the formula:<br />
[Current Quarter Percentage]<br />
(<br />
[Previous Quarter Percentage] ) − 1<br />
f. There is nothing to do for this step. Please proceed to the next step.<br />
Introduction to <strong>Computer</strong> Applications<br />
<strong>West</strong> <strong>Virginia</strong> <strong>University</strong><br />
Page 2 of 5 Version 10.5<br />
Modified 12/16/2014
HOMEWORK ASSIGNMENT<br />
Microsoft Excel I<br />
Spam E-mail Problem<br />
g. There is nothing to do for this step. Please proceed to the next step.<br />
h. Since there is no quarter prior to First Quarter 2002 for comparison, in<br />
cell D4 specify the rate of change as 0.0%.<br />
i. We would like to summarize our spam percentage data.<br />
i. There is nothing to do for this step. Please proceed to the next<br />
step.<br />
ii.<br />
There is nothing to do for this step. Please proceed to the next<br />
step.<br />
iii. In the total row, individually find the medians for columns B and D.<br />
iv. In the total row, do not display any statistics in column C.<br />
7. We must apply additional formatting to the Spam Percentages sheet.<br />
a. Add borders to the cells as indicated below:<br />
i. C3 through C43: left – thick solid line<br />
b. Format the cells as indicated below:<br />
i. B4 through B43: percentage with 1 decimal place<br />
ii.<br />
iii.<br />
C4 through C43: number with no decimal places<br />
D4 through D43: percentage with 1 decimal place<br />
c. AutoFit the widths of columns A through D.<br />
d. Apply conditional formatting to the rates of change in cells D4 through<br />
D42.<br />
i. If the spam percentage decreased by at least 1% (≤ −0.01), change<br />
the cell fill color to green and the text color to white.<br />
ii.<br />
If the spam percentage increased by at least 25% (≥ 0.25), change<br />
the fill color to red and the text color to white.<br />
8. We must import the spam origin data into the Spam Origin sheet.<br />
Using the DATA ribbon, import the data from spamorigin.xml and place it<br />
starting in cell A3. Excel will have to create a schema based on the XML<br />
source data. The data will be imported as an XML table.<br />
9. We also wish to apply some formatting to the Spam Origin sheet.<br />
a. Insert one new table column to the right of column H.<br />
b. Enter text in the cells as indicated below:<br />
i. A1: Spam by Country of Origin<br />
ii.<br />
I3: Others<br />
Introduction to <strong>Computer</strong> Applications<br />
<strong>West</strong> <strong>Virginia</strong> <strong>University</strong><br />
Page 3 of 5 Version 10.5<br />
Modified 12/16/2014
c. Merge (but do not center) cells A1 through I1.<br />
d. Apply the Title formatting style to cell A1.<br />
HOMEWORK ASSIGNMENT<br />
Microsoft Excel I<br />
Spam E-mail Problem<br />
e. Format the table using a style of your choice other than the default table<br />
style.<br />
10. On the Spam Origin sheet, we wish to calculate statistics for the origin of the<br />
spam messages.<br />
a. In column I, write a formula to calculate the percentage of spam<br />
originating in countries other than those in columns B through H. Your<br />
formula must use the SUM() function.<br />
b. There is nothing to do for this step. Please proceed to the next step.<br />
11. We must apply additional formatting to the Spam Origin sheet.<br />
a. Format the cells as indicated below:<br />
i. B4 through I20: percentage with no decimal places<br />
b. AutoFit the widths of columns A through G.<br />
12. We need to set up the Analysis Questions sheet so that it can store responses<br />
to the analysis questions.<br />
a. Enter text in the cells as indicated below:<br />
i. A1: Question Number<br />
ii.<br />
B1: Response<br />
b. Bold the contents of row 1.<br />
c. AutoFit the width of column A. Set the width of column B to 100.<br />
d. Set the height for rows 2 through 5 to 110.<br />
e. Change the vertical alignment setting for columns A and B so that the<br />
text is displayed at the top of each row.<br />
f. Turn on text wrapping for column B.<br />
13. Beginning in cell B2 on the Analysis Questions sheet, type your answers to four<br />
of the five below questions. Respond to one question per row and indicate<br />
which question you are answering in column A.<br />
a. The rate of spam as a percentage of total e-mail has been fairly stable<br />
(around 80%-90%) since mid-2004. Why do you think the rate stabilized<br />
rather than continuing its previous growth trend?<br />
b. The percentage of spam originating in the United States fell by more than<br />
half from 2004 to 2009. What reasons might have led to the decline of<br />
U.S.-originated spam?<br />
Introduction to <strong>Computer</strong> Applications<br />
<strong>West</strong> <strong>Virginia</strong> <strong>University</strong><br />
Page 4 of 5 Version 10.5<br />
Modified 12/16/2014
HOMEWORK ASSIGNMENT<br />
Microsoft Excel I<br />
Spam E-mail Problem<br />
c. One common method of filtering for spam is to look for messages<br />
containing certain keywords. What is one potential disadvantageous sideeffect<br />
of this method and how could it be minimized?<br />
d. Many spam messages originate from “zombie” computers, which are<br />
computers infected with viruses (malicious programs) designed to send<br />
spam. What advantages might a spammer obtain from having a network<br />
of zombie computers?<br />
e. Romania appeared on the list as one of the top 12 countries originating<br />
spam messages in Third Quarter 2007 and again starting First Quarter<br />
2010. Is there any significance to it not appearing on the list between<br />
late 2007 and 2009?<br />
Curriculum Information<br />
Project Type<br />
Microsoft Excel spreadsheet<br />
Relationship to GEC Objective 2<br />
In this assignment, students learn how they can use formulas and functions in<br />
Microsoft Excel to perform basic statistical and data analysis. As a part of this, they<br />
write algebraic formulas to determine the annual rate of change. Students also<br />
explore the relationship between sample size and percentage changes.<br />
Relationship to GEC Objective 4<br />
Spam e-mail has become a growing problem in the modern world. Currently over<br />
80% of all e-mail is estimated to be junk mail, imposing significant costs upon the<br />
average user. In this project, students explore how spam has grown, how it can be<br />
combated, and learn more about the cost of spam.<br />
Grading Rubric<br />
This project is worth 50 points and will be graded based upon the following<br />
components. The instructor may adjust the below values as he or she feels<br />
appropriate:<br />
Steps 3a-c 1.5 points total Steps 7d(i)-(ii) 4 points total<br />
Step 4 2.5 points Step 8 2.5 points<br />
Steps 5a-f 3 points total Steps 9a-e 3 points total<br />
Steps 6a-d 5 points total Steps 10a-b 3.5 points total<br />
Steps 6e-h 5 points total Steps 11a-b 1.5 points total<br />
Steps 6i(i)-(iv) 3.5 points total Steps 12a-f 3 points total<br />
Steps 7a-c 2 points total Steps 13a-e (pick 4 of 5) 2.5 points each<br />
Introduction to <strong>Computer</strong> Applications<br />
<strong>West</strong> <strong>Virginia</strong> <strong>University</strong><br />
Page 5 of 5 Version 10.5<br />
Modified 12/16/2014


