Guidelines for Gender Equality Programmes in Science - GeNet
Guidelines for Gender Equality Programmes in Science - GeNet
Guidelines for Gender Equality Programmes in Science - GeNet

You also want an ePaper? Increase the reach of your titles
YUMPU automatically turns print PDFs into web optimized ePapers that Google loves.
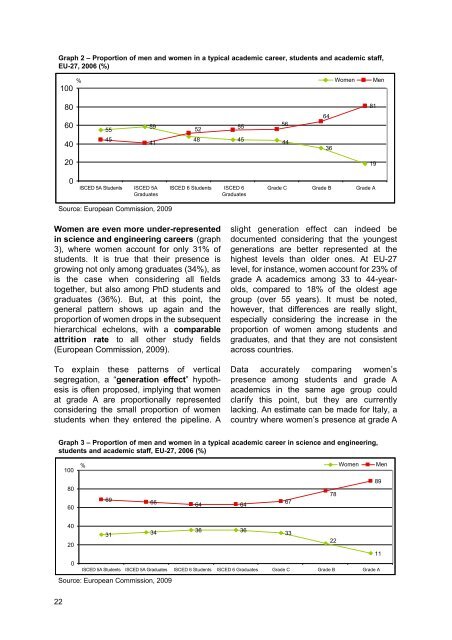
Graph 2 – Proportion of men and women <strong>in</strong> a typical academic career, students and academic staff,<br />
EU-27, 2006 (%)<br />
100<br />
%<br />
Women<br />
Men<br />
80<br />
60<br />
40<br />
55<br />
45<br />
59<br />
41<br />
52<br />
48<br />
55<br />
45<br />
56<br />
44<br />
64<br />
36<br />
81<br />
20<br />
19<br />
0<br />
ISCED 5A Students<br />
ISCED 5A<br />
Graduates<br />
ISCED 6 Students ISCED 6<br />
Graduates<br />
Grade C Grade B Grade A<br />
Source: European Commission, 2009<br />
Women are even more under-represented<br />
<strong>in</strong> science and eng<strong>in</strong>eer<strong>in</strong>g careers (graph<br />
3), where women account <strong>for</strong> only 31% of<br />
students. It is true that their presence is<br />
grow<strong>in</strong>g not only among graduates (34%), as<br />
is the case when consider<strong>in</strong>g all fields<br />
together, but also among PhD students and<br />
graduates (36%). But, at this po<strong>in</strong>t, the<br />
general pattern shows up aga<strong>in</strong> and the<br />
proportion of women drops <strong>in</strong> the subsequent<br />
hierarchical echelons, with a comparable<br />
attrition rate to all other study fields<br />
(European Commission, 2009).<br />
To expla<strong>in</strong> these patterns of vertical<br />
segregation, a “generation effect” hypothesis<br />
is often proposed, imply<strong>in</strong>g that women<br />
at grade A are proportionally represented<br />
consider<strong>in</strong>g the small proportion of women<br />
students when they entered the pipel<strong>in</strong>e. A<br />
slight generation effect can <strong>in</strong>deed be<br />
documented consider<strong>in</strong>g that the youngest<br />
generations are better represented at the<br />
highest levels than older ones. At EU-27<br />
level, <strong>for</strong> <strong>in</strong>stance, women account <strong>for</strong> 23% of<br />
grade A academics among 33 to 44-yearolds,<br />
compared to 18% of the oldest age<br />
group (over 55 years). It must be noted,<br />
however, that differences are really slight,<br />
especially consider<strong>in</strong>g the <strong>in</strong>crease <strong>in</strong> the<br />
proportion of women among students and<br />
graduates, and that they are not consistent<br />
across countries.<br />
Data accurately compar<strong>in</strong>g women’s<br />
presence among students and grade A<br />
academics <strong>in</strong> the same age group could<br />
clarify this po<strong>in</strong>t, but they are currently<br />
lack<strong>in</strong>g. An estimate can be made <strong>for</strong> Italy, a<br />
country where women’s presence at grade A<br />
Graph 3 – Proportion of men and women <strong>in</strong> a typical academic career <strong>in</strong> science and eng<strong>in</strong>eer<strong>in</strong>g,<br />
students and academic staff, EU-27, 2006 (%)<br />
100<br />
%<br />
Women<br />
Men<br />
80<br />
60<br />
69<br />
66 64 64<br />
67<br />
78<br />
89<br />
40<br />
34 36 36<br />
31<br />
33<br />
22<br />
20<br />
11<br />
0<br />
ISCED 5A Students ISCED 5A Graduates ISCED 6 Students ISCED 6 Graduates Grade C Grade B Grade A<br />
Source: European Commission, 2009<br />
22