Filter Design
Filter Design
Filter Design

You also want an ePaper? Increase the reach of your titles
YUMPU automatically turns print PDFs into web optimized ePapers that Google loves.
Circuits 212 Lab<br />
Lab #6<br />
<strong>Filter</strong> <strong>Design</strong><br />
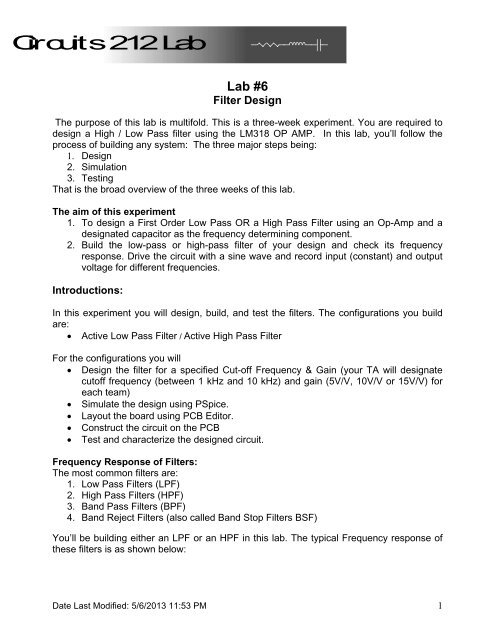
The purpose of this lab is multifold. This is a three-week experiment. You are required to<br />
design a High / Low Pass filter using the LM318 OP AMP. In this lab, you’ll follow the<br />
process of building any system: The three major steps being:<br />
1. <strong>Design</strong><br />
2. Simulation<br />
3. Testing<br />
That is the broad overview of the three weeks of this lab.<br />
The aim of this experiment<br />
1. To design a First Order Low Pass OR a High Pass <strong>Filter</strong> using an Op-Amp and a<br />
designated capacitor as the frequency determining component.<br />
2. Build the low-pass or high-pass filter of your design and check its frequency<br />
response. Drive the circuit with a sine wave and record input (constant) and output<br />
voltage for different frequencies.<br />
Introductions:<br />
In this experiment you will design, build, and test the filters. The configurations you build<br />
are:<br />
Active Low Pass <strong>Filter</strong> / Active High Pass <strong>Filter</strong><br />
For the configurations you will<br />
<strong>Design</strong> the filter for a specified Cut-off Frequency & Gain (your TA will designate<br />
cutoff frequency (between 1 kHz and 10 kHz) and gain (5V/V, 10V/V or 15V/V) for<br />
each team)<br />
Simulate the design using PSpice.<br />
Layout the board using PCB Editor.<br />
Construct the circuit on the PCB<br />
Test and characterize the designed circuit.<br />
Frequency Response of <strong>Filter</strong>s:<br />
The most common filters are:<br />
1. Low Pass <strong>Filter</strong>s (LPF)<br />
2. High Pass <strong>Filter</strong>s (HPF)<br />
3. Band Pass <strong>Filter</strong>s (BPF)<br />
4. Band Reject <strong>Filter</strong>s (also called Band Stop <strong>Filter</strong>s BSF)<br />
You’ll be building either an LPF or an HPF in this lab. The typical Frequency response of<br />
these filters is as shown below:<br />
Date Last Modified: 5/6/2013 11:53 PM 1
Components Required for the Lab:<br />
These are your design constraints for this Lab: You are required to use the LM318<br />
Operational Amplifier, and the 0.22uF capacitor as one of the two frequency determining<br />
components. All other resistor & capacitor values are determined by your design<br />
calculations, but you may only use standard value components in the EECS Shop.<br />
Standard Values will be discussed in the lab.<br />
Circuit Diagram:<br />
Your circuit configuration looks something like this:<br />
Low Pass<br />
Date Last Modified: 5/6/2013 11:53 PM 2
HIGH PASS<br />
Note that the op-amp is used in its non-inverting mode (the input is connected to pin 3).<br />
The resistor-capacitor configuration between the input and the op-amp's non-inverting<br />
input provides the desired filtering.<br />
Procedure:<br />
Week 1:<br />
1. <strong>Design</strong> a <strong>Filter</strong> for the given Cut-off Frequency and Gain. The Relevant Equations<br />
for both Low pass & High pass circuits are:<br />
Gain: = 1 + R F / R G<br />
Cut off Frequency = 1 / (2 π RC)<br />
Note: Use C = 0.22uF for the capacitor in the filter network.<br />
Select R F and R G between 1 [k] and 50 [k]. If R F and R G are less than 100<br />
[] (chosen to be 1 [k] or greater for a safety margin) too much current will flow<br />
through the feedback loop, and the LM 318 will be damaged. If R F and R G are<br />
greater than 50 [k] not enough current will flow through the feedback loop, and<br />
will invalidate some of the other practical assumptions of the LM 318.<br />
Date Last Modified: 5/6/2013 11:53 PM 3
2. Simulate the circuit that you designed in PSpice. Use appropriate standard values<br />
of resistors. Be careful to only pick values available in the EECS shop. Determine<br />
the power supply filter capacitors by looking at the LM 318 datasheet on the lab<br />
website. Follow the steps below to create the circuit simulation. If you do not<br />
follow the steps below the simulation will work, but the circuit will not<br />
transfer to PCB Editor correctly.<br />
Creating your Circuit Schematic in Allegro <strong>Design</strong> Entry CIS (PSpice) so it is<br />
compatible with PCB Editor<br />
a. Create a new “Analog or Mixed A/D” blank project.<br />
b. Select and delete all libraries currently in the “Libraries” field. The only library<br />
left will be the <strong>Design</strong> Cache (because it may not be deleted), but do not use<br />
any of its parts.<br />
→<br />
c. Add the libraries located in the following folder:<br />
P:\Cadence\SPB_16.3\tools\capture\library\pspice\EECS libs<br />
→<br />
d. Create your schematic for simulation using the components in this folder.<br />
The recommended components are:<br />
Resistor – R/ANALOG<br />
Capacitor – C disc/ANALOG<br />
OP Amp – LM318<br />
Date Last Modified: 5/6/2013 11:53 PM 4
3. Bias the op-amp with a ±12 V supply. Apply an AC signal of 1Vpp to the Input.<br />
4. Obtain the Frequency Response (the Bode Plot – magnitude and phase) of the<br />
filter using PSpice.<br />
5. After you have completed steps 1 through 5 and you have been approved by your<br />
TA order your components from the EECS shop. YOU ARE REQUIRED TO<br />
SAVE A RECORD OF YOUR ORDERED PARTS LIST TO BE SUBMITTED IN<br />
THE LAB REPORT. Once you have ordered your components you may pick up<br />
the components next week before lab, or whenever the EECS shop has them<br />
finished (The EECS shop will probably not have your order finished the same day<br />
you submit the order).<br />
6. Once the circuit has been analyzed using PSpice, the schematic must be modified<br />
for fabrication before proceeding to PCB Editor. Test Points need to be inserted at<br />
the input, output and at the two supply voltage pins. These test points allow a<br />
convenient point to attach probes for sources and test measurement. TPs are<br />
available in the connector library. Below is an illustration of using test points on<br />
an “example” circuit.<br />
**Note that the above circuit is just an example.<br />
**<br />
Vac_+<br />
V_DC_Supply _5Vdc_+<br />
1Vac<br />
0Vdc<br />
1<br />
TEST POINT<br />
1<br />
TEST POINT<br />
5Vdc<br />
1<br />
1<br />
TEST POINT<br />
TEST POINT<br />
V_DC_Supply _5Vdc_-<br />
Vac_-<br />
7. After your simulation circuit has been modified with test points, create the PCB<br />
Layout using the LP/HP filter circuit you have already developed in PSpice. Refer<br />
to the Circuit Board Fabrication Tutorial for 212 Lab handout to create the PCB<br />
Layout of the circuit. This must be completed before the start of Week 2.<br />
Date Last Modified: 5/6/2013 11:53 PM 5
Week 2:<br />
1. Once trace routing is completed, print your circuit onto the Toner Transfer<br />
Paper (without the SST layer) and transfer it on to the circuit board using the<br />
fuser.<br />
**<br />
**Note the board layout above is a depiction of the previous example circuit.<br />
2. Etch the boards in the Sodium Persulphate tank to remove excess copper,<br />
leaving the desired traces.<br />
3. Remove any excess toner left on traces and pads. Carefully drill holes<br />
wherever required. Use safety glasses when drilling.<br />
4. You are advised, but not required to build your circuit on a breadboard before<br />
you solder your components, and test its characteristics.<br />
5. If you finish Week 2 early you are highly advised to start Week 3.<br />
Week 3:<br />
1. Solder the components on your PCB to build your circuit.<br />
2. Apply an input sine wave of 1 KHz, 1Vpp to the input and plot the output signal.<br />
3. Measure the frequency response of the amplifier from 100 Hz to 100 kHz by<br />
measuring the output amplitude for different frequencies of the input sine wave.<br />
Date Last Modified: 5/6/2013 11:53 PM 6
Observations<br />
Table: <strong>Filter</strong> gain versus frequency<br />
Frequency<br />
[kHz]<br />
Vin<br />
[V]<br />
Vout<br />
[V]<br />
0.1<br />
0.2<br />
0.5<br />
0.75<br />
1<br />
2<br />
3<br />
4<br />
5<br />
6<br />
7<br />
8<br />
9<br />
10<br />
15<br />
20<br />
50<br />
100<br />
Gain<br />
[V/V]<br />
Gain [dB] =<br />
20log 10 |Vout/Vin|<br />
1. Use your experimentally measured values to plot the magnitude of the Gain [dB]<br />
( | |) of the frequency response (the Bode plot) with Excel. Plot the<br />
magnitude (on a linear scale) on the ordinate axis and frequency (on a log scale) on<br />
the abscissa axis. This is the magnitude portion of the Bode plot.<br />
2. Use your experimentally measured values to plot the Gain [V/V] ( ) with Excel.<br />
Plot the magnitude (on a log scale) on the ordinate axis and frequency (on a log<br />
scale) on the abscissa axis.<br />
3. Compare the plot of of your experimentally measured values to your PSpice<br />
simulation of of the circuit. Or, you may compare the plot of | | of<br />
your experimentally measured values to your PSpice simulation of | |.<br />
4. You are required to include the following PSpice plots:<br />
a) (log scale) vs. frequency (log scale)<br />
b) | | (linear scale) vs. frequency (log scale)<br />
i. Consult Prelab 5 for how to plot | | in PSpice.<br />
5. Determine the cut off frequency from the plot of | | (linear scale) vs.<br />
frequency (log scale) and compare it to the theoretical value.<br />
6. Compare the actual and theoretical 20 Log (1 + R F /R G ) pass band gains.<br />
Date Last Modified: 5/6/2013 11:53 PM 7