Employment Changes in US Food Manufacturing - Coalition for ...
Employment Changes in US Food Manufacturing - Coalition for ...
Employment Changes in US Food Manufacturing - Coalition for ...

Create successful ePaper yourself
Turn your PDF publications into a flip-book with our unique Google optimized e-Paper software.
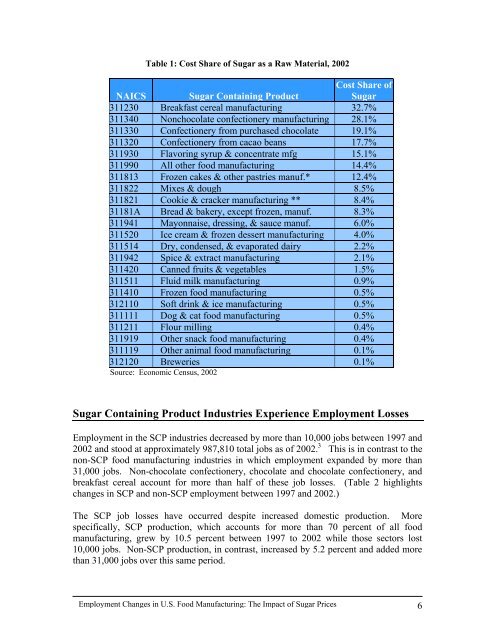
Table 1: Cost Share of Sugar as a Raw Material, 2002<br />
NAICS Sugar Conta<strong>in</strong><strong>in</strong>g Product<br />
Cost Share of<br />
Sugar<br />
311230 Breakfast cereal manufactur<strong>in</strong>g 32.7%<br />
311340 Nonchocolate confectionery manufactur<strong>in</strong>g 28.1%<br />
311330 Confectionery from purchased chocolate 19.1%<br />
311320 Confectionery from cacao beans 17.7%<br />
311930 Flavor<strong>in</strong>g syrup & concentrate mfg 15.1%<br />
311990 All other food manufactur<strong>in</strong>g 14.4%<br />
311813 Frozen cakes & other pastries manuf.* 12.4%<br />
311822 Mixes & dough 8.5%<br />
311821 Cookie & cracker manufactur<strong>in</strong>g ** 8.4%<br />
31181A Bread & bakery, except frozen, manuf. 8.3%<br />
311941 Mayonnaise, dress<strong>in</strong>g, & sauce manuf. 6.0%<br />
311520 Ice cream & frozen dessert manufactur<strong>in</strong>g 4.0%<br />
311514 Dry, condensed, & evaporated dairy 2.2%<br />
311942 Spice & extract manufactur<strong>in</strong>g 2.1%<br />
311420 Canned fruits & vegetables 1.5%<br />
311511 Fluid milk manufactur<strong>in</strong>g 0.9%<br />
311410 Frozen food manufactur<strong>in</strong>g 0.5%<br />
312110 Soft dr<strong>in</strong>k & ice manufactur<strong>in</strong>g 0.5%<br />
311111 Dog & cat food manufactur<strong>in</strong>g 0.5%<br />
311211 Flour mill<strong>in</strong>g 0.4%<br />
311919 Other snack food manufactur<strong>in</strong>g 0.4%<br />
311119 Other animal food manufactur<strong>in</strong>g 0.1%<br />
312120 Breweries 0.1%<br />
Source: Economic Census, 2002<br />
Sugar Conta<strong>in</strong><strong>in</strong>g Product Industries Experience <strong>Employment</strong> Losses<br />
<strong>Employment</strong> <strong>in</strong> the SCP <strong>in</strong>dustries decreased by more than 10,000 jobs between 1997 and<br />
2002 and stood at approximately 987,810 total jobs as of 2002. 3 This is <strong>in</strong> contrast to the<br />
non-SCP food manufactur<strong>in</strong>g <strong>in</strong>dustries <strong>in</strong> which employment expanded by more than<br />
31,000 jobs. Non-chocolate confectionery, chocolate and chocolate confectionery, and<br />
breakfast cereal account <strong>for</strong> more than half of these job losses. (Table 2 highlights<br />
changes <strong>in</strong> SCP and non-SCP employment between 1997 and 2002.)<br />
The SCP job losses have occurred despite <strong>in</strong>creased domestic production. More<br />
specifically, SCP production, which accounts <strong>for</strong> more than 70 percent of all food<br />
manufactur<strong>in</strong>g, grew by 10.5 percent between 1997 to 2002 while those sectors lost<br />
10,000 jobs. Non-SCP production, <strong>in</strong> contrast, <strong>in</strong>creased by 5.2 percent and added more<br />
than 31,000 jobs over this same period.<br />
<strong>Employment</strong> <strong>Changes</strong> <strong>in</strong> U.S. <strong>Food</strong> Manufactur<strong>in</strong>g: The Impact of Sugar Prices 6