Transport
Transport
Transport

You also want an ePaper? Increase the reach of your titles
YUMPU automatically turns print PDFs into web optimized ePapers that Google loves.
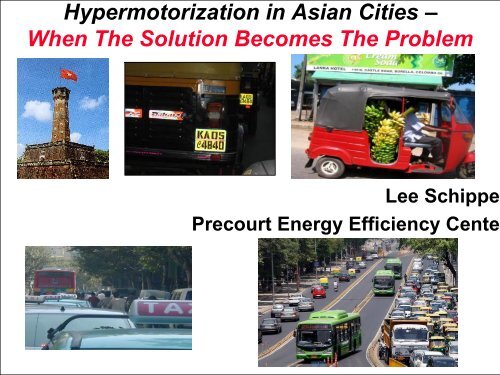
Hypermotorization in Asian Cities –<br />
When The Solution Becomes The Problem<br />
Lee Schippe<br />
Precourt Energy Efficiency Cente<br />
1<br />
1
Precourt Energy Efficiency Center (PEEC)<br />
Stanford University<br />
• A research and analysis institute at Stanford<br />
• Established in October 2006<br />
• Initial funding: $30 million pledge by Jay Precourt<br />
• Now PEEC Part of the Larger Precourt institute<br />
• Mission – Keep our PEECers Up<br />
– To improve opportunities for and implementation of<br />
energy efficient technologies, systems, and practices,<br />
with an emphasis on economically attractive<br />
deployment<br />
– Focus on the demand side of energy markets<br />
– Energy efficiency: economically efficient reductions<br />
in energy use (or energy intensity)<br />
2
Knee-Jakarta Reaction to Mal-Asia?<br />
Schipper PEEC<br />
Stanford<br />
3
Asia: lumbering into modernity<br />
Schipper PEEC Stanford<br />
4
Schipper PEEC Stanford<br />
5
Schipper PEEC Stanford<br />
6
Congestion or Access?<br />
7
Better Urban <strong>Transport</strong>: Choice or Choke?<br />
8<br />
8
How Sustainable <strong>Transport</strong><br />
Serves, not Severs, Urban Development<br />
• Economic Sustainability<br />
– Affordable to users and authorities<br />
– Attractive as a business<br />
– Each mode bears social costs<br />
• Social Sustainability<br />
– Promotes access for all, not just a few<br />
– Makes room for all<br />
– Avoids irreversible binds<br />
• Environmental Sustainability<br />
– Leaves no burdens for future generations<br />
– Minimizes accidents and damage to human health<br />
– Reduces greenhouse gas emissions<br />
Governance - The Roof Over these Pillars<br />
Make and Keep the Rules, Protect the Weak<br />
9<br />
9
<strong>Transport</strong> Most Rapidly Rising CO2 Emission Source<br />
Most of Increase in Developing World<br />
Asia Small but Rising<br />
2<br />
O<br />
C<br />
s<br />
e<br />
n<br />
To<br />
n<br />
M<br />
30000<br />
25000<br />
20000<br />
15000<br />
International Sea and Air Bunkers<br />
China <strong>Transport</strong><br />
Asia excl China <strong>Transport</strong><br />
Rest of World <strong>Transport</strong><br />
Latin American w Mexico <strong>Transport</strong><br />
OECD <strong>Transport</strong><br />
China non‐<strong>Transport</strong><br />
Asia Excl China non‐<strong>Transport</strong><br />
Rest of World non‐transport<br />
Latin America non <strong>Transport</strong><br />
OECD non <strong>Transport</strong><br />
10000<br />
5000<br />
0<br />
1971 1976 1981 1986 1991 1996 2001 2006<br />
10
4 Wheeled Motorization and Economic Growth:<br />
The China Syndrome?<br />
Source: EMBARQ<br />
Key Question: Is this path of motorization good? Inevitable or<br />
11 avoidable?<br />
11
Road <strong>Transport</strong> Emissions Relative to GDP?<br />
India and China Relatively Low<br />
0.18<br />
Kilograms CO2/$US of GDP (2000 PPP)<br />
0.16<br />
0.14<br />
0.12<br />
0.10<br />
0.08<br />
0.06<br />
0.04<br />
0.02<br />
1990<br />
2006<br />
0.00<br />
US, Canada<br />
OECD<br />
Europe<br />
OECD<br />
Pacific<br />
E Europe<br />
LAC w<br />
Mexico<br />
China<br />
India<br />
*<br />
* 1990 figure includes many non-transport uses<br />
12
Light Duty Vehicle Ownership and Income<br />
Again India and China Very Low<br />
LDV/1000 people<br />
800<br />
700<br />
600<br />
500<br />
400<br />
300<br />
200<br />
36.26<br />
25.64<br />
Light Duty Vehicles/Capita<br />
Light Duty Vehicles/$1mn of GDP<br />
GDP/Capita, US$ 2000 PPP<br />
22.68<br />
10.12<br />
7.63<br />
6.15<br />
40<br />
35<br />
30<br />
25<br />
20<br />
15<br />
10<br />
LDV/$Mn GDP (2000 PPP)<br />
100<br />
3.07<br />
5<br />
0<br />
0<br />
US, Canada<br />
OECD Europe<br />
OECD Pacific<br />
E Europe<br />
LAC w Mexico<br />
China<br />
India<br />
13
Future CO2 Emissions from <strong>Transport</strong> in Asia<br />
Even After 20% Reduction in Fuel/km, Still Out of control<br />
(Source WBCSD Sustainable Mobility Project)<br />
LDVs out<br />
of control<br />
14
“ASIF” Decomposition<br />
Measuring and Understanding Impacts<br />
Fuel Use<br />
CO2,<br />
Air pollution<br />
Congestion<br />
Accidents<br />
Impacts from<br />
<strong>Transport</strong><br />
G = A * S i * I i * F i,j<br />
Total <strong>Transport</strong><br />
Activity<br />
Veh-km and<br />
pass-km by mode<br />
Emissions per<br />
unit of energy<br />
or volume or km<br />
Technological energy<br />
efficiency<br />
Occupancy/<br />
Load Factor<br />
Modal Energy<br />
Intensity<br />
Vehicle characteristics<br />
Vehicle fuel<br />
intensity<br />
Real drive cycles and routing<br />
Lesson : Attack All Components of <strong>Transport</strong><br />
15
<strong>Transport</strong>- Fuel - CO2 Mitigation: ASIF #1.5<br />
(Activity x Mode Structure x Intensity x Fuel Carbon Content)<br />
Avoid CO2-Intensive<br />
Development:<br />
Singapore Land Use Planning,<br />
Congestion Pricing<br />
Shift and Strengthen:<br />
Ahmedabad<br />
Improve and Mitigate:<br />
Efficient Vehicles<br />
Improve and Mitigate:<br />
True Low Carbon Fuels<br />
16
Reaping Benefits and Co-benefits<br />
Imposing External Costs and Enabling Good <strong>Transport</strong><br />
• Main Social Costs<br />
– Accidents, congestion, air pollution and health, road wear, CO2 etc<br />
– Need stakeholder in puts on different valuations of costs, benefits<br />
– Requires good monitoring of transport activity, emissions, health<br />
• Collecting the Money<br />
– GPS, cell phone/mesh network charging for road use, parking<br />
– Differentiated taxes on fuels (CO2 and quality) and emission controls<br />
– Marginal cost fees on new property development<br />
• Spending<br />
– Money to general funds – avoid hypothecation<br />
– Make projects compete with other social needs (Swedish approach)<br />
– But save some money for equity -- protect weak groups<br />
Nothing Persuades More than Dollars, Rupees, RMB or Dong<br />
We’re Smart Enough to Alleviate Hardship<br />
–18<br />
18
Bus Rapid Transit (BRT) – Mexico’s Metrobus<br />
260,000 people/day over 20km for US $60mn<br />
Lower emissions, CO2, reduced car traffic<br />
19
Metrobus CO2 Changes by Component<br />
Savings roughly 1/3 mode shift, 1/3 parallel traffic, 1/3 bus<br />
switching)<br />
600<br />
550<br />
500<br />
450<br />
400<br />
Source Rogers 2006, 2009<br />
Thousand Tonnes CO2<br />
350<br />
300<br />
250<br />
200<br />
150<br />
100<br />
50<br />
0<br />
Before<br />
After<br />
A. 20 Extra Metrobus<br />
B. Original 70 Metrobus on Route<br />
C. Colectivos and RTP Buses Removed<br />
D. Car Users Shifting to Metrobus<br />
E. Delays to vehicles crossing Insurgentes<br />
F. Additional Distance for Left turns<br />
G. Savings from improved parallel traffic<br />
H. Remaining parallel traffic<br />
20
Benefits from Metrobus: Broad Than Just CO2<br />
<strong>Transport</strong>, Health Benefits >> CO2 Benefits<br />
$25<br />
CO2 reduction in parallel traffic<br />
$20<br />
CO2 reduction, mode shift car to bus<br />
Million $US (2005)<br />
$15<br />
$10<br />
$5<br />
CO2 reduction from bus switch<br />
Fuel savings to parallel traffic<br />
Fuel saving, mode switch car to bus<br />
Fuel Savings from bus switch<br />
Air Pollution/Health Benefits from<br />
lower air pollution<br />
VKt external costs -- reduction in all<br />
traffic<br />
Time Savings of Bus Riders<br />
$0<br />
Low CO2 Value ($5/tonne)<br />
High CO2 Value<br />
($85/tonne)<br />
21
Why Is Asia Special?<br />
•Dozens of Cities over 5 mn, yet Still Urbanizing<br />
• From slums of India and Indonesia to “planned” communities in China<br />
• Incomes rising rapidly with manufacturing, IT<br />
• Intercity travel, freight mostly road (ex India, China rail and now air)<br />
• Car Motorization Low in Most Places<br />
• Two wheeler ownership very high in some places – move to cars soon?<br />
• Vehicle industry just getting started or modernized (India, China)<br />
• 80% of urban trips “outdoors” (feet, m’cycle, bike, bus w/open windows).<br />
•Alternatives Possible?<br />
• Singapore model – regulation and market forces<br />
• Little other experience except transport chaos and air pollution<br />
• Willingness of China to lead? VN two wheeler model? Nano in India?<br />
Asia is Poised to either Continue on EU/US Patterns or<br />
Find a New Path – Does it Exist?<br />
22
Introduction: Basic Thesis about<br />
(Hyper)-Motorization in China/Asia<br />
• Speed of Motorization leaving officials, walkers behind<br />
– Incomprehensible growth rate in car ownership<br />
– Very poor data on use, fuel consumption, etc<br />
– Small motor vehicles in many forms (2-3-4 wheels, “6 seater” etc)<br />
• Little Policy Competency to Slow or Control<br />
– Glory of modern motorization trumping other concerns<br />
– Whole city sections rapidly transformed into asphalt<br />
– Over-reliance on “technology” – human beings not in picture<br />
• “Unintended” (or unknown?) Consequences<br />
– Burgeoning road fatalities (over half walkers, cyclists)<br />
– Air Pollution from vehicles rapidly replacing that from industry<br />
– Congestion now major threat to productivity, well being<br />
Hyper Motorization = Ownership, Use of Private Vehicles<br />
Outruns Public Investment, Human Capacity to Contain Problems<br />
23<br />
23
Hyper-Motorization in Asia:<br />
Longer-Term Consequences<br />
• Congestion means lower speeds, longer trips<br />
– Low road space per vehicle – but dense vehicles/sq km<br />
– Road building won’t help<br />
– Density increases human exposure to emissions, pollution<br />
• Decay of Traditional Modes (bus, rail, feet)<br />
– Clamor for private cars<br />
– Status of car ownership<br />
– Development of car-oriented cities, suburbs, etc<br />
• Hyper-motorization Leaves No Time for Thought<br />
– Present decision makers grew up before cars<br />
– Little planning experience or visualization of future<br />
– No time for fuel and pollution fixes to catch up!<br />
24<br />
24
Dilemma for Developing World: Can Traditional<br />
Four Wheels Provide Real Mobility?<br />
• China<br />
– Ring roads, freeways, and traffic fatalities<br />
– Cities suffering from car oriented development<br />
– Fuel economy standards but skyrocketing car ownership<br />
• India – Motorization Exploding?<br />
– Hectic, polluting mix of hooves, feet, and wheels<br />
– Few cities have organized public transport<br />
– <strong>Transport</strong> very contentious in big cities<br />
• Viet Nam (Hanoi): Bikes of Burden<br />
– 1+ moped/household –works until cars overwhelm<br />
– Bus and rail development could provide backbone<br />
– A sustainable pattern for much of the world?<br />
25
Hypermotorization in China:<br />
Symbol for Much of the World?<br />
• Congestion: Cars, Other Traffic<br />
• Buses and people stuck in traffic<br />
• Building more roads makes problem worse<br />
• Tough policies called for – by whom?<br />
• Air Pollution: Too Many Vehicles<br />
• Enough old smokers to ruin air<br />
• New fuels, vehicles improving<br />
• Emissions from cars could offset<br />
improvements<br />
• Traffic Safety: People First<br />
• Walkers, cyclists main victims<br />
• Too many kinds of traffic in same place,<br />
unequal road space distribution<br />
• More cars and speed will kill more people<br />
26<br />
26
120<br />
Total Carbon Emissions (Mn Tonnes)<br />
The Sustainability Challenge:<br />
Cars and CO 2 Emissions in 2020<br />
Electricity, as Primary Energy<br />
100<br />
100<br />
CNG<br />
80<br />
Oil in Hybrids<br />
80<br />
60<br />
40<br />
20<br />
0<br />
27<br />
27<br />
Oil in Conventional Gasoline Cars<br />
60<br />
CO2 Emissions<br />
40<br />
20<br />
0<br />
2003: Road Ahead<br />
2010<br />
2020<br />
Oil Saved<br />
2010<br />
2020<br />
Integrated <strong>Transport</strong><br />
2010<br />
2020<br />
Sustainable Urban Mobility Saves Cities, Fuel, and<br />
Above all, Greenhouse Gas Emissions<br />
Energy Use for Cars, by source, MTOE
Cheap Two Wheelers,<br />
but No Sidewalks<br />
The Peoples’ Car:<br />
Which People?<br />
28
Scenarios and Assumptions for India*<br />
• Business as Usual (BAU)<br />
– Unconstrained development of road traffic and vehicle demand<br />
– Infrastructure is assumed to not be a constraint<br />
• Energy Efficiency<br />
– Higher fuel efficiency<br />
– 1 Lakh ($2500) car? Efficiency boon or hypermotorization bust?<br />
• Clean Two and Three wheelers<br />
– Cleaner fuels and two and three-wheelers<br />
– Increases in two and three wheeler modal shares<br />
– Reduction in all other types of private transport modes<br />
• Sustainable Cities/Urban <strong>Transport</strong> (SUT)<br />
– Demand management and modern mass transit<br />
– Regulation of private car use reflected by<br />
reduction in modal share<br />
– Widespread implementation of BRT systems<br />
• Extra Effort -- All of the above<br />
* Work done with Shyam Menon, W. Bank<br />
29<br />
29
CO 2 Emissions by <strong>Transport</strong> Mode<br />
Million Tonnes CO2<br />
450<br />
400<br />
350<br />
300<br />
250<br />
200<br />
150<br />
Rail<br />
Bus<br />
Three Wheeler<br />
Two Wheeler<br />
Cars, Taxis, MUVs<br />
100<br />
50<br />
0<br />
1980 2000 2030 BAU Efficiency TWW SUT Extra Effort<br />
30<br />
30
Hanoi –Maximum Freedom –<br />
No Rules -- And Maximum Chaos<br />
• Two wheeled paradise or purgatory?<br />
– 1+ moped/household<br />
– Go with flow slow<br />
– No discipline or enforcement<br />
• Consequences<br />
– Very high fatality rate – few helmets<br />
– Clean bikes, but high CO and PM<br />
– “Bikes of Burden” -><br />
• If cars come?<br />
– Historic area will freeze<br />
– Fatalities increase<br />
– No way back?<br />
31<br />
31
Passenger-Kilometers by Mode<br />
Source: Hanoi Master Plan, own<br />
estimates<br />
40<br />
Bus<br />
Billions of Passenger-km<br />
35<br />
30<br />
25<br />
20<br />
15<br />
10<br />
Car<br />
Motorcycle<br />
Bicycle<br />
Walk<br />
5<br />
0<br />
"Actual" Trends Public <strong>Transport</strong><br />
2005 2020<br />
32<br />
32
Fuel by Vehicle and Type;<br />
Resulting CO2 emissions<br />
3.0<br />
6<br />
Energy (billion liters/year)<br />
2.5<br />
2.0<br />
1.5<br />
1.0<br />
0.5<br />
0.0<br />
1995 2005 2020-I 2020-II 2020-III 2020-IV Euro2 2020-V Euro 3 2020-VI Euro 4<br />
5<br />
4<br />
3<br />
2<br />
1<br />
0<br />
CO2 Emissions (million tonnes/year)<br />
History Present Trends High Mass Transit<br />
Motorcycle Car Car (diesel) Bus<br />
Bus (diesel) Truck Truck (diesel) CO2 Emissions<br />
33<br />
33
Hanoi – the Two Wheeler World (TWW)?<br />
A Smart Future for all Asian Cities?<br />
• Low Energy, Low Emissions Mode<br />
– Very energy efficient, with high load factors (and freight)<br />
– Low emissions with clean fuels<br />
– No local emissions with e-bikes<br />
• Traffic and Safety – If Protected from Cars<br />
– Takes up far less space than cars, but carry heavy loads<br />
– Need to slow down, obey rules, respect pedestrians, bikers<br />
– Need better solution to parking than sidewalks<br />
• A Safe, Two-Wheeled, Low Carbon Future?<br />
– Protect crowded, historical areas from cars<br />
– Cluster homes, jobs in dense surroundings, to combat sprawl<br />
– Explore city bikes to use after long journeys into town<br />
Smart, Clean Vehicles the Easy Part: TWW<br />
Only Works With Smart Governance and<br />
34<br />
Smart Drivers<br />
34
E2W Path to Mass Commercialization<br />
Annual Vehicle Sales (MM/yr)<br />
20<br />
18<br />
16<br />
14<br />
12<br />
10<br />
‐<br />
8<br />
6<br />
4<br />
2<br />
Motorcycles<br />
First<br />
commercial e-<br />
bikes launched<br />
(Shanghai,<br />
Crane)<br />
E2W sales<br />
surge after<br />
SARS<br />
outbreak<br />
Gasoline scooters<br />
banned in several<br />
cities, 53K<br />
scrapped in<br />
Shanghai<br />
Switch to brushless motors enables efficiency<br />
increase (50% 85%). Big impact on range<br />
China passes<br />
law granting<br />
E2Ws right to<br />
bike lanes<br />
Beijing repeals ban<br />
on e-bikes,<br />
Guangzhou bans all<br />
motorized twowheelers<br />
E2Ws<br />
Passenger<br />
Cars<br />
VRLA energy density increases 33%, life<br />
increases 35%. Big impact on cost and<br />
weight<br />
Disposable income nearly doubles to $1200/yr<br />
Source: E-bikes: Jamerson and Benjamin “Electric Bike World Report (2007 edition)”, Personal car & autos: China Bureau of Statistics<br />
2006, Motorcycles: Ohara (2006), Honda Annual Report (2003 and 2006), Feng An (2010), iCET<br />
35
Electric Two Wheels and Four Wheels in China?<br />
?<br />
36
EVs by E2W makers?<br />
Cost (USD) $2,600-7,900 $2,600-5,300 $3,800<br />
Range (km) 80-120 100-150<br />
Speed (km/hr) 45 45 45-60<br />
Power (kW) 3 3<br />
Dimensions (l,w,h) (m) 2.9 x 1.3 x 1.7 3.1x1.6x1.5<br />
Weight (kg) 400 650 750<br />
Battery VRLA VRLA, 48V, 9 kWh<br />
Sources: http://www.incalcu-ev.com/product/view.asp?id=1533,<br />
http://www.yadea.com.cn/tezhong.htm http://www.shiweichina.com/product.asp<br />
VRLA, 48V<br />
(120Ah*12V)<br />
37
Sustainable <strong>Transport</strong>? Yes<br />
OR<br />
+ OR<br />
38
The CO2 and Oil Impact of EEV‘s<br />
Not a Simple Matter of Calculation<br />
Electric Cars:<br />
EEV’s*?<br />
Plug In Hybrid:<br />
When to gas,<br />
when to charge?<br />
*”Elsewhere Emissions Vehicles”<br />
39
The Singapore Experience:<br />
Integrated Land Use <strong>Transport</strong> and Development<br />
• Manual road pricing (ALS) introduced in the Central<br />
Business District (CBD) since 1975<br />
• High manpower needs, inconvenient, limited in varying<br />
road pricing charges<br />
• Automated with the Electronic Road Pricing (ERP)<br />
system replaced the manual scheme in 1998<br />
• 45 ERP gantries currently in operation<br />
• High tax for acquiring car<br />
• Result – high GDP, low car<br />
ownership and use<br />
40
Conclusions: Will Asia Carbonize?<br />
Sane, Safe <strong>Transport</strong> is the Umbrella<br />
– Make room for 800 million more urbanites – land use planning<br />
– Scale up of bus rapid transit<br />
– Next steps – restraints on car use (congestion pricing?)<br />
Clean Air Also Means Big Changes<br />
– Better intercity roads for freight, people<br />
– Real urban transport – not just token BRT -- reform next<br />
– Next steps – car restraints, protection for NMT<br />
Fuel Economy and Alternative Fuels<br />
– Fuel economy is necessary but not sufficient<br />
– Alternative fuels prospects grim – competition for land<br />
– Main threat/hope – coal/decarbonized hydrogen or??<br />
Avoiding the Multiple Problems of Too Many Cars<br />
Is Much Easier than Mitigating them when its too late!<br />
41<br />
41
Asian <strong>Transport</strong><br />
Research Opportunities<br />
• Bean Counting<br />
– Mobility, pollution exposure, etc in cities and nationally<br />
– Person/good mobility, fuel use and economy in all modes<br />
– Measuring the direct, unpaid, and external costs of transport<br />
• Development and <strong>Transport</strong><br />
– <strong>Transport</strong> – economy interactions in developing countries<br />
– Who is in charge of land use and urban/rural development?<br />
– Where does traffic safety fit, particularly for the non-driver<br />
• <strong>Transport</strong> and Environment Policy<br />
– Business models for urban and intercity transport<br />
– Policies to avoid the crunch of individual vehicles<br />
– Impacts of fuel economy and pollution policies<br />
Key Element: Starting from the Ground Up<br />
Don’t Extrapolate from US, OZ or EU<br />
42<br />
42
Key Messages for Asia (and the World)<br />
Is the Car the Only Alternative for “The Common Man”<br />
• Rapidly Rising CO2 Emissions a Symptom of Bad <strong>Transport</strong><br />
– Rising car/two wheeler use driven by poor alternatives<br />
– Congestion raises emissions from everyone, drives more to cars/2W<br />
– Too much policy “carbo-centric” rather than development focused<br />
• Focus on <strong>Transport</strong> and Development Policy with CO2 Twist<br />
– Avoid-Shift-Mitigate strategy with financing<br />
– Keep the car from taking over, while its not too late<br />
– Avoid carbo-centric “projects” and funding that ignore all else<br />
• The Real Challenge: Balance<br />
– Fuel prices must reflect costs and environmental damage<br />
– Vehicle use must reflect congestion and safety costs<br />
– Urban development must avoid car-centrism<br />
Policy and Direction, not just Other People’s Money (OPM)<br />
the Key Missing Ingredients in Urban <strong>Transport</strong> Today<br />
43<br />
43
Thank You<br />
Lee Schipper – mrmeter@stanford.edu<br />
http://peec.stanford.edu<br />
Car that absorbs its own carbon?<br />
Does not solve Asia’s <strong>Transport</strong> Problems<br />
44<br />
44