ANNUAL REPORT & ACCOUNTS - Somero Enterprises
ANNUAL REPORT & ACCOUNTS - Somero Enterprises
ANNUAL REPORT & ACCOUNTS - Somero Enterprises

You also want an ePaper? Increase the reach of your titles
YUMPU automatically turns print PDFs into web optimized ePapers that Google loves.
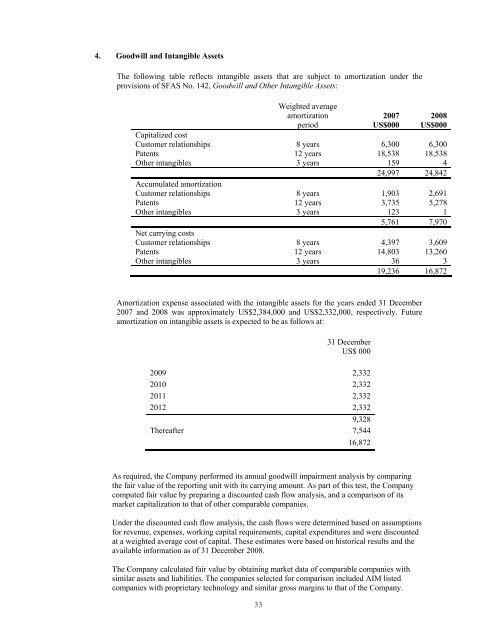
4. Goodwill and Intangible Assets<br />
The following table reflects intangible assets that are subject to amortization under the<br />
provisions of SFAS No. 142, Goodwill and Other Intangible Assets:<br />
Weighted average<br />
amortization<br />
period<br />
2007<br />
US$000<br />
2008<br />
US$000<br />
Capitalized cost<br />
Customer relationships 8 years 6,300 6,300<br />
Patents 12 years 18,538 18,538<br />
Other intangibles 3 years 159 4<br />
24,997 24,842<br />
Accumulated amortization<br />
Customer relationships 8 years 1,903 2,691<br />
Patents 12 years 3,735 5,278<br />
Other intangibles 3 years 123 1<br />
5,761 7,970<br />
Net carrying costs<br />
Customer relationships 8 years 4,397 3,609<br />
Patents 12 years 14,803 13,260<br />
Other intangibles 3 years 36 3<br />
19,236 16,872<br />
Amortization expense associated with the intangible assets for the years ended 31 December<br />
2007 and 2008 was approximately US$2,384,000 and US$2,332,000, respectively. Future<br />
amortization on intangible assets is expected to be as follows at:<br />
31 December<br />
US$ 000<br />
2009 2,332<br />
2010 2,332<br />
2011 2,332<br />
2012 2,332<br />
9,328<br />
Thereafter 7,544<br />
16,872<br />
As required, the Company performed its annual goodwill impairment analysis by comparing<br />
the fair value of the reporting unit with its carrying amount. As part of this test, the Company<br />
computed fair value by preparing a discounted cash flow analysis, and a comparison of its<br />
market capitalization to that of other comparable companies.<br />
Under the discounted cash flow analysis, the cash flows were determined based on assumptions<br />
for revenue, expenses, working capital requirements, capital expenditures and were discounted<br />
at a weighted average cost of capital. These estimates were based on historical results and the<br />
available information as of 31 December 2008.<br />
The Company calculated fair value by obtaining market data of comparable companies with<br />
similar assets and liabilities. The companies selected for comparison included AIM listed<br />
companies with proprietary technology and similar gross margins to that of the Company.<br />
33