Enrollment Projections - Johnson Creek Public Schools
Enrollment Projections - Johnson Creek Public Schools
Enrollment Projections - Johnson Creek Public Schools

You also want an ePaper? Increase the reach of your titles
YUMPU automatically turns print PDFs into web optimized ePapers that Google loves.
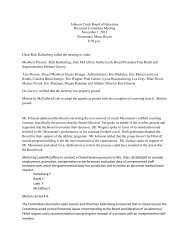
TABLE 7<br />
Grade Progression Ratios<br />
<strong>Johnson</strong> <strong>Creek</strong> School District<br />
YEAR<br />
CHANGES B:K K:1 1:2 2:3 3:4 4:5 5:6 6:7 7:8 8:9 9:10 10:11 11:12<br />
00-01/01-02 0.556 0.870 0.930 0.717 1.000 1.000 0.887 1.000 0.943 1.023 0.977 1.000 1.047<br />
01-02/02-03 0.586 1.091 0.979 0.900 1.289 1.022 1.100 0.979 0.923 1.182 0.841 1.047 0.898<br />
02-03/03-04 0.570 1.095 1.139 1.109 1.194 1.020 0.979 1.023 1.130 1.056 1.051 1.216 1.000<br />
03-04/04-05 0.554 1.000 1.109 1.122 1.000 1.116 1.020 1.087 1.067 1.000 0.921 1.049 0.978<br />
04-05/05-06 0.831 1.000 1.114 0.961 1.000 1.020 1.000 1.000 1.000 1.000 1.000 1.000 0.907<br />
05-06/06-07 0.857 0.922 1.053 1.103 0.898 0.978 1.000 0.979 1.039 1.020 0.938 1.019 0.914<br />
06-07/07-08 0.868 0.955 0.936 1.025 1.047 0.932 1.000 0.942 0.957 0.962 0.961 1.044 0.906<br />
07-08/08-09 0.837 1.063 1.167 1.000 1.024 1.022 0.927 1.067 1.000 0.933 1.020 0.980 1.043<br />
08-09/09-10 0.821 0.966 1.000 1.041 1.045 0.976 1.022 0.895 1.021 1.041 1.071 1.000 1.021<br />
Baseline 0.765 0.999 1.047 1.032 1.044 1.005 0.992 0.999 1.004 1.015 0.981 1.017 0.968<br />
5 Year Trend 0.843 0.981 1.054 1.026 1.003 0.986 0.990 0.977 1.003 0.991 0.998 1.009 0.958<br />
2 Year "Trend" 0.829 1.014 1.083 1.020 1.035 0.999 0.974 0.981 1.010 0.987 1.046 0.990 1.032<br />
*Shaded progression ratios are excluded from the Baseline Average<br />
The grade progression ratios can be interpreted in the following manner. The Baseline ratio for K:1<br />
is .999. This means that in the <strong>Johnson</strong> <strong>Creek</strong> School District, the first grade is on average .1% smaller<br />
each year than the kindergarten class was the previous year (the result of transfers to other schools<br />
and out-migration from the district), though the ratio is incredibly close to one, and very little loss of<br />
students is occurring. The B:K (birth to kindergarten) Baseline ratio of 0.765 indicates that on average,<br />
approximately 76.5% of the births in the Village of <strong>Johnson</strong> <strong>Creek</strong> and Towns of Farmington and<br />
Watertown from five years previous enroll in kindergarten in <strong>Johnson</strong> <strong>Creek</strong> School District. Outliers<br />
(ratios outside of one standard deviation of the mean) are not included in the calculation of the<br />
Baseline average ratios.<br />
In order to examine future enrollment under different growth assumptions, we generate three sets<br />
of grade progression ratios that correspond to the different projection models shown later in this<br />
report. In addition to the Baseline ratios (averages 10 years of data), we examine rates of transfer in<br />
the last 5 years and the last 2 years, effectively weighing enrollment change patterns from different<br />
time periods more heavily than the Baseline. Any significant deviations from the rates of in- and outmigration<br />
in the district area will have a corresponding effect on enrollment. These additional models<br />
allow us to examine alternative outcomes compared to the overall trends of the Baseline model.<br />
Figure 6 shows the differences between these three sets of grade progression ratios.<br />
School <strong>Enrollment</strong> Projection Series: <strong>Johnson</strong> <strong>Creek</strong> School District 19