Enrollment Projections - Johnson Creek Public Schools
Enrollment Projections - Johnson Creek Public Schools
Enrollment Projections - Johnson Creek Public Schools

Create successful ePaper yourself
Turn your PDF publications into a flip-book with our unique Google optimized e-Paper software.
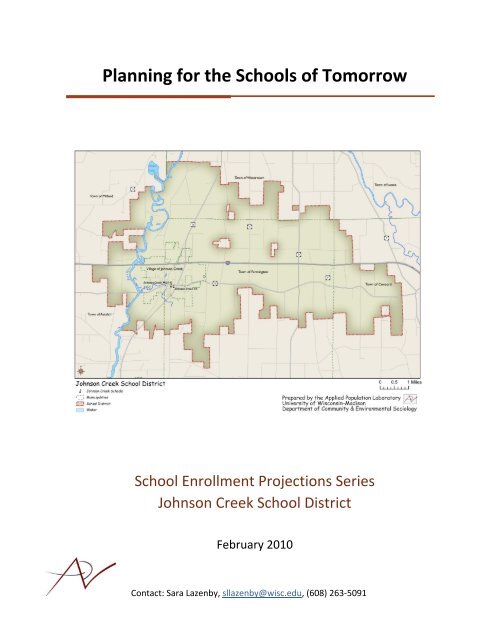
Planning for the <strong>Schools</strong> of Tomorrow<br />
School <strong>Enrollment</strong> <strong>Projections</strong> Series<br />
<strong>Johnson</strong> <strong>Creek</strong> School District<br />
February 2010<br />
Contact: Sara Lazenby, sllazenby@wisc.edu, (608) 263-5091
Page Intentionally Left Blank<br />
School <strong>Enrollment</strong> Projection Series: <strong>Johnson</strong> <strong>Creek</strong> School District<br />
ii
Table of Contents<br />
Introduction .......................................................................................................................................... 1<br />
District <strong>Enrollment</strong> History, 2000-2009 ................................................................................................ 1<br />
Kindergarten <strong>Enrollment</strong> Trends .......................................................................................................... 7<br />
Birth Trends and <strong>Projections</strong> ................................................................................................................ 9<br />
Population Estimates and <strong>Projections</strong> ................................................................................................ 10<br />
Residential Development .................................................................................................................... 15<br />
Methods .............................................................................................................................................. 18<br />
Grade Progression Ratios ................................................................................................................ 18<br />
School <strong>Enrollment</strong> <strong>Projections</strong>, 2010-2019 ........................................................................................ 21<br />
4K <strong>Enrollment</strong> <strong>Projections</strong> ............................................................................................................... 21<br />
Baseline Projection .......................................................................................................................... 22<br />
5 Year Trend Projection ................................................................................................................... 23<br />
2 Year “Trend” Projection ............................................................................................................... 24<br />
Kindergarten Trend Projection ........................................................................................................ 25<br />
Comparison of Projection Models ...................................................................................................... 26<br />
Conclusions ......................................................................................................................................... 30<br />
School <strong>Enrollment</strong> Projection Series: <strong>Johnson</strong> <strong>Creek</strong> School District<br />
iii
Introduction<br />
This report offers a summary of the <strong>Enrollment</strong> Projection Analysis completed for the <strong>Johnson</strong><br />
<strong>Creek</strong> School District by the Applied Population Laboratory, University of Wisconsin – Madison.<br />
<strong>Projections</strong> (2010-2019) are provided for the district as a whole, and individually for each grade and<br />
grade grouping. The projection process uses a combination of historical enrollment data, birth trends<br />
and projections, housing starts data, and population trends and projections to create reasonable<br />
assumptions about future growth scenarios and the likely impact on the school district.<br />
District <strong>Enrollment</strong> History, 2000-2009<br />
Figures 1-A, 1-B, and 1-C and Tables 1 and 2 display data on the last ten years of enrollment history<br />
in the <strong>Johnson</strong> <strong>Creek</strong> School District. K-12 district enrollment has grown overall since 2000, from 596<br />
students in 2000/01 to 627 students in 2009/10. This is a growth of 31 students, or a 5.2% increase in<br />
the number of K-12 students enrolled. In addition, in the 2008/09 school year the district began a 4K<br />
program, which has added an additional 50 students to the district each of the past two years. From<br />
the lowest K-12 enrollment in the last decade (2001/02), the district has gained 73 students, or<br />
increased enrollment by 13.2%.<br />
School <strong>Enrollment</strong> Projection Series: <strong>Johnson</strong> <strong>Creek</strong> School District 1
Students<br />
Figure 1-A<br />
700<br />
<strong>Johnson</strong> <strong>Creek</strong> School District<br />
Student <strong>Enrollment</strong><br />
600<br />
500<br />
400<br />
300<br />
200<br />
100<br />
0<br />
2000/01 2001/02 2002/03 2003/04 2004/05 2005/06 2006/07 2007/08 2008/09 2009/10<br />
School <strong>Enrollment</strong> Projection Series: <strong>Johnson</strong> <strong>Creek</strong> School District 2
TABLE 1<br />
Student <strong>Enrollment</strong><br />
<strong>Johnson</strong> <strong>Creek</strong> School District<br />
SCHOOL YEAR<br />
00-01 01-02 02-03 03-04 04-05 05-06 06-07 07-08 08-09 09-10<br />
4K 0 0 0 0 0 0 0 0 50 50<br />
K 54 33 42 35 38 51 44 48 58 55<br />
1 43 47 36 46 35 38 47 42 51 56<br />
2 53 40 46 41 51 39 40 44 49 51<br />
3 46 38 36 51 46 49 43 41 44 51<br />
4 40 46 49 43 51 46 44 45 42 46<br />
5 53 40 47 50 48 52 45 41 46 41<br />
6 39 47 44 46 51 48 52 45 38 47<br />
7 35 39 46 45 50 51 47 49 48 34<br />
8 43 33 36 52 48 50 53 45 49 49<br />
9 44 44 39 38 52 48 51 51 42 51<br />
10 59 43 37 41 35 52 45 49 52 45<br />
11 43 59 45 45 43 35 53 47 48 52<br />
12 44 45 53 45 44 39 32 48 49 49<br />
K-12 596 554 556 578 592 598 596 595 616 627<br />
4K-12 596 554 556 578 592 598 596 595 666 677<br />
K-6 328 291 300 312 320 323 315 306 328 347<br />
7-8 78 72 82 97 98 101 100 94 97 83<br />
9-12 190 191 174 169 174 174 181 195 191 197<br />
School <strong>Enrollment</strong> Projection Series: <strong>Johnson</strong> <strong>Creek</strong> School District 3
TABLE 2<br />
Student <strong>Enrollment</strong> Changes<br />
<strong>Johnson</strong> <strong>Creek</strong> School District<br />
ABSOLUTE CHANGE PERCENT CHANGE AVERAGE ANNUAL<br />
PERCENT CHANGE<br />
GRADE '00 to '09 '00 to '04 '05 to '09 '00 to '09 '00 to '04 '05 to '09 '00 to '09 '00 to '04 '05 to '09<br />
K 1 -16 4 1.9 -29.6 7.8 0.2 -7.4 2.0<br />
1 13 -8 18 30.2 -18.6 47.4 3.4 -4.7 11.8<br />
2 -2 -2 12 -3.8 -3.8 30.8 -0.4 -0.9 7.7<br />
3 5 0 2 10.9 0.0 4.1 1.2 0.0 1.0<br />
4 6 11 0 15.0 27.5 0.0 1.7 6.9 0.0<br />
5 -12 -5 -11 -22.6 -9.4 -21.2 -2.5 -2.4 -5.3<br />
6 8 12 -1 20.5 30.8 -2.1 2.3 7.7 -0.5<br />
7 -1 15 -17 -2.9 42.9 -33.3 -0.3 10.7 -8.3<br />
8 6 5 -1 14.0 11.6 -2.0 1.6 2.9 -0.5<br />
9 7 8 3 15.9 18.2 6.3 1.8 4.5 1.6<br />
10 -14 -24 -7 -23.7 -40.7 -13.5 -2.6 -10.2 -3.4<br />
11 9 0 17 20.9 0.0 48.6 2.3 0.0 12.1<br />
12 5 0 10 11.4 0.0 25.6 1.3 0.0 6.4<br />
K-12 31 -4 29 5.2 -0.7 4.8 0.6 -0.2 1.2<br />
4K-12 81 -4 79 13.6 -0.7 13.2 1.5 -0.2 3.3<br />
K-6 19 -8 24 5.8 -2.4 7.4 0.6 -0.6 1.9<br />
7-8 5 20 -18 6.4 25.6 -17.8 0.7 6.4 -4.5<br />
9-12 7 -16 23 3.7 -8.4 13.2 0.4 -2.1 3.3<br />
School <strong>Enrollment</strong> Projection Series: <strong>Johnson</strong> <strong>Creek</strong> School District 4
Students<br />
Figure 1-B shows enrollment history broken down by grade groupings (K-6, 7-8, and 9-12).<br />
<strong>Enrollment</strong> in grades K-6 has increased by 7.4% within the past five years, while 9-12 enrollment has<br />
increased by 13.2%. <strong>Enrollment</strong> in grades 7-8 has decreased by 17.8% in the past five years, which is a<br />
result of small cohorts entering the junior high years.<br />
Figure 1-B<br />
<strong>Johnson</strong> <strong>Creek</strong> School District<br />
Student <strong>Enrollment</strong> by Grade Grouping<br />
400<br />
350<br />
300<br />
250<br />
200<br />
150<br />
100<br />
50<br />
0<br />
2000/01 2001/02 2002/03 2003/04 2004/05 2005/06 2006/07 2007/08 2008/09 2009/10<br />
K-6 7-8 9-12<br />
School <strong>Enrollment</strong> Projection Series: <strong>Johnson</strong> <strong>Creek</strong> School District 5
Grade<br />
Figure 1-C shows the age structure in Fall 2009 of the <strong>Johnson</strong> <strong>Creek</strong> School District student<br />
population with the number of kindergarteners at the bottom and the number of 12 th graders at top.<br />
The largest cohorts are in Elementary school, with Kindergarten and 1 st grade enrolling 55 and 56<br />
students, respectively. The smallest cohort is currently in 7 th grade, with 34 students.<br />
Figure 1-C<br />
<strong>Johnson</strong> <strong>Creek</strong> School District<br />
Age Structure, Fall 2009<br />
12<br />
49<br />
11<br />
52<br />
10<br />
45<br />
9<br />
51<br />
8<br />
49<br />
7<br />
34<br />
6<br />
47<br />
5<br />
41<br />
4<br />
46<br />
3<br />
2<br />
51<br />
51<br />
1<br />
K<br />
55<br />
56<br />
0 10 20 30 40 50 60<br />
Number of Students Enrolled<br />
School <strong>Enrollment</strong> Projection Series: <strong>Johnson</strong> <strong>Creek</strong> School District 6
Students<br />
Kindergarten <strong>Enrollment</strong> Trends<br />
Examining trends in kindergarten enrollment is particularly informative for gaining perspective on<br />
future district enrollment, as today’s kindergarteners will gradually make up tomorrow’s students at<br />
the higher grade levels as they age and move through the school system. When kindergarten<br />
enrollment is increasing, elementary and middle school enrollment might be expected to increase in<br />
the near future, while high school enrollment may increase farther in the future. Figure 2-A shows<br />
kindergarten enrollment history in black, and trend lines depicting kindergarten enrollment in red and<br />
blue. The “Long Term Trend” line (shown in red) averages kindergarten enrollment changes between<br />
2000 and 2009. The “Recent Trend” line emphasizes kindergarten enrollment changes over the last<br />
five years. In <strong>Johnson</strong> <strong>Creek</strong> School District, kindergarten enrollment has been on the rise for several<br />
years, and particularly within the last five years.<br />
Figure 2-A<br />
80<br />
<strong>Johnson</strong> <strong>Creek</strong> School District<br />
Kindergarten <strong>Enrollment</strong> Trends<br />
Projected<br />
70<br />
60<br />
50<br />
40<br />
30<br />
20<br />
10<br />
0<br />
Actual Long Term Trend Recent Trend<br />
School <strong>Enrollment</strong> Projection Series: <strong>Johnson</strong> <strong>Creek</strong> School District 7
Students<br />
In addition to examining kindergarten enrollment on its own, comparing kindergarten enrollment<br />
to outgoing 12 th graders offers a snapshot of how the age structure of district enrollment is shifting<br />
either from older to younger, or younger to older. Districts tend to experience overall growth when<br />
kindergarten enrollment outpaces outgoing students, and they tend to experience decline when<br />
kindergarteners do not fully replace the number of graduates. In <strong>Johnson</strong> <strong>Creek</strong> School District,<br />
incoming kindergarten cohorts have exceeded the previous year’s 12 th grade enrollment for each of<br />
the last five years.<br />
Figure 2-B<br />
70<br />
<strong>Johnson</strong> <strong>Creek</strong> School District<br />
Kindergarten Replacement<br />
60<br />
50<br />
40<br />
30<br />
20<br />
10<br />
0<br />
2000/01 2001/02 2002/03 2003/04 2004/05 2005/06 2006/07 2007/08 2008/09 2009/10<br />
Previous Year's 12th Grade <strong>Enrollment</strong><br />
Kindergarten <strong>Enrollment</strong><br />
School <strong>Enrollment</strong> Projection Series: <strong>Johnson</strong> <strong>Creek</strong> School District 8
Birth Trends and <strong>Projections</strong><br />
We use historical and projected birth data to forecast the number of Kindergarten students who<br />
will enroll in the <strong>Johnson</strong> <strong>Creek</strong> School District in the future years. Figure 3 shows (in black) the<br />
number of births to mothers living in municipalities that fall within school district boundaries, by year,<br />
from 1989-2008, as collected from the Wisconsin Department of Health and Family Services. For the<br />
<strong>Johnson</strong> <strong>Creek</strong> School District we include the municipalities of the Village of <strong>Johnson</strong> <strong>Creek</strong>, and the<br />
Towns of Farmington and Watertown.<br />
We extrapolate these birth trends into the future to correspond with our Baseline and Recent<br />
Trend projection models, using the B:K grade progression ratios to transform births into future<br />
Kindergarteners. The red line in Figure 3 represents birth trends over the longer term (between 1989<br />
and 2008). The blue line examines birth patterns for the last seven years corresponds to the Recent<br />
Trend projection models shown later in this report. Births have increased overall in the past 20 years,<br />
but have shown large increases over the past seven years.<br />
100<br />
90<br />
Figure 3<br />
<strong>Johnson</strong> <strong>Creek</strong> School District<br />
Area Births<br />
Projected<br />
80<br />
70<br />
60<br />
50<br />
40<br />
30<br />
20<br />
10<br />
0<br />
1989 1990 1991 1992 1993 1994 1995 1996 1997 1998 1999 2000 2001 2002 2003 2004 2005 2006 2007 2008 2009 2010 2011 2012 2013 2014<br />
Long Term Trend Recent Trend Actual<br />
School <strong>Enrollment</strong> Projection Series: <strong>Johnson</strong> <strong>Creek</strong> School District 9
Population Estimates and <strong>Projections</strong><br />
This section examines population trends of the recent past and projected population change into<br />
the future for municipalities that fall within the <strong>Johnson</strong> <strong>Creek</strong> School District area. Changes in the<br />
total population of the district area, particularly when examined by age, provide clues into how the<br />
school age population may be changing.<br />
Table 3 and Figure 4-A provide Wisconsin Department of Administration (DOA) estimates for<br />
district area municipalities from 1990 to 2009. These municipal estimates can be compared with<br />
estimates for Jefferson County and the State of Wisconsin. The <strong>Johnson</strong> <strong>Creek</strong> School District area<br />
grew quickly from 2000-2006. Since that point in time, growth has slowed somewhat, with a growth of<br />
.5% from 2008 to 2009.<br />
TABLE 3<br />
Population Estimates of Municipalities: 1990-2009<br />
<strong>Johnson</strong> <strong>Creek</strong> School District<br />
POPULATION<br />
Census Census est. est. est. est. est.<br />
Municipality 1990 2000 2005 2006 2007 2008 2009<br />
V. <strong>Johnson</strong> <strong>Creek</strong> 1,259 1,581 1,901 2,012 2,055 2,122 2,138<br />
T. Farmington 1,404 1,498 1,524 1,523 1,525 1,533 1,532<br />
T. Watertown 1,840 1,876 1,919 1,930 1,952 1,962 1,973<br />
District Area 4,503 4,955 5,344 5,465 5,532 5,617 5,643<br />
Jefferson County 67,783 75,767 79,188 80,005 80,411 81,022 81,310<br />
State of Wisconsin 4,891,769 5,101,581 5,363,715 5,617,744 5,648,124 5,675,000 5,688,000<br />
PERCENT CHANGE<br />
AVG.<br />
1990 to 2000 to 2005 to 2006 to 2007 to 2008 to ANNUAL<br />
Municipality 2000 2005 2006 2007 2008 2009 2000-2009<br />
V. <strong>Johnson</strong> <strong>Creek</strong> 25.6% 20.2% 5.8% 2.1% 3.3% 0.8% 3.9%<br />
T. Farmington 6.7% 1.7% -0.1% 0.1% 0.5% -0.1% 0.3%<br />
T. Watertown 2.0% 2.3% 0.6% 1.1% 0.5% 0.6% 0.6%<br />
District Area 10.0% 7.9% 2.3% 1.2% 1.5% 0.5% 1.5%<br />
Jefferson County 11.8% 4.5% 1.0% 0.5% 0.8% 0.4% 0.8%<br />
State of Wisconsin 4.3% 5.1% 4.7% 0.5% 0.5% 0.2% 1.3%<br />
Source: Official Population Estimates (1990-2009). Demographic Services Center, WIDOA<br />
School <strong>Enrollment</strong> Projection Series: <strong>Johnson</strong> <strong>Creek</strong> School District 10
Population<br />
Figure 4-A<br />
<strong>Johnson</strong> <strong>Creek</strong> School District<br />
Population Estimates for Area Municipalities<br />
6,000<br />
5,000<br />
4,000<br />
3,000<br />
2,000<br />
1,000<br />
0<br />
2005 2006 2007 2008 2009<br />
V. <strong>Johnson</strong> <strong>Creek</strong> T. Farmington T. Watertown District Area<br />
School <strong>Enrollment</strong> Projection Series: <strong>Johnson</strong> <strong>Creek</strong> School District 11
Population projections to 2020 for <strong>Johnson</strong> <strong>Creek</strong> School District area municipalities are provided in<br />
Table 4. These projections suggest that area population will continue to increase in the coming years,<br />
although at rates slower than the growth seen from 2000-05. Overall, the district area is expected to<br />
gain about 953 residents between 2005 and 2020.<br />
TABLE 4<br />
Population <strong>Projections</strong> of Municipalities: 1990-2020<br />
<strong>Johnson</strong> <strong>Creek</strong> School District<br />
POPULATION<br />
Census Estimate Census Estimate <strong>Projections</strong><br />
CHANGE<br />
Municipality 1990 1995 2000 2005 2010 2015 2020 2000 to 2020<br />
V. <strong>Johnson</strong> <strong>Creek</strong> 1,259 1,476 1,581 1,901 2,157 2,413 2,673 1,092<br />
T. Farmington 1,404 1,422 1,498 1,524 1,558 1,585 1,615 117<br />
T. Watertown 1,840 1,880 1,876 1,919 1,943 1,974 2,009 133<br />
District Area 4,503 4,778 4,955 5,344 5,658 5,972 6,297 1,342<br />
Jefferson County 67,783 70,886 75,767 79,188 82,729 86,517 90,417 14,650<br />
State of Wisconsin 4,891,769 5,101,581 5,363,715 5,617,744 5,772,370 5,988,420 6,202,810 839,095<br />
PERCENT CHANGE<br />
Observed & Estimated<br />
Projected<br />
Municipality 1990-95 1995-00 2000-05 2005-10 2010-15 2015-20 2000-20<br />
V. <strong>Johnson</strong> <strong>Creek</strong> 17.2% 7.1% 20.2% 13.5% 11.9% 10.8% 69.1%<br />
T. Farmington 1.3% 5.3% 1.7% 2.2% 1.7% 1.9% 7.8%<br />
T. Watertown 2.2% -0.2% 2.3% 1.3% 1.6% 1.8% 7.1%<br />
District Area 6.1% 3.7% 7.9% 5.9% 5.5% 5.4% 27.1%<br />
Jefferson County 4.6% 6.9% 4.5% 4.5% 4.6% 4.5% 19.3%<br />
State of Wisconsin 4.3% 5.1% 4.7% 2.8% 3.7% 3.6% 15.6%<br />
ANNUAL RATE OF CHANGE<br />
Observed & Estimated<br />
Projected<br />
Municipality 1990-95 1995-2000 2000-05 2005-10 2010-15 2015-20 2000-20<br />
V. <strong>Johnson</strong> <strong>Creek</strong> 3.4% 1.4% 4.0% 2.7% 2.4% 2.2% 3.5%<br />
T. Farmington 0.3% 1.1% 0.3% 0.4% 0.3% 0.4% 0.4%<br />
T. Watertown 0.4% 0.0% 0.5% 0.3% 0.3% 0.4% 0.4%<br />
District Area 1.2% 0.7% 1.6% 1.2% 1.1% 1.1% 1.4%<br />
Jefferson County 0.9% 1.4% 0.9% 0.9% 0.9% 0.9% 1.0%<br />
State of Wisconsin 0.9% 1.0% 0.9% 0.6% 0.7% 0.7% 0.8%<br />
Source: Population <strong>Projections</strong> for Wisconsin Municipalities: 2000-35 (2008). Demographic Services Center, WIDOA<br />
School <strong>Enrollment</strong> Projection Series: <strong>Johnson</strong> <strong>Creek</strong> School District 12
Table 5 shows population projections by age for Jefferson County. In the county as a whole, the<br />
number of children aged 5-9, 10-15, and 15-19 is expected to increase by 2035. Because these<br />
projections are for the entirety of Jefferson County, they may or may not resemble the future age<br />
structure of the population within the <strong>Johnson</strong> <strong>Creek</strong> School District area.<br />
TABLE 5<br />
Population <strong>Projections</strong> by Age: 2010-2035<br />
<strong>Johnson</strong> <strong>Creek</strong> School District<br />
Jefferson County<br />
Age Group 2010 2015 2020 2025 2030 2035<br />
0-4 5,179 5,548 5,852 5,969 5,960 6,046<br />
5-9 5,278 5,511 5,888 6,188 6,290 6,266<br />
10-14 5,371 5,663 5,899 6,282 6,582 6,674<br />
15-19 5,927 5,862 6,152 6,382 6,772 7,079<br />
20-24 5,293 5,132 5,077 5,334 5,538 5,882<br />
25-29 6,058 5,617 5,453 5,400 5,673 5,895<br />
30-34 5,479 6,355 5,883 5,712 5,644 5,933<br />
35-39 5,241 5,821 6,706 6,190 6,010 5,923<br />
40-44 5,830 5,403 6,002 6,891 6,353 6,172<br />
45-49 6,547 5,895 5,471 6,080 6,968 6,423<br />
50-54 6,124 6,478 5,843 5,432 6,044 6,932<br />
55-59 5,413 5,963 6,319 5,711 5,318 5,928<br />
60-64 4,416 5,146 5,684 6,039 5,468 5,105<br />
65-69 3,244 4,087 4,778 5,295 5,642 5,124<br />
70-74 2,524 2,895 3,665 4,302 4,788 5,124<br />
75-79 1,846 2,153 2,488 3,172 3,745 4,196<br />
80-84 1,434 1,367 1,609 1,880 2,419 2,880<br />
85-89 942 947 920 1,098 1,302 1,698<br />
90-94 425 485 501 500 607 735<br />
95-99 132 154 184 197 203 253<br />
100 & Over 26 35 43 54 61 66<br />
Totals 82,729 86,517 90,417 94,108 97,387 100,334<br />
Source: Population <strong>Projections</strong> for Wisconsin Counties: 2000-35 (2008). Demographic Services Center, WIDOA<br />
School <strong>Enrollment</strong> Projection Series: <strong>Johnson</strong> <strong>Creek</strong> School District 13
Figure 4-B shows population estimates for 2008 by age for Jefferson County from the U.S. Census<br />
Bureau and population projections for 2015 produced by the Wisconsin Department of Administration<br />
Demographic Services Center. By 2015 the number of school aged children in Jefferson County is<br />
expected to increase, with the exception of the number of high school aged children (15-19) which is<br />
expected to decrease slightly.<br />
Figure 4-B<br />
Age Structure<br />
Jefferson County<br />
85plus<br />
80 to 84<br />
75 to 79<br />
70 to 74<br />
65 to 69<br />
60 to 64<br />
55 to 59<br />
50 to 54<br />
45 to 49<br />
40 to 44<br />
35 to 39<br />
30 to 34<br />
25 to 29<br />
20 to 24<br />
15 to 19<br />
10 to 14<br />
5 to 9<br />
Under 5<br />
Males<br />
Females<br />
4,000 3,000 2,000 1,000 0 1,000 2,000 3,000 4,000<br />
Number of People<br />
2015 <strong>Projections</strong> 2008 Estimate<br />
School <strong>Enrollment</strong> Projection Series: <strong>Johnson</strong> <strong>Creek</strong> School District 14
Residential Development<br />
Examining trends in recent housing development can help to explain how in-migration into the<br />
<strong>Johnson</strong> <strong>Creek</strong> School District area might be affecting school enrollment. If the number of housing<br />
starts in the district area is expected to be reasonably consistent for the next several years, then we<br />
assume that in-migration of school-age children will also remain relatively consistent. If the number of<br />
housing starts is expected to increase significantly above and beyond recent levels, in-migration may<br />
play an increasing role in school district enrollment. However, it is important to recognize that the<br />
number of housing starts in any given year is dependent upon a large number of confounding variables<br />
(decisions of local, county, and state policy makers, residential developers, interest rates, demand for<br />
housing, etc.), making future growth patterns difficult to predict.<br />
Table 6 shows the number of housing starts in the <strong>Johnson</strong> <strong>Creek</strong> School District over the past ten<br />
years. Area housing starts have fluctuated from a high of 113 units in 2004 (including 143 single family<br />
homes), to a low of 26 new housing starts in 2008.<br />
TABLE 6<br />
School District Area Housing Starts<br />
<strong>Johnson</strong> <strong>Creek</strong> School District<br />
1999 2000 2001 2002 2003 2004 2005 2006 2007 2008<br />
District Area<br />
TOTAL 80 32 34 45 73 113 68 56 51 26<br />
Single Family 31 15 26 43 61 99 56 54 41 26<br />
Two Family 1 1 0 2 12 14 12 2 2 0<br />
Multi-family 48 16 8 0 0 0 0 0 8 0<br />
V. <strong>Johnson</strong> <strong>Creek</strong><br />
TOTAL 54 22 14 31 55 95 49 39 41 20<br />
Single Family 6 6 6 29 43 81 37 37 31 20<br />
Two Family 0 0 0 2 12 14 12 2 2 0<br />
Multi-family 48 16 8 0 0 0 0 0 8 0<br />
T. Farmington<br />
TOTAL 6 5 9 6 5 11 6 6 1 0<br />
Single Family 6 5 9 6 5 11 6 6 1 0<br />
Two Family 0 0 0 0 0 0 0 0 0 0<br />
Multi-family 0 0 0 0 0 0 0 0 0 0<br />
T. Watertown<br />
TOTAL 20 5 11 8 13 7 13 11 9 6<br />
Single Family 19 4 11 8 13 7 13 11 9 6<br />
Two Family 1 1 0 0 0 0 0 0 0 0<br />
Multi-family 0 0 0 0 0 0 0 0 0 0<br />
School <strong>Enrollment</strong> Projection Series: <strong>Johnson</strong> <strong>Creek</strong> School District 15
Figure 5-A shows the number of residential building permits issued by municipality for communities<br />
that fall within the <strong>Johnson</strong> <strong>Creek</strong> School District area. Figure 5-B shows housing starts in the area by<br />
type of housing unit—single family home, duplex, multi-family housing unit, or mobile home.<br />
The majority of housing development over the last several years has occurred in the Village of<br />
<strong>Johnson</strong> creek. There has also been a small amount of development in towns of Farmington and<br />
Watertown. Most of the development in the area has consisted of single-family homes; however the<br />
Village of <strong>Johnson</strong> <strong>Creek</strong> has seen some multi-family residential development over the past several<br />
years. Households in two-family and multi-family complexes, on average, contain fewer school-aged<br />
children than single family homes.<br />
The entire district area has experienced a decline in development over the past four years. This is<br />
consistent with housing and economic trends in Jefferson County, Wisconsin, and the United States as<br />
a whole. Despite these challenges, the <strong>Johnson</strong> <strong>Creek</strong> School District still saw 26 new housing starts in<br />
2008, indicating that development is still occurring within the district area. This is the same amount of<br />
single-family home development that occurred in 2001, and more single-family housing development<br />
than occurred in 2000.<br />
100<br />
Figure 5-A<br />
<strong>Johnson</strong> <strong>Creek</strong> School District<br />
Area Housing Starts by Municipality<br />
90<br />
80<br />
70<br />
60<br />
50<br />
40<br />
30<br />
20<br />
10<br />
0<br />
1999 2000 2001 2002 2003 2004 2005 2006 2007 2008<br />
V. <strong>Johnson</strong> <strong>Creek</strong> T. Farmington T. Watertown<br />
School <strong>Enrollment</strong> Projection Series: <strong>Johnson</strong> <strong>Creek</strong> School District 16
120<br />
Figure 5-B<br />
<strong>Johnson</strong> <strong>Creek</strong> School District<br />
Area Housing Starts by Type<br />
100<br />
80<br />
60<br />
40<br />
20<br />
0<br />
1999 2000 2001 2002 2003 2004 2005 2006 2007 2008<br />
Single Family Two Family Multi-family Total<br />
It is also important to consider that turnover in ownership of existing housing stock also contributes<br />
to changes in enrollment. A district can maintain or even increase enrollment depending upon the<br />
cycle of resident homeowners, regardless of housing starts. For instance, a younger community will<br />
have a higher child-per-household ratio, whereas an older community will have a lower child-perhousehold<br />
ration. However, within a few years a turnover in ownership in an older community may<br />
result in an increase in the child-per-household number. As younger families move into the area, the<br />
school district will tend to see new students enrolling into the district’s schools. Absent new housing<br />
development or housing turnover, families age in place and the number of school-aged children<br />
eventually declines. Turnover in ownership does not happen overnight, however, and slow turnover<br />
may happen for several years at varying rates.<br />
School <strong>Enrollment</strong> Projection Series: <strong>Johnson</strong> <strong>Creek</strong> School District 17
Methods<br />
In order to generate school enrollment projections, we rely on a commonly used demographic<br />
technique called the “cohort survival method.” This method advances current students through the<br />
school system over time and applies rates of transfer (or “survival”) as the students who are now in<br />
school age from year to year and grade to grade. It is through these rates of transfer that we make<br />
assumptions about how migration into and out of the district and transfers to and from different<br />
schools or home schooling will impact future enrollment. In order to project incoming kindergarten<br />
students, we gather data on births from the Wisconsin Department of Health and Family Services and<br />
assume that a certain percentage of the children born to mothers residing in the school district area<br />
will enroll as kindergarteners five to six years later. Finally, we customize projections to best fit an<br />
individual district’s needs by adjusting the basic model based on information about birth trends, recent<br />
housing development, economic changes, and/or population projections.<br />
Grade Progression Ratios<br />
Grade progression ratios are used to measure district enrollment changes, year to year and grade<br />
to grade that have occurred within the school district in the recent past. By examining these, we can<br />
better understand recent changes in enrollment, and we use these ratios as the rates of transfer<br />
mentioned above to inform projections of future students.<br />
Table 7 shows the grade progression ratios for the <strong>Johnson</strong> <strong>Creek</strong> School District. The ratios<br />
measure the effects of in- and out-migration and the transfer of students between private and public<br />
schools, or via open enrollment. The ratios are calculated for several pairs of years and then averages<br />
of these based on different time frames are calculated for each grade.<br />
School <strong>Enrollment</strong> Projection Series: <strong>Johnson</strong> <strong>Creek</strong> School District 18
TABLE 7<br />
Grade Progression Ratios<br />
<strong>Johnson</strong> <strong>Creek</strong> School District<br />
YEAR<br />
CHANGES B:K K:1 1:2 2:3 3:4 4:5 5:6 6:7 7:8 8:9 9:10 10:11 11:12<br />
00-01/01-02 0.556 0.870 0.930 0.717 1.000 1.000 0.887 1.000 0.943 1.023 0.977 1.000 1.047<br />
01-02/02-03 0.586 1.091 0.979 0.900 1.289 1.022 1.100 0.979 0.923 1.182 0.841 1.047 0.898<br />
02-03/03-04 0.570 1.095 1.139 1.109 1.194 1.020 0.979 1.023 1.130 1.056 1.051 1.216 1.000<br />
03-04/04-05 0.554 1.000 1.109 1.122 1.000 1.116 1.020 1.087 1.067 1.000 0.921 1.049 0.978<br />
04-05/05-06 0.831 1.000 1.114 0.961 1.000 1.020 1.000 1.000 1.000 1.000 1.000 1.000 0.907<br />
05-06/06-07 0.857 0.922 1.053 1.103 0.898 0.978 1.000 0.979 1.039 1.020 0.938 1.019 0.914<br />
06-07/07-08 0.868 0.955 0.936 1.025 1.047 0.932 1.000 0.942 0.957 0.962 0.961 1.044 0.906<br />
07-08/08-09 0.837 1.063 1.167 1.000 1.024 1.022 0.927 1.067 1.000 0.933 1.020 0.980 1.043<br />
08-09/09-10 0.821 0.966 1.000 1.041 1.045 0.976 1.022 0.895 1.021 1.041 1.071 1.000 1.021<br />
Baseline 0.765 0.999 1.047 1.032 1.044 1.005 0.992 0.999 1.004 1.015 0.981 1.017 0.968<br />
5 Year Trend 0.843 0.981 1.054 1.026 1.003 0.986 0.990 0.977 1.003 0.991 0.998 1.009 0.958<br />
2 Year "Trend" 0.829 1.014 1.083 1.020 1.035 0.999 0.974 0.981 1.010 0.987 1.046 0.990 1.032<br />
*Shaded progression ratios are excluded from the Baseline Average<br />
The grade progression ratios can be interpreted in the following manner. The Baseline ratio for K:1<br />
is .999. This means that in the <strong>Johnson</strong> <strong>Creek</strong> School District, the first grade is on average .1% smaller<br />
each year than the kindergarten class was the previous year (the result of transfers to other schools<br />
and out-migration from the district), though the ratio is incredibly close to one, and very little loss of<br />
students is occurring. The B:K (birth to kindergarten) Baseline ratio of 0.765 indicates that on average,<br />
approximately 76.5% of the births in the Village of <strong>Johnson</strong> <strong>Creek</strong> and Towns of Farmington and<br />
Watertown from five years previous enroll in kindergarten in <strong>Johnson</strong> <strong>Creek</strong> School District. Outliers<br />
(ratios outside of one standard deviation of the mean) are not included in the calculation of the<br />
Baseline average ratios.<br />
In order to examine future enrollment under different growth assumptions, we generate three sets<br />
of grade progression ratios that correspond to the different projection models shown later in this<br />
report. In addition to the Baseline ratios (averages 10 years of data), we examine rates of transfer in<br />
the last 5 years and the last 2 years, effectively weighing enrollment change patterns from different<br />
time periods more heavily than the Baseline. Any significant deviations from the rates of in- and outmigration<br />
in the district area will have a corresponding effect on enrollment. These additional models<br />
allow us to examine alternative outcomes compared to the overall trends of the Baseline model.<br />
Figure 6 shows the differences between these three sets of grade progression ratios.<br />
School <strong>Enrollment</strong> Projection Series: <strong>Johnson</strong> <strong>Creek</strong> School District 19
Grade Progression Ratio<br />
Figure 6<br />
1.150<br />
<strong>Johnson</strong> <strong>Creek</strong> School District<br />
Grade Progression Ratios, by Model<br />
1.100<br />
1.050<br />
1.000<br />
0.950<br />
0.900<br />
0.850<br />
0.800<br />
0.750<br />
B:K K:1 1:2 2:3 3:4 4:5 5:6 6:7 7:8 8:9 9:10 10:11 11:12<br />
Baseline Trend 5 Year Trend 2 Year Trend<br />
Looking at the Last 2 Year “Trend” ratios, the K:1 ratio (1.014) shows that in the last two years as<br />
students advanced from Kindergarten to first grade, the school district gained an average of 1.4% of<br />
students each year. Grade progression ratios in the last two years have been particularly high for K:1,<br />
1:2, :10, and 11:12, suggesting more in-migration of students at these grade levels.<br />
School <strong>Enrollment</strong> Projection Series: <strong>Johnson</strong> <strong>Creek</strong> School District 20
School <strong>Enrollment</strong> <strong>Projections</strong>, 2010-2019<br />
When considering all of the projections provided in this report for decision-making, it is important<br />
to recognize that population projections of all types, including school enrollment projections, are more<br />
accurate in the immediate future than they are farther into the future. This is especially true for<br />
grades K-5, because the students who will enter kindergarten after 2014 have not yet been born.<br />
Overall, our projections are more reliable over the next five years (up to the 2014/15 school year) than<br />
they are in the latter half of the next decade.<br />
4K <strong>Enrollment</strong> <strong>Projections</strong><br />
In the 2008/09 school year the <strong>Johnson</strong> <strong>Creek</strong> School District started a 4K program within the<br />
district. Given that there are now only two years of data for this program, the Applied Population<br />
Laboratory is unable to project 4K enrollment for most models due to a lack of data. <strong>Projections</strong> are<br />
included, however, for the 2 Year Trend model, which incorporates data from the last two years of<br />
enrollment.<br />
On average, in the past two years, 75.4% of children born within the district four years previous<br />
enroll in 4K in the <strong>Johnson</strong> <strong>Creek</strong> School District. Kindergarten enrollment this year was 10% larger<br />
than 4K enrollment in the 2008/09 school year.<br />
While projections are provided for one model, it is important to note that trends and enrollment in<br />
4K may not have stabilized, and the percentage of students enrolling in 4K in the past two years is not<br />
necessarily indicative of the number of 4K students that will enroll in the next decade. Interest and<br />
enrollment in 4K should be monitored closely to determine the future trajectory of 4K enrollment.<br />
School <strong>Enrollment</strong> Projection Series: <strong>Johnson</strong> <strong>Creek</strong> School District 21
Baseline Projection<br />
The Baseline model (Table 8) projects enrollments using the assumption that average trends year<br />
to year, grade to grade, will continue into the future. This model assumes that long term (past ten<br />
years) trends in enrollment, migration, and births will be representative of future trends in the district.<br />
This model projects that K-12 enrollment will increase over the next decade, projecting that K-12<br />
enrollment will increase by 162 students (a 25.8% increase) by 2019/20. Within the next five years<br />
enrollment is projected to increase by 72 students (an 11.5% increase).<br />
TABLE 8<br />
Baseline Projection Model<br />
<strong>Johnson</strong> <strong>Creek</strong> School District<br />
SCHOOL YEAR<br />
10-11 11-12 12-13 13-14 14-15 15-16 16-17 17-18 18-19 19-20<br />
K 50 56 62 60 55 54 55 55 56 56<br />
1 55 50 56 62 60 55 54 55 55 55<br />
2 59 58 53 58 65 63 58 57 57 58<br />
3 53 61 59 54 60 67 65 60 59 59<br />
4 53 55 63 62 57 63 70 68 63 61<br />
5 46 54 55 64 62 57 63 70 68 63<br />
6 41 46 53 55 63 62 57 63 69 67<br />
7 47 41 46 53 55 63 62 56 63 69<br />
8 34 47 41 46 53 55 63 62 57 63<br />
9 50 35 48 41 47 54 56 64 63 57<br />
10 50 49 34 47 41 46 53 55 63 62<br />
11 46 51 50 35 48 41 47 54 56 64<br />
12 50 44 49 48 33 46 40 45 52 54<br />
K-12 634 645 668 685 699 726 742 763 780 789<br />
K-12 634 645 668 685 699 726 742 763 780 789<br />
K-6 357 379 401 415 422 421 421 427 426 420<br />
7-8 81 88 87 99 108 118 125 119 119 132<br />
9-12 196 179 181 171 168 187 195 218 234 237<br />
School <strong>Enrollment</strong> Projection Series: <strong>Johnson</strong> <strong>Creek</strong> School District 22
5 Year Trend Projection<br />
The 5 Year Trend model (Table 9) uses the grade progression ratios from the last five years and<br />
recent trends in the number of births in the school district area to project what future enrollments<br />
would look like if more recent patterns were representative of future trends. With recent migration<br />
rates and birth trends weighted more heavily, K-12 enrollment in the <strong>Johnson</strong> <strong>Creek</strong> School District is<br />
projected to increase at a higher rate than the Baseline model over the next decade, projecting an<br />
increase of 240 students (38.3%).<br />
Within the next five years enrollment is projected to increase by 76 students (12.1%).<br />
TABLE 9<br />
5 Year Trend Projection Model<br />
<strong>Johnson</strong> <strong>Creek</strong> School District<br />
SCHOOL YEAR<br />
GRADE 10-11 11-12 12-13 13-14 14-15 15-16 16-17 17-18 18-19 19-20<br />
K 55 62 68 66 66 69 72 74 77 79<br />
1 54 54 60 67 65 65 68 70 73 75<br />
2 59 57 57 64 70 68 69 71 74 77<br />
3 52 61 58 59 65 72 70 70 73 76<br />
4 51 52 61 58 59 65 72 70 71 73<br />
5 45 50 52 60 58 58 64 71 69 69<br />
6 41 45 50 51 59 57 57 64 71 68<br />
7 46 40 44 49 50 58 56 56 62 69<br />
8 34 46 40 44 49 50 58 56 56 63<br />
9 49 34 46 39 44 48 50 58 55 56<br />
10 51 48 34 46 39 43 48 50 57 55<br />
11 45 51 49 34 46 40 44 49 50 58<br />
12 50 43 49 47 33 44 38 42 47 48<br />
K-12 632 644 667 683 703 739 766 801 835 867<br />
K-12 632 644 667 683 703 739 766 801 835 867<br />
K-6 358 381 406 424 442 455 472 491 507 518<br />
6-8 80 86 84 93 99 108 114 112 119 131<br />
9-12 195 177 177 166 161 176 180 198 210 217<br />
School <strong>Enrollment</strong> Projection Series: <strong>Johnson</strong> <strong>Creek</strong> School District 23
2 Year “Trend” Projection<br />
The 2 Year “Trend” model (Table 10) uses the progression ratios from the last two years to project<br />
what future enrollments would look like if even more recent patterns were representative of future<br />
trends. For the Last 2 Year “Trend,” K-12 enrollment is projected to increase from 627 students in<br />
2009/10 to 924 students in 2019/20. This is an increase of 297 students (47.4%) over the next decade.<br />
Within the next five years enrollment is projected to increase by 105 students, or 16.7%. 4K enrollment<br />
is projected to increase from 50 students in 2009/10 to 62 students by 2014/15 and 73 students by<br />
2019/20.<br />
This model projects the highest amount of enrollment increase for two reasons. First, the relatively<br />
high grade progression ratios (rates of migration and transfers into the district) that the district has<br />
experienced in the last two years, and the higher projected births for the second half of the decade<br />
(the Recent Trend birth projections). This model should be interpreted with some caution—if future<br />
migration into the school district continues at the relatively high rate experienced in the last two to<br />
three years, and births increase at the same rate as they have in the past few years, then this model<br />
should be appropriate. Still, it is important to note that ratios can be variable year to year and very<br />
short term trends (2 years) do not often continue into the future, unless there has been a substantive<br />
change in the district that has impacted migration levels and this change is expected to continue to<br />
affect migration into the future. Births should also be closely monitored, as recessions tend to<br />
decrease births in the short term, though this is not necessarily true for every school district.<br />
TABLE 10<br />
2 Year "Trend" Projection Model<br />
<strong>Johnson</strong> <strong>Creek</strong> School District<br />
SCHOOL YEAR<br />
GRADE 10-11 11-12 12-13 13-14 14-15 15-16 16-17 17-18 18-19 19-20<br />
4K 55 61 59 59 62 64 66 69 71 73<br />
K 54 60 67 65 65 68 70 73 75 78<br />
1 56 55 61 68 66 66 69 71 74 76<br />
2 61 60 60 66 73 71 72 75 77 80<br />
3 52 62 62 61 68 75 73 73 76 79<br />
4 53 54 64 64 63 70 78 75 76 79<br />
5 46 53 54 64 64 63 70 77 75 76<br />
6 40 45 51 52 62 62 61 68 75 73<br />
7 46 39 44 50 51 61 61 60 67 74<br />
8 34 47 40 44 51 52 62 62 61 68<br />
9 48 34 46 39 44 50 51 61 61 60<br />
10 53 51 35 48 41 46 53 54 64 64<br />
11 45 53 50 35 48 40 45 52 53 63<br />
12 54 46 54 52 36 49 42 47 54 55<br />
K-12 642 658 688 709 732 774 806 848 888 924<br />
4K-12 697 719 747 768 794 838 873 917 959 997<br />
K-6 362 389 419 440 462 476 493 513 529 541<br />
7-8 80 86 84 95 102 113 123 122 128 142<br />
9-12 200 183 186 174 168 186 191 213 231 242<br />
School <strong>Enrollment</strong> Projection Series: <strong>Johnson</strong> <strong>Creek</strong> School District 24
Kindergarten Trend Projection<br />
For this method we perform a trend analysis to project the number of future kindergarten<br />
students, rather than relying upon the traditional birth to kindergarten (B:K) progression ratio. Then,<br />
the 5 Year Trend progression ratios are used for projecting the other grades (1-12) in the district. In<br />
other words, this model assumes that the number of new kindergarteners each year over the next<br />
decade will continue to follow a trend similar to the trend in kindergarten enrollment change over the<br />
last seven years, regardless of the number of observed births in the school district area.<br />
According to this hybrid projection method (Table 11), K-12 enrollment would increase only slightly<br />
over the next decade. A good way to think about the projections provided by this model is that if the<br />
number of new kindergarteners continues to increase (as they have over the last several years) and if<br />
patterns of transfers in and out of the district continue as they have over the past five years, then the<br />
Kindergarten Regression model should provide a good prediction of future enrollment.<br />
TABLE 11<br />
Kindergarten Trend Projection Model<br />
<strong>Johnson</strong> <strong>Creek</strong> School District<br />
GRADE 10-11 11-12 12-13 13-14 14-15 15-16 16-17 17-18 18-19 19-20<br />
K 56 58 60 62 64 67 69 71 73 75<br />
1 54 55 57 59 61 63 65 67 70 72<br />
2 59 57 57 60 62 64 67 69 71 73<br />
3 52 61 58 59 61 64 66 68 71 73<br />
4 51 52 61 58 59 61 64 66 68 71<br />
5 45 50 52 60 58 58 61 63 65 68<br />
6 41 45 50 51 59 57 58 60 62 65<br />
7 46 40 44 49 50 58 56 56 59 61<br />
8 34 46 40 44 49 50 58 56 57 59<br />
9 49 34 46 39 44 48 50 58 55 56<br />
10 51 48 34 46 39 43 48 50 57 55<br />
11 45 51 49 34 46 40 44 49 50 58<br />
12 50 43 49 47 33 44 38 42 47 48<br />
K-12 633 640 656 668 685 718 742 775 805 833<br />
K-12 633 640 656 668 685 718 742 775 805 833<br />
K-6 358 377 395 409 425 434 449 465 481 496<br />
7-8 80 86 84 93 99 108 114 112 115 120<br />
9-12 195 177 177 166 161 176 180 198 210 217<br />
School <strong>Enrollment</strong> Projection Series: <strong>Johnson</strong> <strong>Creek</strong> School District 25
Comparison of Projection Models<br />
Figures 7-10 and Tables 12-15 compare the four enrollment projection models broken down by<br />
total K-12 district enrollment and by grade groupings.<br />
Figure 7<br />
1,000<br />
<strong>Johnson</strong> <strong>Creek</strong> School District<br />
K-12 <strong>Enrollment</strong> History and <strong>Projections</strong><br />
900<br />
800<br />
700<br />
600<br />
500<br />
400<br />
300<br />
200<br />
100<br />
0<br />
Baseline 5 Year Trend 2 Year Trend Kindergarten Trend Actual<br />
TABLE 14<br />
Summary of K-12 <strong>Enrollment</strong> <strong>Projections</strong><br />
<strong>Johnson</strong> <strong>Creek</strong> School District<br />
10-11 11-12 12-13 13-14 14-15 15-16 16-17 17-18 18-19 19-20<br />
Baseline 634 645 668 685 699 726 742 763 780 789<br />
5 Year Trend 632 644 667 683 703 739 766 801 835 867<br />
2 Year "Trend" 642 658 688 709 732 774 806 848 888 924<br />
Kindergarten Trend 633 640 656 668 685 718 742 775 805 833<br />
All of the models presented show enrollment growth (at varying levels) over the next decade.<br />
District-wide K-12 enrollment projections five years from now (2014) predict a range of enrollment<br />
from 685 (Kindergarten Trend Model) to 732 (2 Year Trend Model).<br />
School <strong>Enrollment</strong> Projection Series: <strong>Johnson</strong> <strong>Creek</strong> School District 26
Figure 8<br />
600<br />
<strong>Johnson</strong> <strong>Creek</strong> School District<br />
K-6 <strong>Enrollment</strong> History and <strong>Projections</strong><br />
500<br />
400<br />
300<br />
200<br />
100<br />
0<br />
Baseline 5 Year Trend 2 Year Trend Kindergarten Trend Actual<br />
TABLE 15<br />
Summary of K-6 <strong>Enrollment</strong> <strong>Projections</strong><br />
<strong>Johnson</strong> <strong>Creek</strong> School District<br />
10-11 11-12 12-13 13-14 14-15 15-16 16-17 17-18 18-19 19-20<br />
Baseline 357 379 401 415 422 421 421 427 426 420<br />
5 Year Trend 358 381 406 424 442 455 472 491 507 518<br />
2 Year "Trend" 362 389 419 440 462 476 493 513 529 541<br />
Kindergarten Trend 358 377 395 409 425 434 449 465 481 496<br />
For grades K-6 all of the models presented point to increasing enrollment over the next decade.<br />
This is due to an increasing trend of births in the long term, and a very quick increase of births in the<br />
past few years in particular. <strong>Enrollment</strong> projections for K-6 enrollment five years out range from a low<br />
of 422 students (Baseline Model) to a high of 440 students (2 Year Trend Model).<br />
School <strong>Enrollment</strong> Projection Series: <strong>Johnson</strong> <strong>Creek</strong> School District 27
Figure 9<br />
160<br />
<strong>Johnson</strong> <strong>Creek</strong> School District<br />
7-8 <strong>Enrollment</strong> History and <strong>Projections</strong><br />
140<br />
120<br />
100<br />
80<br />
60<br />
40<br />
20<br />
0<br />
Baseline 5 Year Trend 2 Year Trend Kindergarten Trend Actual<br />
TABLE 16<br />
Summary of 7-8 <strong>Enrollment</strong> <strong>Projections</strong><br />
<strong>Johnson</strong> <strong>Creek</strong> School District<br />
10-11 11-12 12-13 13-14 14-15 15-16 16-17 17-18 18-19 19-20<br />
Baseline 81 88 87 99 108 118 125 119 119 132<br />
5 Year Trend 80 86 84 93 99 108 114 112 119 131<br />
2 Year "Trend" 80 86 84 95 102 113 123 122 128 142<br />
Kindergarten Trend 80 86 84 93 99 108 114 112 115 120<br />
At the junior high grade levels, all of the models substantial increases over current enrollment over<br />
the next several years due to current small cohorts in grades 7 and 8, and larger existing cohorts and<br />
projected births over the next decade. <strong>Enrollment</strong> projections for five years out (2014/15) range from<br />
a low of 99 students (5 Year Trend and Kindergarten Regression models) to a high of 108 students<br />
(Baseline model).<br />
School <strong>Enrollment</strong> Projection Series: <strong>Johnson</strong> <strong>Creek</strong> School District 28
Figure 10<br />
300<br />
<strong>Johnson</strong> <strong>Creek</strong> School District<br />
9-12 <strong>Enrollment</strong> History and <strong>Projections</strong><br />
250<br />
200<br />
150<br />
100<br />
50<br />
0<br />
Baseline 5 Year Trend 2 Year Trend Kindergarten Trend Actual<br />
TABLE 17<br />
Summary of 9-12 <strong>Enrollment</strong> <strong>Projections</strong><br />
<strong>Johnson</strong> <strong>Creek</strong> School District<br />
10-11 11-12 12-13 13-14 14-15 15-16 16-17 17-18 18-19 19-20<br />
Baseline 196 179 181 171 168 187 195 218 234 237<br />
5 Year Trend 195 177 177 166 161 176 180 198 210 217<br />
2 Year "Trend" 200 183 186 174 168 186 191 213 231 242<br />
Kindergarten Trend 195 177 177 166 161 176 180 198 210 217<br />
All of the models project decreasing enrollment at the high school level over the next five years.<br />
This is mainly due to current large cohorts of high school students that will graduate, followed by<br />
smaller cohorts of students entering high school in the near future. After this point, as the larger<br />
cohorts currently in Elementary school move into high school, enrollment is projected to increase<br />
substantially. All of the models project declining high school enrollment over the next five years, with<br />
enrollment projections in 2014/15 ranging from a low of 161 students (5 Year Trend/Kindergarten<br />
Regression Model) to a high of 168 students (Baseline Model and 2 Year “Trend” Model).<br />
School <strong>Enrollment</strong> Projection Series: <strong>Johnson</strong> <strong>Creek</strong> School District 29
Conclusions<br />
These district-level enrollment projections are based on models that incorporate recent past and<br />
current demographic information as well as the district’s own enrollment data. Because most of the<br />
students in the district’s schools over the next few years have already been born or are already in<br />
school, and because their grade progression from one year to another is highly predictable, the total<br />
district-level projections should be viewed as having high accuracy over the next few years. After a few<br />
years, and increasingly for the lower elementary grades, actual enrollment figures will likely deviate<br />
from these projections by ever increasing amounts. The reason for this is that birth trends, inmigration<br />
of pre-school age children, and transfers into the district are more difficult to predict and<br />
therefore this makes meaningful incorporation into enrollment projections a challenge. As with nearly<br />
all types of forecasts, accuracy in these enrollment projections decreases over time.<br />
In sum, the information provided in this school enrollment projection report points to increasing<br />
enrollment in the <strong>Johnson</strong> <strong>Creek</strong> School District over the next decade. The Last Two Year “Trend”<br />
model projects substantially higher enrollment than the other models. This is because it is based upon<br />
relatively high grade progression ratios and the rate of increasing births experienced in the district in<br />
the last two years. If these higher levels of in-migration and transfers into the district are not<br />
continued into the future, or if the number of births in the district declines, then this model will not be<br />
valid. If these higher levels become a new trend in the district and are continued, then the Last Two<br />
Year Trend model would be an important model to consider. Also of note, the Baseline model projects<br />
substantially lower enrollment in the latter half of the decade than the other models, particularly at<br />
the elementary school level. This is a result of the slower rate of increase in births as compared to the<br />
much quicker increase in births seen in the past few years. If the recession causes the increase in<br />
births to slow, or creates a sustained period of no housing development in the district, the Baseline<br />
model might be an important model to consider. <strong>Enrollment</strong> projections for the other two models<br />
provided (the 5 Year Trend and Kindergarten Regression models) provide projections that fall<br />
somewhere between the Baseline and 2 Year Trend models at the end of the decade.<br />
Because the projections found in this report incorporate the consequences of migration to and<br />
from the Village and Towns, any significant and sustained interruption of current or recent past<br />
migration patterns will erode these models’ accuracy from the initiation point of the new pattern. The<br />
various projection models provide a realistic range of migration and transfer effects on the school<br />
district. <strong>Enrollment</strong> growth should be closely monitored for the next few years, and compared with<br />
these projections, to determine the trajectory of future growth. This type of monitoring program might<br />
help the district to determine which of the models seems to be the most realistic to use for planning<br />
purposes.<br />
School <strong>Enrollment</strong> Projection Series: <strong>Johnson</strong> <strong>Creek</strong> School District 30