Enrollment Projections - Johnson Creek Public Schools
Enrollment Projections - Johnson Creek Public Schools
Enrollment Projections - Johnson Creek Public Schools

You also want an ePaper? Increase the reach of your titles
YUMPU automatically turns print PDFs into web optimized ePapers that Google loves.
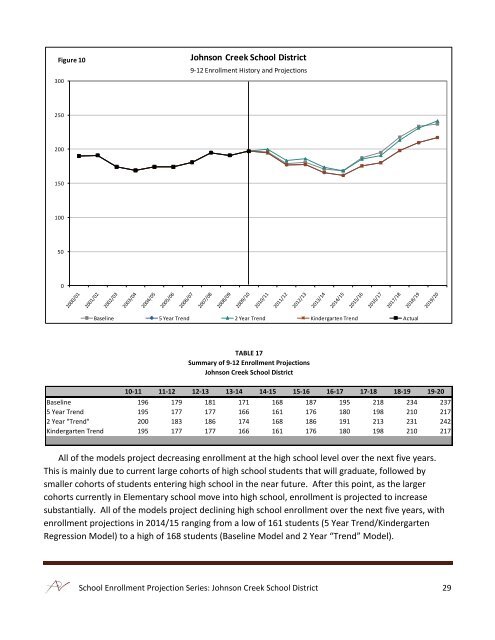
Figure 10<br />
300<br />
<strong>Johnson</strong> <strong>Creek</strong> School District<br />
9-12 <strong>Enrollment</strong> History and <strong>Projections</strong><br />
250<br />
200<br />
150<br />
100<br />
50<br />
0<br />
Baseline 5 Year Trend 2 Year Trend Kindergarten Trend Actual<br />
TABLE 17<br />
Summary of 9-12 <strong>Enrollment</strong> <strong>Projections</strong><br />
<strong>Johnson</strong> <strong>Creek</strong> School District<br />
10-11 11-12 12-13 13-14 14-15 15-16 16-17 17-18 18-19 19-20<br />
Baseline 196 179 181 171 168 187 195 218 234 237<br />
5 Year Trend 195 177 177 166 161 176 180 198 210 217<br />
2 Year "Trend" 200 183 186 174 168 186 191 213 231 242<br />
Kindergarten Trend 195 177 177 166 161 176 180 198 210 217<br />
All of the models project decreasing enrollment at the high school level over the next five years.<br />
This is mainly due to current large cohorts of high school students that will graduate, followed by<br />
smaller cohorts of students entering high school in the near future. After this point, as the larger<br />
cohorts currently in Elementary school move into high school, enrollment is projected to increase<br />
substantially. All of the models project declining high school enrollment over the next five years, with<br />
enrollment projections in 2014/15 ranging from a low of 161 students (5 Year Trend/Kindergarten<br />
Regression Model) to a high of 168 students (Baseline Model and 2 Year “Trend” Model).<br />
School <strong>Enrollment</strong> Projection Series: <strong>Johnson</strong> <strong>Creek</strong> School District 29