PROOF

You also want an ePaper? Increase the reach of your titles
YUMPU automatically turns print PDFs into web optimized ePapers that Google loves.
HOUSEHOLD FOOD INSECURITY IN CANADA, 2012<br />
Food Insecurity since 2005<br />
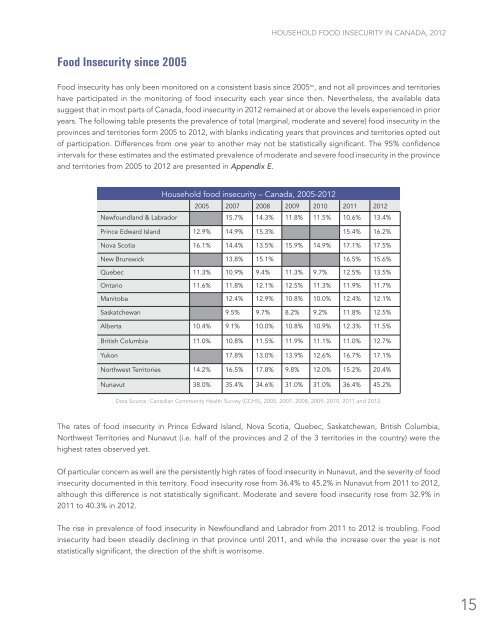
Food insecurity has only been monitored on a consistent basis since 2005 xv , and not all provinces and territories<br />
have participated in the monitoring of food insecurity each year since then. Nevertheless, the available data<br />
suggest that in most parts of Canada, food insecurity in 2012 remained at or above the levels experienced in prior<br />
years. The following table presents the prevalence of total (marginal, moderate and severe) food insecurity in the<br />
provinces and territories form 2005 to 2012, with blanks indicating years that provinces and territories opted out<br />
of participation. Differences from one year to another may not be statistically significant. The 95% confidence<br />
intervals for these estimates and the estimated prevalence of moderate and severe food insecurity in the province<br />
and territories from 2005 to 2012 are presented in Appendix E.<br />
Household food insecurity – Canada, 2005-2012<br />
2005 2007 2008 2009 2010 2011 2012<br />
Newfoundland & Labrador 15.7% 14.3% 11.8% 11.5% 10.6% 13.4%<br />
Prince Edward Island 12.9% 14.9% 15.3% 15.4% 16.2%<br />
Nova Scotia 16.1% 14.4% 13.5% 15.9% 14.9% 17.1% 17.5%<br />
New Brunswick 13.8% 15.1% 16.5% 15.6%<br />
Quebec 11.3% 10.9% 9.4% 11.3% 9.7% 12.5% 13.5%<br />
Ontario 11.6% 11.8% 12.1% 12.5% 11.3% 11.9% 11.7%<br />
Manitoba 12.4% 12.9% 10.8% 10.0% 12.4% 12.1%<br />
Saskatchewan 9.5% 9.7% 8.2% 9.2% 11.8% 12.5%<br />
Alberta 10.4% 9.1% 10.0% 10.8% 10.9% 12.3% 11.5%<br />
British Columbia 11.0% 10.8% 11.5% 11.9% 11.1% 11.0% 12.7%<br />
Yukon 17.8% 13.0% 13.9% 12.6% 16.7% 17.1%<br />
Northwest Territories 14.2% 16.5% 17.8% 9.8% 12.0% 15.2% 20.4%<br />
Nunavut 38.0% 35.4% 34.6% 31.0% 31.0% 36.4% 45.2%<br />
Data Source: Canadian Community Health Survey (CCHS), 2005, 2007, 2008, 2009, 2010, 2011 and 2012.<br />
The rates of food insecurity in Prince Edward Island, Nova Scotia, Quebec, Saskatchewan, British Columbia,<br />
Northwest Territories and Nunavut (i.e. half of the provinces and 2 of the 3 territories in the country) were the<br />
highest rates observed yet.<br />
Of particular concern as well are the persistently high rates of food insecurity in Nunavut, and the severity of food<br />
insecurity documented in this territory. Food insecurity rose from 36.4% to 45.2% in Nunavut from 2011 to 2012,<br />
although this difference is not statistically significant. Moderate and severe food insecurity rose from 32.9% in<br />
2011 to 40.3% in 2012.<br />
The rise in prevalence of food insecurity in Newfoundland and Labrador from 2011 to 2012 is troubling. Food<br />
insecurity had been steadily declining in that province until 2011, and while the increase over the year is not<br />
statistically significant, the direction of the shift is worrisome.<br />
15