PROOF

You also want an ePaper? Increase the reach of your titles
YUMPU automatically turns print PDFs into web optimized ePapers that Google loves.
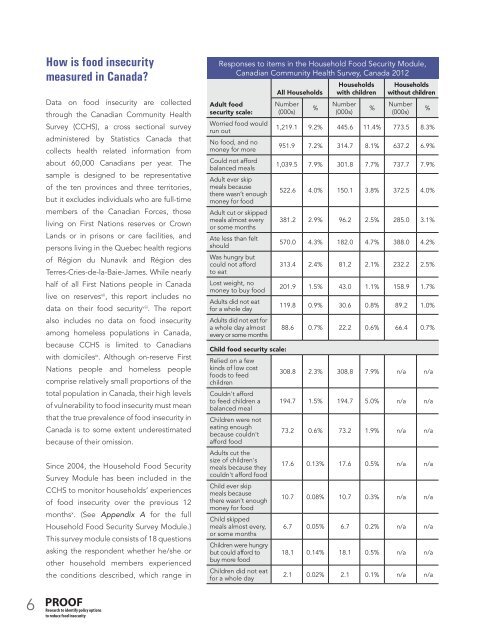
How is food insecurity<br />
measured in Canada?<br />
Data on food insecurity are collected<br />
through the Canadian Community Health<br />
Survey (CCHS), a cross sectional survey<br />
administered by Statistics Canada that<br />
collects health related information from<br />
about 60,000 Canadians per year. The<br />
sample is designed to be representative<br />
of the ten provinces and three territories,<br />
but it excludes individuals who are full-time<br />
members of the Canadian Forces, those<br />
living on First Nations reserves or Crown<br />
Lands or in prisons or care facilities, and<br />
persons living in the Quebec health regions<br />
of Région du Nunavik and Région des<br />
Terres-Cries-de-la-Baie-James. While nearly<br />
half of all First Nations people in Canada<br />
live on reserves vii , this report includes no<br />
data on their food security viii . The report<br />
also includes no data on food insecurity<br />
among homeless populations in Canada,<br />
because CCHS is limited to Canadians<br />
with domiciles ix . Although on-reserve First<br />
Nations people and homeless people<br />
comprise relatively small proportions of the<br />
total population in Canada, their high levels<br />
of vulnerability to food insecurity must mean<br />
that the true prevalence of food insecurity in<br />
Canada is to some extent underestimated<br />
because of their omission.<br />
Since 2004, the Household Food Security<br />
Survey Module has been included in the<br />
CCHS to monitor households’ experiences<br />
of food insecurity over the previous 12<br />
months x . (See Appendix A for the full<br />
Household Food Security Survey Module.)<br />
This survey module consists of 18 questions<br />
asking the respondent whether he/she or<br />
other household members experienced<br />
the conditions described, which range in<br />
Responses to items in the Household Food Security Module,<br />
Canadian Community Health Survey, Canada 2012<br />
Adult food<br />
security scale:<br />
Worried food would<br />
run out<br />
No food, and no<br />
money for more<br />
Could not afford<br />
balanced meals<br />
Adult ever skip<br />
meals because<br />
there wasn’t enough<br />
money for food<br />
Adult cut or skipped<br />
meals almost every<br />
or some months<br />
Ate less than felt<br />
should<br />
Was hungry but<br />
could not afford<br />
to eat<br />
Lost weight, no<br />
money to buy food<br />
Adults did not eat<br />
for a whole day<br />
Adults did not eat for<br />
a whole day almost<br />
every or some months<br />
Child food security scale:<br />
Relied on a few<br />
kinds of low cost<br />
foods to feed<br />
children<br />
Couldn't afford<br />
to feed children a<br />
balanced meal<br />
Children were not<br />
eating enough<br />
because couldn't<br />
afford food<br />
Adults cut the<br />
size of children's<br />
meals because they<br />
couldn't afford food<br />
Child ever skip<br />
meals because<br />
there wasn't enough<br />
money for food<br />
Child skipped<br />
meals almost every,<br />
or some months<br />
Children were hungry<br />
but could afford to<br />
buy more food<br />
Children did not eat<br />
for a whole day<br />
All Households<br />
Number<br />
(000s)<br />
%<br />
Households<br />
with children<br />
Number<br />
(000s)<br />
%<br />
Households<br />
without children<br />
Number<br />
(000s)<br />
1,219.1 9.2% 445.6 11.4% 773.5 8.3%<br />
951.9 7.2% 314.7 8.1% 637.2 6.9%<br />
1,039.5 7.9% 301.8 7.7% 737.7 7.9%<br />
522.6 4.0% 150.1 3.8% 372.5 4.0%<br />
381.2 2.9% 96.2 2.5% 285.0 3.1%<br />
570.0 4.3% 182.0 4.7% 388.0 4.2%<br />
313.4 2.4% 81.2 2.1% 232.2 2.5%<br />
201.9 1.5% 43.0 1.1% 158.9 1.7%<br />
119.8 0.9% 30.6 0.8% 89.2 1.0%<br />
88.6 0.7% 22.2 0.6% 66.4 0.7%<br />
308.8 2.3% 308.8 7.9% n/a n/a<br />
194.7 1.5% 194.7 5.0% n/a n/a<br />
73.2 0.6% 73.2 1.9% n/a n/a<br />
17.6 0.13% 17.6 0.5% n/a n/a<br />
10.7 0.08% 10.7 0.3% n/a n/a<br />
6.7 0.05% 6.7 0.2% n/a n/a<br />
18.1 0.14% 18.1 0.5% n/a n/a<br />
2.1 0.02% 2.1 0.1% n/a n/a<br />
%<br />
6 <strong>PROOF</strong><br />
Research to identify policy options<br />
to reduce food insecurity