PROOF

Create successful ePaper yourself
Turn your PDF publications into a flip-book with our unique Google optimized e-Paper software.
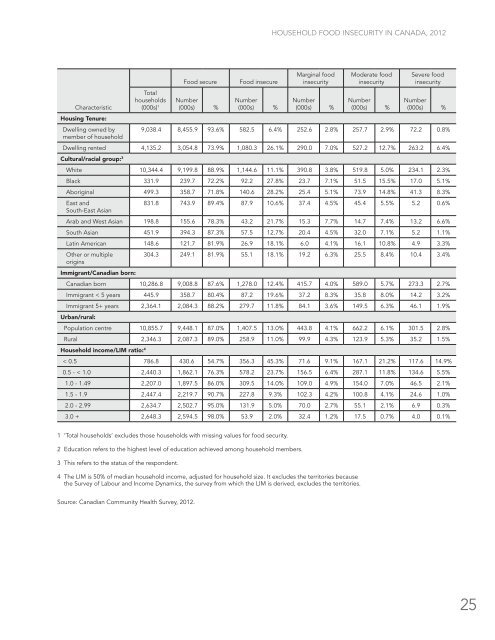
HOUSEHOLD FOOD INSECURITY IN CANADA, 2012<br />
Characteristic<br />
Housing Tenure:<br />
Dwelling owned by<br />
member of household<br />
Total<br />
households<br />
(000s) 1<br />
Food secure<br />
Number<br />
(000s) %<br />
Food insecure<br />
Number<br />
(000s) %<br />
Marginal food<br />
insecurity<br />
Number<br />
(000s) %<br />
Moderate food<br />
insecurity<br />
Number<br />
(000s) %<br />
Severe food<br />
insecurity<br />
Number<br />
(000s) %<br />
9,038.4 8,455.9 93.6% 582.5 6.4% 252.6 2.8% 257.7 2.9% 72.2 0.8%<br />
Dwelling rented 4,135.2 3,054.8 73.9% 1,080.3 26.1% 290.0 7.0% 527.2 12.7% 263.2 6.4%<br />
Cultural/racial group: 3<br />
White 10,344.4 9,199.8 88.9% 1,144.6 11.1% 390.8 3.8% 519.8 5.0% 234.1 2.3%<br />
Black 331.9 239.7 72.2% 92.2 27.8% 23.7 7.1% 51.5 15.5% 17.0 5.1%<br />
Aboriginal 499.3 358.7 71.8% 140.6 28.2% 25.4 5.1% 73.9 14.8% 41.3 8.3%<br />
East and<br />
South-East Asian<br />
831.8 743.9 89.4% 87.9 10.6% 37.4 4.5% 45.4 5.5% 5.2 0.6%<br />
Arab and West Asian 198.8 155.6 78.3% 43.2 21.7% 15.3 7.7% 14.7 7.4% 13.2 6.6%<br />
South Asian 451.9 394.3 87.3% 57.5 12.7% 20.4 4.5% 32.0 7.1% 5.2 1.1%<br />
Latin American 148.6 121.7 81.9% 26.9 18.1% 6.0 4.1% 16.1 10.8% 4.9 3.3%<br />
Other or multiple<br />
origins<br />
Immigrant/Canadian born:<br />
304.3 249.1 81.9% 55.1 18.1% 19.2 6.3% 25.5 8.4% 10.4 3.4%<br />
Canadian born 10,286.8 9,008.8 87.6% 1,278.0 12.4% 415.7 4.0% 589.0 5.7% 273.3 2.7%<br />
Immigrant < 5 years 445.9 358.7 80.4% 87.2 19.6% 37.2 8.3% 35.8 8.0% 14.2 3.2%<br />
Immigrant 5+ years 2,364.1 2,084.3 88.2% 279.7 11.8% 84.1 3.6% 149.5 6.3% 46.1 1.9%<br />
Urban/rural:<br />
Population centre 10,855.7 9,448.1 87.0% 1,407.5 13.0% 443.8 4.1% 662.2 6.1% 301.5 2.8%<br />
Rural 2,346.3 2,087.3 89.0% 258.9 11.0% 99.9 4.3% 123.9 5.3% 35.2 1.5%<br />
Household income/LIM ratio: 4<br />
< 0.5 786.8 430.6 54.7% 356.3 45.3% 71.6 9.1% 167.1 21.2% 117.6 14.9%<br />
0.5 - < 1.0 2,440.3 1,862.1 76.3% 578.2 23.7% 156.5 6.4% 287.1 11.8% 134.6 5.5%<br />
1.0 - 1.49 2,207.0 1,897.5 86.0% 309.5 14.0% 109.0 4.9% 154.0 7.0% 46.5 2.1%<br />
1.5 - 1.9 2,447.4 2,219.7 90.7% 227.8 9.3% 102.3 4.2% 100.8 4.1% 24.6 1.0%<br />
2.0 - 2.99 2,634.7 2,502.7 95.0% 131.9 5.0% 70.0 2.7% 55.1 2.1% 6.9 0.3%<br />
3.0 + 2,648.3 2,594.5 98.0% 53.9 2.0% 32.4 1.2% 17.5 0.7% 4.0 0.1%<br />
1 ‘Total households’ excludes those households with missing values for food security.<br />
2 Education refers to the highest level of education achieved among household members.<br />
3 This refers to the status of the respondent.<br />
4 The LIM is 50% of median household income, adjusted for household size. It excludes the territories because<br />
the Survey of Labour and Income Dynamics, the survey from which the LIM is derived, excludes the territories.<br />
Source: Canadian Community Health Survey, 2012.<br />
25