2005 - The Weir Group
2005 - The Weir Group
2005 - The Weir Group

Create successful ePaper yourself
Turn your PDF publications into a flip-book with our unique Google optimized e-Paper software.
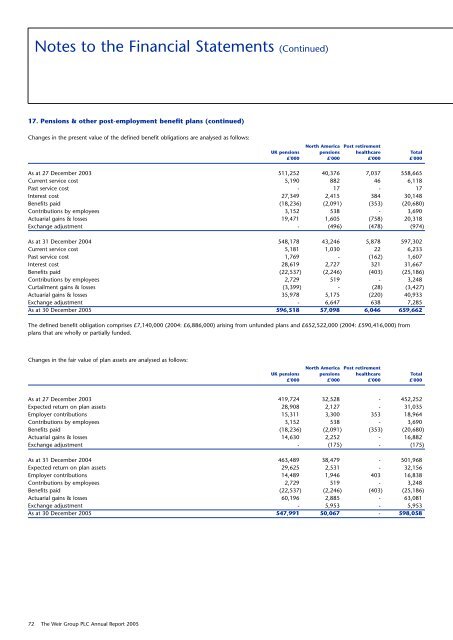
Notes to the Financial Statements (Continued)<br />
17. Pensions & other post-employment benefit plans (continued)<br />
Changes in the present value of the defined benefit obligations are analysed as follows:<br />
North America Post retirement<br />
UK pensions pensions healthcare Total<br />
£'000 £'000 £'000 £'000<br />
As at 27 December 2003 511,252 40,376 7,037 558,665<br />
Current service cost 5,190 882 46 6,118<br />
Past service cost - 17 - 17<br />
Interest cost 27,349 2,415 384 30,148<br />
Benefits paid (18,236) (2,091) (353) (20,680)<br />
Contributions by employees 3,152 538 - 3,690<br />
Actuarial gains & losses 19,471 1,605 (758) 20,318<br />
Exchange adjustment - (496) (478) (974)<br />
As at 31 December 2004 548,178 43,246 5,878 597,302<br />
Current service cost 5,181 1,030 22 6,233<br />
Past service cost 1,769 - (162) 1,607<br />
Interest cost 28,619 2,727 321 31,667<br />
Benefits paid (22,537) (2,246) (403) (25,186)<br />
Contributions by employees 2,729 519 - 3,248<br />
Curtailment gains & losses (3,399) - (28) (3,427)<br />
Actuarial gains & losses 35,978 5,175 (220) 40,933<br />
Exchange adjustment - 6,647 638 7,285<br />
As at 30 December <strong>2005</strong> 596,518 57,098 6,046 659,662<br />
<strong>The</strong> defined benefit obligation comprises £7,140,000 (2004: £6,886,000) arising from unfunded plans and £652,522,000 (2004: £590,416,000) from<br />
plans that are wholly or partially funded.<br />
Changes in the fair value of plan assets are analysed as follows:<br />
North America Post retirement<br />
UK pensions pensions healthcare Total<br />
£'000 £'000 £'000 £'000<br />
As at 27 December 2003 419,724 32,528 - 452,252<br />
Expected return on plan assets 28,908 2,127 - 31,035<br />
Employer contributions 15,311 3,300 353 18,964<br />
Contributions by employees 3,152 538 - 3,690<br />
Benefits paid (18,236) (2,091) (353) (20,680)<br />
Actuarial gains & losses 14,630 2,252 - 16,882<br />
Exchange adjustment - (175) - (175)<br />
As at 31 December 2004 463,489 38,479 - 501,968<br />
Expected return on plan assets 29,625 2,531 - 32,156<br />
Employer contributions 14,489 1,946 403 16,838<br />
Contributions by employees 2,729 519 - 3,248<br />
Benefits paid (22,537) (2,246) (403) (25,186)<br />
Actuarial gains & losses 60,196 2,885 - 63,081<br />
Exchange adjustment - 5,953 - 5,953<br />
As at 30 December <strong>2005</strong> 547,991 50,067 - 598,058<br />
72 <strong>The</strong> <strong>Weir</strong> <strong>Group</strong> PLC Annual Report <strong>2005</strong>