Stability Analysis of an All-Electric Ship MVDC Power Distribution ...
Stability Analysis of an All-Electric Ship MVDC Power Distribution ...
Stability Analysis of an All-Electric Ship MVDC Power Distribution ...

Create successful ePaper yourself
Turn your PDF publications into a flip-book with our unique Google optimized e-Paper software.
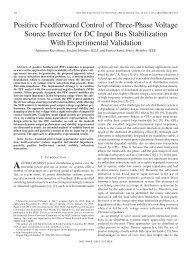
Figure 7: Cascade <strong>of</strong> a PICM-FB controlled buck converter <strong>an</strong>d a PICM-FFFB-controlled VSI. Another buck converter is used to perturb the bus <strong>an</strong>d<br />
extract bus imped<strong>an</strong>ce. A high b<strong>an</strong>dwidth CPL added to the bus has the effect <strong>of</strong> destabilizing the bus.<br />
Viewed from the bus port, the entire system c<strong>an</strong> be lumped<br />
into a 1-port network, as previously described in Section II.<br />
The digital network <strong>an</strong>alyzer technique [23] is the tool used to<br />
measure the bus imped<strong>an</strong>ce <strong>an</strong>d address system level stability<br />
issues in a <strong>MVDC</strong> power distribution system. This technique<br />
uses a switching converter as a perturbation source, <strong>an</strong>d its<br />
controller as a signal <strong>an</strong>alyzer to measure small-signal tr<strong>an</strong>sfer<br />
functions <strong>an</strong>d imped<strong>an</strong>ces <strong>of</strong> interest. Referring to Fig. 9, a<br />
pseudo-r<strong>an</strong>dom binary sequence (PRBS) test signal is added to<br />
the duty cycle signal from the feedback controller. Applying<br />
the cross-correlation technique to the appropriate measured<br />
qu<strong>an</strong>tities allows online monitoring <strong>of</strong> the bus imped<strong>an</strong>ce<br />
Z bus (s)=V bus (s)/I inj (s).<br />
A. Cascade <strong>of</strong> Buck Converter <strong>an</strong>d VSI<br />
For this case, the system with only FB control is<br />
marginally stable, while the same system with FFFB control is<br />
highly stabilized. Fig. 10 shows the Bode plot <strong>of</strong> the bus<br />
imped<strong>an</strong>ce, which is the parallel combination <strong>of</strong> the output<br />
Figure 8: Control <strong>of</strong> the VSI. PICM-FB loop in the middle <strong>an</strong>d FF loop at the top.<br />
Figure 9: Conceptual block diagram showing injection <strong>of</strong> a test<br />
signal for system bus imped<strong>an</strong>ce measurements.<br />
imped<strong>an</strong>ce <strong>of</strong> the buck converter <strong>an</strong>d the input imped<strong>an</strong>ce <strong>of</strong><br />
the VSI (Eq. (20). The <strong>an</strong>alytical tr<strong>an</strong>sfer functions, given in<br />
(20), are compared with the nonparametric results given by the<br />
digital network <strong>an</strong>alyzer in simulation.<br />
Z<br />
⎛ 1 1 ⎞<br />
_<br />
= ⎜<br />
+ ⎟<br />
(20)<br />
bus CL<br />
⎝ Zout<br />
_ CL(<br />
Buck )<br />
Zin<br />
_ CL(<br />
VSI ) ⎠<br />
where CL denotes either FB or FFFB.<br />
−1<br />
416