MBE WBE Report Q2 2013 - Chicago Park District
MBE WBE Report Q2 2013 - Chicago Park District
MBE WBE Report Q2 2013 - Chicago Park District

Create successful ePaper yourself
Turn your PDF publications into a flip-book with our unique Google optimized e-Paper software.
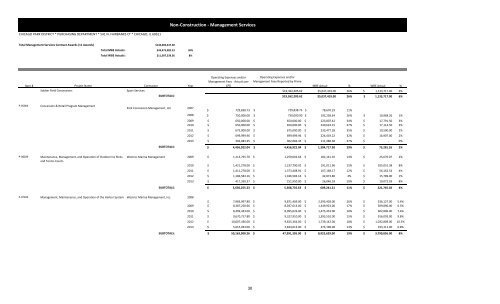
Non-Construction - Management Services<br />
CHICAGO PARK DISTRICT * PURCHASING DEPARTMENT * 541 N. FAIRBANKS CT * CHICAGO, IL 60611<br />
Total Management Services Contract Awards (11 Awards)<br />
$146,003,447.38<br />
Total <strong>MBE</strong> Actuals: $43,473,982.23 30%<br />
Total <strong>WBE</strong> Actuals: $11,097,539.36 8%<br />
Spec # Project Name Contractor Year<br />
Operating Expenses and/or<br />
Management Fees - Actuals per<br />
CPD<br />
Operating Expenses and/or<br />
Management Fees <strong>Report</strong>ed by Prime<br />
<strong>MBE</strong> Actual % <strong>WBE</strong> Actual %<br />
Soldier Field Concessions Sport Services $19,362,205.62 $5,037,419.00 26% $ 1,133,717.00 6%<br />
SUBTOTALS: $19,362,205.62 $5,037,419.00 26% $ 1,133,717.00 6%<br />
P-05004 Concession & Retail Program Management<br />
P-08029 Maintenance, Management, and Operation of Outdoor Ice Rinks<br />
and Tennis Courts<br />
<strong>Park</strong> Concession Management, LLC 2007<br />
$ 729,838.73 $ 729,838.73 $ 78,670.29 11%<br />
2008 $ 750,000.00 $ 750,000.00 $ 192,238.64 26% $ 10,968.26 1%<br />
2009 $ 650,000.00 $ 650,000.00 $ 223,807.42 34% $ 17,791.50 3%<br />
2010 $ 650,000.00 $ 650,000.00 $ 240,624.15 37% $ 17,114.50 3%<br />
2011 $ 675,000.00 $ 675,000.00 $ 233,477.28 35% $ 10,500.00 2%<br />
2012 $ 699,999.96 $ 699,999.96 $ 224,419.22 32% $ 16,907.00 2%<br />
<strong>2013</strong> $ 302,083.35 $ 302,083.35 $ 111,480.38 37% $ - 0%<br />
SUBTOTALS: $ 4,456,922.04 $ 4,456,922.04 $ 1,304,717.38 29% $ 73,281.26 2%<br />
Westrec Marina Management 2009 $ 1,213,765.70 $ 1,259,002.64 $ 182,141.10 14% $ 25,670.07 2%<br />
2010 $ 1,421,278.00 $ 1,237,790.92 $ 191,011.96 15% $ 105,051.38 8%<br />
2011 $ 1,411,278.00 $ 1,373,408.91 $ 167,168.17 12% $ 56,162.54 4%<br />
2012 $ 1,186,583.16 $ 1,186,583.16 $ 42,873.80 4% $ 15,789.00 1%<br />
<strong>2013</strong> $ 417,350.37 $ 251,950.00 $ 26,046.18 10% $ 19,072.03 8%<br />
SUBTOTALS: $ 5,650,255.23 $ 5,308,735.63 $ 609,241.21 11% $ 221,745.02 4%<br />
P-07020 Management, Maintenance, and Operation of the Harbor System Westrec Marina Management, Inc. 2008<br />
$ 7,983,997.80 $ 9,871,469.00 $ 2,593,403.00 26% $ 536,127.00 5.4%<br />
2009 $ 8,387,250.66 $ 8,037,613.00 $ 1,349,923.00 17% $ 509,890.00 6.3%<br />
2010 $ 8,499,433.00 $ 8,095,026.00 $ 1,475,453.00 18% $ 602,806.00 7.4%<br />
2011 $ 9,670,757.80 $ 9,327,910.00 $ 1,393,510.00 15% $ 916,093.00 9.8%<br />
2012 $ 10,007,436.00 $ 9,825,364.00 $ 1,739,142.00 18% $ 1,032,809.00 10.5%<br />
<strong>2013</strong> $ 5,615,033.00 $ 2,834,013.00 $ 374,198.00 13% $ 193,111.00 6.8%<br />
SUBTOTALS: $ 50,163,908.26 $ 47,991,395.00 $ 8,925,629.00 19% $ 3,790,836.00 8%<br />
30