Indore City Resilience Strategy - ImagineIndore.org
Indore City Resilience Strategy - ImagineIndore.org
Indore City Resilience Strategy - ImagineIndore.org

Create successful ePaper yourself
Turn your PDF publications into a flip-book with our unique Google optimized e-Paper software.
A. Variability & Change B. Possible Impacts C. Evaluation & Assessment D. Prioritized Strategies<br />
Energy<br />
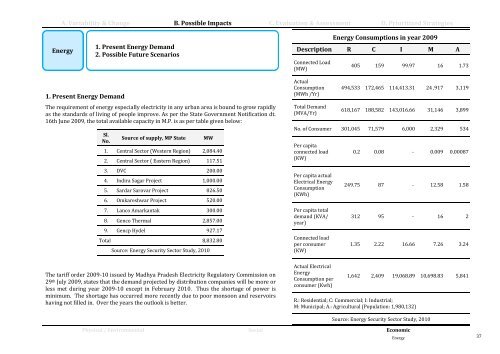
1. Present Energy Demand<br />
2. Possible Future Scenarios<br />
Energy Consumptions in year 2009<br />
Description R C I M A<br />
Connected Load<br />
(MW)<br />
405 159 99.97 16 1.73<br />
1. Present Energy Demand<br />
The requirement of energy especially electricity in any urban area is bound to grow rapidly<br />
as the standards of living of people improve. As per the State Government Notification dt.<br />
16th June 2009, the total available capacity in M.P. is as per table given below:<br />
Sl.<br />
No.<br />
Source of supply, MP State<br />
The tariff order 2009-10 issued by Madhya Pradesh Electricity Regulatory Commission on<br />
29 th July 2009, states that the demand projected by distribution companies will be more or<br />
less met during year 2009-10 except in February 2010. Thus the shortage of power is<br />
minimum. The shortage has occurred more recently due to poor monsoon and reservoirs<br />
having not filled in. Over the years the outlook is better.<br />
MW<br />
1. Central Sector (Western Region) 2,084.40<br />
2. Central Sector ( Eastern Region) 117.51<br />
3. DVC 200.00<br />
4. Indira Sagar Project 1,000.00<br />
5. Sardar Sarovar Project 826.50<br />
6. Omkareshwar Project 520.00<br />
7. Lanco Amarkantak 300.00<br />
8. Genco Thermal 2,857.00<br />
9. Gencp Hydel 927.17<br />
Total 8,832.80<br />
Source: Energy Security Sector Study, 2010<br />
Actual<br />
Consumption<br />
(MWh /Yr)<br />
Total Demand<br />
(MVA/Yr)<br />
494,533 172,465 114,413.31 24 ,917 3,119<br />
618,167 188,582 143,016.66 31,146 3,899<br />
No. of Consumer 301,045 71,579 6,000 2,329 534<br />
Per capita<br />
connected load<br />
(KW)<br />
Per capita actual<br />
Electrical Energy<br />
Consumption<br />
(KWh)<br />
Per capita total<br />
demand (KVA/<br />
year)<br />
Connected load<br />
per consumer<br />
(KW)<br />
Actual Electrical<br />
Energy<br />
Consumption per<br />
consumer (Kwh)<br />
0.2 0.08 - 0.009 0.00087<br />
249.75 87 - 12.58 1.58<br />
312 95 - 16 2<br />
1.35 2.22 16.66 7.26 3.24<br />
1,642 2,409 19,068.89 10,698.83 5,841<br />
R.: Residential; C: Commercial; I: Industrial;<br />
M: Municipal; A.: Agricultural (Population: 1,980,132)<br />
Source: Energy Security Sector Study, 2010<br />
Physical / Environmental Social Economic<br />
Energy<br />
37