Download (1.19 MB) - Australian Council on Healthcare Standards
Download (1.19 MB) - Australian Council on Healthcare Standards
Download (1.19 MB) - Australian Council on Healthcare Standards

You also want an ePaper? Increase the reach of your titles
YUMPU automatically turns print PDFs into web optimized ePapers that Google loves.
Medi Medicati<strong>on</strong> Safety, v3<br />
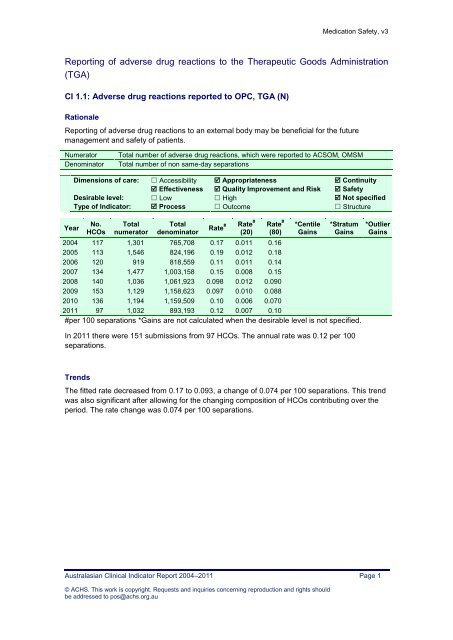
Reporting of adverse drug reacti<strong>on</strong>s to the Therapeutic Goods Administrati<strong>on</strong><br />
(TGA)<br />
CI 1.1: Adverse drug reacti<strong>on</strong>s reported to OPC, TGA (N)<br />
Rati<strong>on</strong>ale<br />
Reporting of adverse drug reacti<strong>on</strong>s to an external body may be beneficial for the future<br />
management and safety of patients.<br />
Numerator<br />
Denominator<br />
Total number of adverse drug reacti<strong>on</strong>s, which were reported to ACSOM, OMSM<br />
Total number of n<strong>on</strong> same-day separati<strong>on</strong>s<br />
Year<br />
Dimensi<strong>on</strong>s of care: Accessibility Appropriateness C<strong>on</strong>tinuity<br />
Effectiveness Quality Improvement and Risk Safety<br />
Desirable level: Low High Not specified<br />
Type of Indicator: Process Outcome Structure<br />
No.<br />
HCOs<br />
Total<br />
numerator<br />
Total<br />
denominator<br />
Rate #<br />
Rate#<br />
(20)<br />
Rate #<br />
(80)<br />
*Centile<br />
Gains<br />
*Stratum<br />
Gains<br />
2004 117 1,301 765,708 0.17 0.011 0.16<br />
2005 113 1,546 824,196 0.19 0.012 0.18<br />
2006 120 919 818,559 0.11 0.011 0.14<br />
2007 134 1,477 1,003,158 0.15 0.008 0.15<br />
2008 140 1,036 1,061,923 0.098 0.012 0.090<br />
2009 153 1,129 1,158,623 0.097 0.010 0.088<br />
2010 136 1,194 1,159,509 0.10 0.006 0.070<br />
2011 97 1,032 893,193 0.12 0.007 0.10<br />
#per 100 separati<strong>on</strong>s *Gains are not calculated when the desirable level is not specified.<br />
In 2011 there were 151 submissi<strong>on</strong>s from 97 HCOs. The annual rate was 0.12 per 100<br />
separati<strong>on</strong>s.<br />
*Outlier<br />
Gains<br />
Trends<br />
The fitted rate decreased from 0.17 to 0.093, a change of 0.074 per 100 separati<strong>on</strong>s. This trend<br />
was also significant after allowing for the changing compositi<strong>on</strong> of HCOs c<strong>on</strong>tributing over the<br />
period. The rate change was 0.074 per 100 separati<strong>on</strong>s.<br />
Australasian Clinical Indicator Report 2004–2011 Page 1<br />
© ACHS. This work is copyright. Requests and inquiries c<strong>on</strong>cerning reproducti<strong>on</strong> and rights should<br />
be addressed to pos@achs.org.au