Download (1.19 MB) - Australian Council on Healthcare Standards
Download (1.19 MB) - Australian Council on Healthcare Standards
Download (1.19 MB) - Australian Council on Healthcare Standards

You also want an ePaper? Increase the reach of your titles
YUMPU automatically turns print PDFs into web optimized ePapers that Google loves.
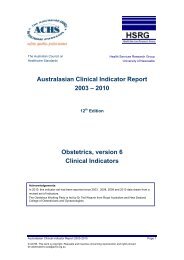
Medicati<strong>on</strong> Safety, v3<br />
Medicati<strong>on</strong> errors resulting in an adverse event<br />
CI 2.1: Medicati<strong>on</strong> errors – adverse event requiring interventi<strong>on</strong> (L)<br />
Rati<strong>on</strong>ale<br />
The use of medicati<strong>on</strong> remains the most comm<strong>on</strong> interventi<strong>on</strong> in health care. Medicine misuse,<br />
underuse or over use and adverse reacti<strong>on</strong>s annually result in an estimated 140,000 annual<br />
hospital admissi<strong>on</strong>s in Australia; most of these adverse drug events are preventable.<br />
Numerator<br />
Denominator<br />
Total number of medicati<strong>on</strong> errors resulting in an adverse event requiring interventi<strong>on</strong><br />
bey<strong>on</strong>d routine observati<strong>on</strong> and m<strong>on</strong>itoring<br />
Total number of occupied bed days<br />
Year<br />
Dimensi<strong>on</strong>s of care: Accessibility Appropriateness C<strong>on</strong>tinuity<br />
Effectiveness Quality Improvement and Risk Safety<br />
Desirable level: Low High Not specified<br />
Type of Indicator: Process Outcome Structure<br />
No.<br />
HCOs<br />
Total<br />
numerator<br />
Total<br />
denominator<br />
Rate #<br />
Rate#<br />
(20)<br />
Rate #<br />
(80)<br />
Centile<br />
Gains<br />
Stratum<br />
Gains<br />
Outlier<br />
Gains<br />
2005 144 400 3,867,458 0.010 0.002 0.014 314 161<br />
2006 203 1,394 6,392,952 0.022 0.002 0.016 1,239 497 758<br />
2007 259 6,580 8,263,636 0.080 0.003 0.087 6,364 3,642 3,781<br />
2008 267 5,185 9,484,850 0.055 0.002 0.039 4,955 3,246<br />
2009 259 3,949 9,339,048 0.042 0.002 0.021 3,771 2,562<br />
2010 262 2,211 9,425,487 0.023 0.001 0.015 2,082 1,328<br />
2011 247 892 7,132,050 0.013 0.003 0.014 712 331<br />
#per 100 bed days<br />
In 2011 there were 420 submissi<strong>on</strong>s from 247 HCOs. The annual rate was 0.013 per 100 bed<br />
days.<br />
Trends<br />
The fitted rate improved from 0.051 to 0.030, a change of 0.021 per 100 bed days. This trend<br />
was also significant after allowing for the changing compositi<strong>on</strong> of HCOs c<strong>on</strong>tributing over the<br />
period. The rate change was 0.020 per 100 bed days.<br />
Rates and centiles by year<br />
A Low rate is desirable<br />
80 th centile rate<br />
x<br />
Aggregate rate<br />
Period average rate<br />
Fitted rate<br />
20 th centile rate<br />
Australasian Clinical Indicator Report 2004–2011 Page 3<br />
© ACHS. This work is copyright. Requests and inquiries c<strong>on</strong>cerning reproducti<strong>on</strong> and rights should<br />
be addressed to pos@achs.org.au