Download (1.19 MB) - Australian Council on Healthcare Standards
Download (1.19 MB) - Australian Council on Healthcare Standards
Download (1.19 MB) - Australian Council on Healthcare Standards

You also want an ePaper? Increase the reach of your titles
YUMPU automatically turns print PDFs into web optimized ePapers that Google loves.
Medicati<strong>on</strong> Safety versi<strong>on</strong> 3<br />
Retrospective data in full<br />
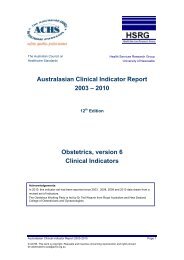
Australasian Clinical Indicator Report 2004–2011
About this report<br />
These full data reports of the Australasian Clinical Indicator Report list collective performance<br />
against each of the ACHS clinical indicators that were collected during 2011.<br />
In this report, each of the indicators from the Medicati<strong>on</strong> Safety CI set has a table (shaded green)<br />
that describes the indicator, its intent, numerator and denominator. Tables summarise the data<br />
submitted in every year since 2004 that the indicator has been available.<br />
For indicators of interest, this report will assist in better understanding the true granularity of the<br />
data.<br />
For indicators launched before 2009, trends in the rates over time are reported and the data are<br />
displayed using a line graph. More than three years of data are needed to display a trend.<br />
Outlier informati<strong>on</strong> is displayed using funnel plots.<br />
Three measures of variati<strong>on</strong> in rates between healthcare organisati<strong>on</strong>s (HCOs) are included; these<br />
are quantified by the differences between the 20 th and 80 th centiles.<br />
These green tables also include statistical estimates of the potential gains for all eligible indicators,<br />
if changes in the distributi<strong>on</strong> of data were achieved.<br />
Centile gains show the number of units (for many CIs, patients) that would benefit if the<br />
overall level of performance achieved by all organisati<strong>on</strong>s combined was the same as that of<br />
the better performing 20% of organisati<strong>on</strong>s (as defined by the 20th or 80th centile rate).<br />
Stratum gains show the number of units (for many CIs, patients) that would benefit if the<br />
performance of organisati<strong>on</strong>s outside the better performing stratum was lifted to that level.<br />
Strata can <strong>on</strong>ly be c<strong>on</strong>sidered for these comparis<strong>on</strong>s when there is sufficient data (at least<br />
five organisati<strong>on</strong>s c<strong>on</strong>tributing to each stratum). Stratum differences may represent the<br />
c<strong>on</strong>trast between either metropolitan or n<strong>on</strong>-metropolitan organisati<strong>on</strong>s, between any single<br />
state / territory and the others, or between organisati<strong>on</strong>s bel<strong>on</strong>ging to the public and private<br />
sectors. Where the differences between strata are statistically significant, further informati<strong>on</strong><br />
is provided within the report, and can be identified by the presence of a table shaded mauve<br />
(public / private), pink (metro / n<strong>on</strong>-metro) or apricot (states / territories / NZ). Multiple tables<br />
are displayed when more than <strong>on</strong>e stratum is statistically significant. Only the largest stratum<br />
gain is recorded in the opening green table.<br />
Outlier gains show the number of units (for many CIs, patients) that would benefit if those<br />
organisati<strong>on</strong>s with results that are more than three standard deviati<strong>on</strong>s poorer than average<br />
could achieve the average level of performance.<br />
Medi Medicati<strong>on</strong> Safety, v3<br />
Acknowledgements:<br />
In 2011, there were changes to this indicator set.<br />
The positi<strong>on</strong> of Chairpers<strong>on</strong> for the Medicati<strong>on</strong> Safety Working Party is currently vacant. The working<br />
party includes representati<strong>on</strong> from the:<br />
<br />
<br />
Therapeutic Goods Administrati<strong>on</strong><br />
NSW Therapeutic Advisory Group<br />
The <str<strong>on</strong>g>Australian</str<strong>on</strong>g> <str<strong>on</strong>g>Council</str<strong>on</strong>g> <strong>on</strong> <strong>Healthcare</strong> <strong>Standards</strong><br />
Health Services Research Group, University of Newcastle<br />
Published by ACHS, October 2012.<br />
Teleph<strong>on</strong>e: +61 2 9281 9955<br />
© The <str<strong>on</strong>g>Australian</str<strong>on</strong>g> <str<strong>on</strong>g>Council</str<strong>on</strong>g> <strong>on</strong> <strong>Healthcare</strong> <strong>Standards</strong><br />
This work is copyright. Apart from any use as permitted under the Copyright Act 1968,<br />
no part may be reproduced by any process without prior written permissi<strong>on</strong> from the<br />
<str<strong>on</strong>g>Australian</str<strong>on</strong>g> <str<strong>on</strong>g>Council</str<strong>on</strong>g> <strong>on</strong> <strong>Healthcare</strong> <strong>Standards</strong>.<br />
Recommended citati<strong>on</strong><br />
<str<strong>on</strong>g>Australian</str<strong>on</strong>g> <str<strong>on</strong>g>Council</str<strong>on</strong>g> <strong>on</strong> <strong>Healthcare</strong> <strong>Standards</strong> (ACHS). Medicati<strong>on</strong> Safety versi<strong>on</strong> 3.<br />
Retrospective data in full. Australasian Clinical Indicator Report 2004–2011. Sydney NSW; ACHS; 2012.
Medi Medicati<strong>on</strong> Safety, v3<br />
C<strong>on</strong>tents<br />
Reporting of adverse drug reacti<strong>on</strong>s to the Therapeutic Goods Administrati<strong>on</strong> (TGA)1<br />
CI 1.1: Adverse drug reacti<strong>on</strong>s reported to OPC, TGA (N) 1<br />
Medicati<strong>on</strong> errors resulting in an adverse event .............................................................. 3<br />
CI 2.1: Medicati<strong>on</strong> errors – adverse event requiring interventi<strong>on</strong> (L) 3<br />
Documentati<strong>on</strong> of a patient’s known adverse drug reacti<strong>on</strong>s (ADRs)........................... 5<br />
CI 3.1: Known ADRs documented in current medicati<strong>on</strong> chart (H) 5<br />
Error-pr<strong>on</strong>e abbreviati<strong>on</strong>s .................................................................................................. 7<br />
CI 4.1: Medicati<strong>on</strong> orders with error-pr<strong>on</strong>e abbreviati<strong>on</strong>s (L) 7<br />
Warfarin management ......................................................................................................... 9<br />
CI 5.1: Warfarin – abnormal bleeding (L) 9<br />
CI 5.2: Warfarin – INR / prothrombin reading >5 (L) 12<br />
CI 5.3: Warfarin – written drug informati<strong>on</strong> up<strong>on</strong> discharge (H) 15<br />
CI 5.4: Warfarin – dosage review following high INR result (H) 17<br />
CI 5.5: Warfarin – starting doses c<strong>on</strong>sistent with hospital approved protocol (H) 18<br />
Timely and appropriate m<strong>on</strong>itoring of aminoglycoside antibiotics ............................. 19<br />
CI 6.1: Aminoglycoside toxicity – dosage adjustment prior to next dose (H) 19<br />
Clinical Significance of these results .............................................................................. 20<br />
Therapeutic Goods Administrati<strong>on</strong> (TGA) 22<br />
Australasian Clinical Indicator Report 2004–2011<br />
© ACHS. This work is copyright. Requests and inquiries c<strong>on</strong>cerning reproducti<strong>on</strong> and rights should<br />
be addressed to pos@achs.org.au
Medi Medicati<strong>on</strong> Safety, v3<br />
Reporting of adverse drug reacti<strong>on</strong>s to the Therapeutic Goods Administrati<strong>on</strong><br />
(TGA)<br />
CI 1.1: Adverse drug reacti<strong>on</strong>s reported to OPC, TGA (N)<br />
Rati<strong>on</strong>ale<br />
Reporting of adverse drug reacti<strong>on</strong>s to an external body may be beneficial for the future<br />
management and safety of patients.<br />
Numerator<br />
Denominator<br />
Total number of adverse drug reacti<strong>on</strong>s, which were reported to ACSOM, OMSM<br />
Total number of n<strong>on</strong> same-day separati<strong>on</strong>s<br />
Year<br />
Dimensi<strong>on</strong>s of care: Accessibility Appropriateness C<strong>on</strong>tinuity<br />
Effectiveness Quality Improvement and Risk Safety<br />
Desirable level: Low High Not specified<br />
Type of Indicator: Process Outcome Structure<br />
No.<br />
HCOs<br />
Total<br />
numerator<br />
Total<br />
denominator<br />
Rate #<br />
Rate#<br />
(20)<br />
Rate #<br />
(80)<br />
*Centile<br />
Gains<br />
*Stratum<br />
Gains<br />
2004 117 1,301 765,708 0.17 0.011 0.16<br />
2005 113 1,546 824,196 0.19 0.012 0.18<br />
2006 120 919 818,559 0.11 0.011 0.14<br />
2007 134 1,477 1,003,158 0.15 0.008 0.15<br />
2008 140 1,036 1,061,923 0.098 0.012 0.090<br />
2009 153 1,129 1,158,623 0.097 0.010 0.088<br />
2010 136 1,194 1,159,509 0.10 0.006 0.070<br />
2011 97 1,032 893,193 0.12 0.007 0.10<br />
#per 100 separati<strong>on</strong>s *Gains are not calculated when the desirable level is not specified.<br />
In 2011 there were 151 submissi<strong>on</strong>s from 97 HCOs. The annual rate was 0.12 per 100<br />
separati<strong>on</strong>s.<br />
*Outlier<br />
Gains<br />
Trends<br />
The fitted rate decreased from 0.17 to 0.093, a change of 0.074 per 100 separati<strong>on</strong>s. This trend<br />
was also significant after allowing for the changing compositi<strong>on</strong> of HCOs c<strong>on</strong>tributing over the<br />
period. The rate change was 0.074 per 100 separati<strong>on</strong>s.<br />
Australasian Clinical Indicator Report 2004–2011 Page 1<br />
© ACHS. This work is copyright. Requests and inquiries c<strong>on</strong>cerning reproducti<strong>on</strong> and rights should<br />
be addressed to pos@achs.org.au
Medicati<strong>on</strong> Safety, v3<br />
Rates and centiles by year<br />
Desirable rate unspecified<br />
80 th centile rate<br />
x<br />
Aggregate rate<br />
Period average rate<br />
Fitted rate<br />
20 th centile rate<br />
Variati<strong>on</strong> between strata<br />
There were no significant stratum differences in 2010 and 2011.<br />
Variati<strong>on</strong> between HCOs<br />
Outliers<br />
Since it has not been specified whether high or low rates are desirable, outlier HCOs are not<br />
reported.<br />
Australasian Clinical Indicator Report 2004–2011 Page 2<br />
© ACHS. This work is copyright. Requests and inquiries c<strong>on</strong>cerning reproducti<strong>on</strong> and rights should<br />
be addressed to pos@achs.org.au
Medicati<strong>on</strong> Safety, v3<br />
Medicati<strong>on</strong> errors resulting in an adverse event<br />
CI 2.1: Medicati<strong>on</strong> errors – adverse event requiring interventi<strong>on</strong> (L)<br />
Rati<strong>on</strong>ale<br />
The use of medicati<strong>on</strong> remains the most comm<strong>on</strong> interventi<strong>on</strong> in health care. Medicine misuse,<br />
underuse or over use and adverse reacti<strong>on</strong>s annually result in an estimated 140,000 annual<br />
hospital admissi<strong>on</strong>s in Australia; most of these adverse drug events are preventable.<br />
Numerator<br />
Denominator<br />
Total number of medicati<strong>on</strong> errors resulting in an adverse event requiring interventi<strong>on</strong><br />
bey<strong>on</strong>d routine observati<strong>on</strong> and m<strong>on</strong>itoring<br />
Total number of occupied bed days<br />
Year<br />
Dimensi<strong>on</strong>s of care: Accessibility Appropriateness C<strong>on</strong>tinuity<br />
Effectiveness Quality Improvement and Risk Safety<br />
Desirable level: Low High Not specified<br />
Type of Indicator: Process Outcome Structure<br />
No.<br />
HCOs<br />
Total<br />
numerator<br />
Total<br />
denominator<br />
Rate #<br />
Rate#<br />
(20)<br />
Rate #<br />
(80)<br />
Centile<br />
Gains<br />
Stratum<br />
Gains<br />
Outlier<br />
Gains<br />
2005 144 400 3,867,458 0.010 0.002 0.014 314 161<br />
2006 203 1,394 6,392,952 0.022 0.002 0.016 1,239 497 758<br />
2007 259 6,580 8,263,636 0.080 0.003 0.087 6,364 3,642 3,781<br />
2008 267 5,185 9,484,850 0.055 0.002 0.039 4,955 3,246<br />
2009 259 3,949 9,339,048 0.042 0.002 0.021 3,771 2,562<br />
2010 262 2,211 9,425,487 0.023 0.001 0.015 2,082 1,328<br />
2011 247 892 7,132,050 0.013 0.003 0.014 712 331<br />
#per 100 bed days<br />
In 2011 there were 420 submissi<strong>on</strong>s from 247 HCOs. The annual rate was 0.013 per 100 bed<br />
days.<br />
Trends<br />
The fitted rate improved from 0.051 to 0.030, a change of 0.021 per 100 bed days. This trend<br />
was also significant after allowing for the changing compositi<strong>on</strong> of HCOs c<strong>on</strong>tributing over the<br />
period. The rate change was 0.020 per 100 bed days.<br />
Rates and centiles by year<br />
A Low rate is desirable<br />
80 th centile rate<br />
x<br />
Aggregate rate<br />
Period average rate<br />
Fitted rate<br />
20 th centile rate<br />
Australasian Clinical Indicator Report 2004–2011 Page 3<br />
© ACHS. This work is copyright. Requests and inquiries c<strong>on</strong>cerning reproducti<strong>on</strong> and rights should<br />
be addressed to pos@achs.org.au
Medicati<strong>on</strong> Safety, v3<br />
Variati<strong>on</strong> between strata<br />
There were no significant stratum differences in 2010 and 2011.<br />
Variati<strong>on</strong> between HCOs<br />
In 2011 the potential gains totalled 712 fewer medicati<strong>on</strong> errors resulting in an adverse event<br />
requiring interventi<strong>on</strong>, corresp<strong>on</strong>ding to a reducti<strong>on</strong> by approximately three quarters.<br />
Outliers<br />
In 2011 there were 21 outlier submissi<strong>on</strong>s from 17 HCOs whose combined excess was 330<br />
more medicati<strong>on</strong> errors resulting in an adverse event requiring interventi<strong>on</strong>. The outlier HCO<br />
rate was 0.047 per 100 bed days.<br />
Australasian Clinical Indicator Report 2004–2011 Page 4<br />
© ACHS. This work is copyright. Requests and inquiries c<strong>on</strong>cerning reproducti<strong>on</strong> and rights should<br />
be addressed to pos@achs.org.au
Medicati<strong>on</strong> Safety, v3<br />
Documentati<strong>on</strong> of a patient’s known adverse drug reacti<strong>on</strong>s (ADRs)<br />
CI 3.1: Known ADRs documented in current medicati<strong>on</strong> chart (H)<br />
Rati<strong>on</strong>ale<br />
The purpose of ADR documentati<strong>on</strong> is to avoid further harm to patients who have previously<br />
experienced an ADR to that (or similar) medicati<strong>on</strong>. Data from NSW audits of the Nati<strong>on</strong>al<br />
Inpatient Medicati<strong>on</strong> Chart (NIMC) show that completi<strong>on</strong> of ADR documentati<strong>on</strong> occurs 49-85%<br />
of the time. Incidents involving medicati<strong>on</strong> administrati<strong>on</strong> to patients with a known ADR to that<br />
medicati<strong>on</strong> c<strong>on</strong>tinue to occur. Preventi<strong>on</strong> of such errors depends <strong>on</strong> current and complete<br />
informati<strong>on</strong> being available at the time of prescribing, dispensing and administrati<strong>on</strong>.<br />
Numerator<br />
Denominator<br />
Total number of patients whose known ADRs are documented <strong>on</strong> the current medicati<strong>on</strong><br />
chart<br />
Total number of patients in the sample<br />
Year<br />
Dimensi<strong>on</strong>s of care: Accessibility Appropriateness C<strong>on</strong>tinuity<br />
Effectiveness Quality Improvement and Risk Safety<br />
Desirable level: Low High Not specified<br />
Type of Indicator: Process Outcome Structure<br />
No.<br />
HCOs<br />
Total<br />
numerator<br />
Total<br />
denominator<br />
Rate #<br />
Rate#<br />
(20)<br />
Rate #<br />
(80)<br />
Centile<br />
Gains<br />
Stratum<br />
Gains<br />
Outlier<br />
Gains<br />
2009 49 6,877 9,526 72.2 63.5 95.4 2,208 2,033 1,425<br />
2010 43 7,210 8,191 88.0 74.3 97.3 756 356 415<br />
2011 57 14,572 15,674 93.0 83.7 99.0 950 612 570<br />
#per 100 patients<br />
In 2011 there were 91 submissi<strong>on</strong>s from 57 HCOs. The annual rate was 93.0 per 100 patients.<br />
Variati<strong>on</strong> between strata<br />
Rates by Public / Private<br />
Year<br />
Stratum<br />
No.<br />
HCOs<br />
Total<br />
numerator<br />
Total<br />
denominator<br />
Stratum<br />
rate #<br />
Standard<br />
error<br />
Stratum<br />
gains<br />
2011 Private 33 10,688 11,023 96.9 1.10<br />
Public 24 3,884 4,651 83.7 1.70 612<br />
#per 100 patients<br />
Australasian Clinical Indicator Report 2004–2011 Page 5<br />
© ACHS. This work is copyright. Requests and inquiries c<strong>on</strong>cerning reproducti<strong>on</strong> and rights should<br />
be addressed to pos@achs.org.au
Medicati<strong>on</strong> Safety, v3<br />
Rates by State<br />
Year<br />
Stratum<br />
No.<br />
HCOs<br />
Total<br />
numerator<br />
Total<br />
denominator<br />
Stratum<br />
rate #<br />
Standard<br />
error<br />
Stratum<br />
gains<br />
2011 NSW 24 7,979 8,299 96.1 1.39<br />
Qld 8 2,393 2,480 96.3 2.54<br />
SA 7 904 1,113 81.7 3.78 160<br />
Vic 13 2,650 3,009 88.1 2.30 242<br />
Other 5 646 773 83.8 4.54 95<br />
#per 100 patients<br />
Variati<strong>on</strong> between HCOs<br />
In 2011 the potential gains totalled 950 more patients whose known ADRs are documented <strong>on</strong><br />
the current medicati<strong>on</strong> chart.<br />
Outliers<br />
In 2011 there were 21 outlier submissi<strong>on</strong>s from 17 HCOs whose combined excess was 569<br />
fewer patients whose known ADRs are documented <strong>on</strong> the current medicati<strong>on</strong> chart. The outlier<br />
HCO rate was 76.9 per 100 patients.<br />
Australasian Clinical Indicator Report 2004–2011 Page 6<br />
© ACHS. This work is copyright. Requests and inquiries c<strong>on</strong>cerning reproducti<strong>on</strong> and rights should<br />
be addressed to pos@achs.org.au
Medicati<strong>on</strong> Safety, v3<br />
Error-pr<strong>on</strong>e abbreviati<strong>on</strong>s<br />
CI 4.1: Medicati<strong>on</strong> orders with error-pr<strong>on</strong>e abbreviati<strong>on</strong>s (L)<br />
Rati<strong>on</strong>ale<br />
This indicator addresses the effectiveness of processes that encourage clear and unambiguous<br />
communicati<strong>on</strong> and medicati<strong>on</strong> orders. One of the major causes of medicati<strong>on</strong> errors is the use<br />
of potentially dangerous abbreviati<strong>on</strong>s in prescribing.<br />
Numerator<br />
Denominator<br />
Total number of medicati<strong>on</strong> orders that include error-pr<strong>on</strong>e abbreviati<strong>on</strong>s<br />
Total number of medicati<strong>on</strong> orders in the sample<br />
Year<br />
Dimensi<strong>on</strong>s of care: Accessibility Appropriateness C<strong>on</strong>tinuity<br />
Effectiveness Quality Improvement and Risk Safety<br />
Desirable level: Low High Not specified<br />
Type of Indicator: Process Outcome Structure<br />
No.<br />
HCOs<br />
Total<br />
numerator<br />
Total<br />
denominator<br />
Rate #<br />
Rate#<br />
(20)<br />
Rate #<br />
(80)<br />
Centile<br />
Gains<br />
Stratum<br />
Gains<br />
Outlier<br />
Gains<br />
2009 31 3,405 27,749 12.3 1.37 16.6 3,025 1,052<br />
2010 29 2,577 44,483 5.79 0.33 9.31 2,430 1,772 1,185<br />
2011 36 2,750 58,827 4.67 0.54 8.06 2,433 1,072<br />
#per 100 medicati<strong>on</strong> orders<br />
In 2011 there were 56 submissi<strong>on</strong>s from 36 HCOs. The annual rate was 4.7 per 100 medicati<strong>on</strong><br />
orders.<br />
Variati<strong>on</strong> between strata<br />
There were no significant stratum differences in 2010 and 2011.<br />
Variati<strong>on</strong> between HCOs<br />
In 2011 the potential gains totalled 2,433 fewer medicati<strong>on</strong> orders that include error-pr<strong>on</strong>e<br />
abbreviati<strong>on</strong>s, corresp<strong>on</strong>ding to a reducti<strong>on</strong> by approximately four fifths.<br />
Outliers<br />
In 2011 there were 12 outlier submissi<strong>on</strong>s from nine HCOs whose combined excess was 1,072<br />
more medicati<strong>on</strong> orders that include error-pr<strong>on</strong>e abbreviati<strong>on</strong>s. The outlier HCO rate was 10.9<br />
per 100 medicati<strong>on</strong> orders.<br />
Australasian Clinical Indicator Report 2004–2011 Page 7<br />
© ACHS. This work is copyright. Requests and inquiries c<strong>on</strong>cerning reproducti<strong>on</strong> and rights should<br />
be addressed to pos@achs.org.au
Medicati<strong>on</strong> Safety, v3<br />
Australasian Clinical Indicator Report 2004–2011 Page 8<br />
© ACHS. This work is copyright. Requests and inquiries c<strong>on</strong>cerning reproducti<strong>on</strong> and rights should<br />
be addressed to pos@achs.org.au
Medicati<strong>on</strong> Safety, v3<br />
Warfarin management<br />
CI 5.1: Warfarin – abnormal bleeding (L)<br />
Rati<strong>on</strong>ale<br />
Warfarin is a widely used drug with a narrow therapeutic index and with potentially serious<br />
adverse reacti<strong>on</strong>s such as sp<strong>on</strong>taneous bleeding.<br />
Numerator<br />
Denominator<br />
Total number of n<strong>on</strong> same-day separati<strong>on</strong>s receiving warfarin as an inpatient who<br />
experience abnormal bleeding<br />
Total number of n<strong>on</strong> same-day separati<strong>on</strong>s receiving warfarin as an inpatient<br />
Year<br />
Dimensi<strong>on</strong>s of care: Accessibility Appropriateness C<strong>on</strong>tinuity<br />
Effectiveness Quality Improvement and Risk Safety<br />
Desirable level: Low High Not specified<br />
Type of Indicator: Process Outcome Structure<br />
No.<br />
HCOs<br />
Total<br />
numerator<br />
Total<br />
denominator<br />
Rate #<br />
Rate#<br />
(20)<br />
Rate #<br />
(80)<br />
Centile<br />
Gains<br />
Stratum<br />
Gains<br />
Outlier<br />
Gains<br />
2004 28 13 2,313 0.56 0.47 0.99 2 3<br />
2005 36 28 2,686 1.04 0.58 1.38 12 5<br />
2006 31 16 2,530 0.63 0.33 0.63 8 3<br />
2007 39 17 6,297 0.27 0.16 0.28 7 5 2<br />
2008 31 12 4,790 0.25 0.23 0.31 1<br />
2009 26 16 2,865 0.56 0.30 0.41 7 7<br />
2010 22 27 2,856 0.95 0.39 0.62 16 15<br />
2011 24 23 1,637 1.41 0.43 1.22 16 16 9<br />
#per 100 separati<strong>on</strong>s<br />
In 2011 there were 35 records from 24 HCOs. The annual rate was 1.4 per 100 separati<strong>on</strong>s.<br />
Trends<br />
The fitted rate deteriorated from 0.45 to 0.77, a change of 0.32 per 100 separati<strong>on</strong>s.<br />
Rates and centiles by year<br />
A Low rate is desirable<br />
80 th centile rate<br />
x<br />
Aggregate rate<br />
Period average rate<br />
Fitted rate<br />
20 th centile rate<br />
Australasian Clinical Indicator Report 2004–2011 Page 9<br />
© ACHS. This work is copyright. Requests and inquiries c<strong>on</strong>cerning reproducti<strong>on</strong> and rights should<br />
be addressed to pos@achs.org.au
Medicati<strong>on</strong> Safety, v3<br />
Variati<strong>on</strong> between strata<br />
Rates by Public / Private<br />
Year<br />
Stratum<br />
No.<br />
HCOs<br />
Total<br />
numerator<br />
Total<br />
denominator<br />
Stratum<br />
rate #<br />
Standard<br />
error<br />
Stratum<br />
gains<br />
2011 Private 10 1 755 0.41 0.57<br />
Public 14 22 882 2.26 0.53 16<br />
#per 100 separati<strong>on</strong>s<br />
Rates by State<br />
Year<br />
Stratum<br />
No.<br />
HCOs<br />
Total<br />
numerator<br />
Total<br />
denominator<br />
Stratum<br />
rate #<br />
Standard<br />
error<br />
Stratum<br />
gains<br />
2011 NSW 7 1 386 0.57 0.78<br />
Vic 10 20 620 2.87 0.61 15<br />
Other 7 2 631 0.47 0.61<br />
#per 100 separati<strong>on</strong>s<br />
Variati<strong>on</strong> between HCOs<br />
In 2011 the potential gains totalled 16 fewer separati<strong>on</strong>s receiving warfarin as an inpatient who<br />
experience abnormal bleeding, corresp<strong>on</strong>ding to a reducti<strong>on</strong> by approximately two thirds.<br />
Australasian Clinical Indicator Report 2004–2011 Page 10<br />
© ACHS. This work is copyright. Requests and inquiries c<strong>on</strong>cerning reproducti<strong>on</strong> and rights should<br />
be addressed to pos@achs.org.au
Medicati<strong>on</strong> Safety, v3<br />
Outliers<br />
In 2011 there were three outlier submissi<strong>on</strong>s from two HCOs whose combined excess was nine<br />
more separati<strong>on</strong>s receiving warfarin as an inpatient who experience abnormal bleeding. The<br />
outlier HCO rate was 11.8 per 100 separati<strong>on</strong>s.<br />
Australasian Clinical Indicator Report 2004–2011 Page 11<br />
© ACHS. This work is copyright. Requests and inquiries c<strong>on</strong>cerning reproducti<strong>on</strong> and rights should<br />
be addressed to pos@achs.org.au
Medicati<strong>on</strong> Safety, v3<br />
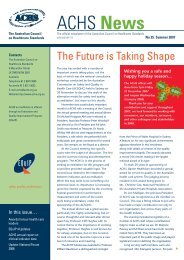
CI 5.2: Warfarin – INR * / prothrombin reading >5 (L)<br />
Rati<strong>on</strong>ale<br />
Warfarin is a widely used drug with a narrow therapeutic index and with potentially serious<br />
adverse reacti<strong>on</strong>s such as sp<strong>on</strong>taneous bleeding.<br />
Numerator<br />
Denominator<br />
Total number of n<strong>on</strong> same-day separati<strong>on</strong>s receiving warfarin as an inpatient with an INR<br />
reading greater than 5<br />
Total number of n<strong>on</strong> same-day separati<strong>on</strong>s receiving warfarin as an inpatient<br />
Year<br />
Dimensi<strong>on</strong>s of care: Accessibility Appropriateness C<strong>on</strong>tinuity<br />
Effectiveness Quality Improvement and Risk Safety<br />
Desirable level: Low High Not specified<br />
Type of Indicator: Process Outcome Structure<br />
No.<br />
HCOs<br />
Total<br />
numerator<br />
Total<br />
denominator<br />
Rate #<br />
Rate#<br />
(20)<br />
Rate #<br />
(80)<br />
Centile<br />
Gains<br />
Stratum<br />
Gains<br />
Outlier<br />
Gains<br />
2004 36 282 7,472 3.77 2.85 7.70 69 78 55<br />
2005 43 258 7,319 3.53 2.73 7.55 58 20<br />
2006 35 289 5,598 5.16 3.04 8.11 119 83 4<br />
2007 46 350 12,627 2.77 2.47 5.63 38 105 65<br />
2008 35 305 8,221 3.71 1.53 7.10 179 75<br />
2009 31 283 6,394 4.43 2.69 5.20 111 68<br />
2010 29 233 8,343 2.79 2.40 6.56 33 45 13<br />
2011 26 160 7,296 2.19 2.81 5.28 58 35<br />
#per 100 separati<strong>on</strong>s<br />
In 2011 there were 35 submissi<strong>on</strong>s from 26 HCOs. The annual rate was 2.2 per 100<br />
separati<strong>on</strong>s.<br />
Trends<br />
The fitted rate improved from 4.2 to 2.8, a change of 1.3 per 100 separati<strong>on</strong>s. This trend was<br />
also significant after allowing for the changing compositi<strong>on</strong> of HCOs c<strong>on</strong>tributing over the<br />
period. The rate change was 1.4 per 100 separati<strong>on</strong>s.<br />
Rates and centiles by year<br />
A Low rate is desirable<br />
80 th centile rate<br />
x<br />
Aggregate rate<br />
Period average rate<br />
Fitted rate<br />
20 th centile rate<br />
* The Internati<strong>on</strong>al Normalised Ratio is a test for blood clotting.<br />
Australasian Clinical Indicator Report 2004–2011 Page 12<br />
© ACHS. This work is copyright. Requests and inquiries c<strong>on</strong>cerning reproducti<strong>on</strong> and rights should<br />
be addressed to pos@achs.org.au
Medicati<strong>on</strong> Safety, v3<br />
Variati<strong>on</strong> between strata<br />
Rates by Metro / N<strong>on</strong> metro<br />
Year<br />
Stratum<br />
No.<br />
HCOs<br />
Total<br />
numerator<br />
Total<br />
denominator<br />
Stratum<br />
rate #<br />
Standard<br />
error<br />
Stratum<br />
gains<br />
2011 Metropolitan 10 87 2,282 3.95 0.38 58<br />
N<strong>on</strong>-Metro 16 73 5,014 1.39 0.25<br />
#per 100 separati<strong>on</strong>s<br />
Rates by Public / Private<br />
Year<br />
Stratum<br />
No.<br />
HCOs<br />
Total<br />
numerator<br />
Total<br />
denominator<br />
Stratum<br />
rate #<br />
Standard<br />
error<br />
Stratum<br />
gains<br />
2011 Private 8 85 2,393 3.74 0.40 55<br />
Public 18 75 4,903 1.44 0.28<br />
#per 100 separati<strong>on</strong>s<br />
Rates by State<br />
Year<br />
Stratum<br />
No.<br />
HCOs<br />
Total<br />
numerator<br />
Total<br />
denominator<br />
Stratum<br />
rate #<br />
Standard<br />
error<br />
Stratum<br />
gains<br />
2011 NSW 7 11 367 3.32 1.21<br />
Vic 10 31 661 4.25 0.90 15<br />
Other 9 118 6,268 1.91 0.29<br />
#per 100 separati<strong>on</strong>s<br />
Australasian Clinical Indicator Report 2004–2011 Page 13<br />
© ACHS. This work is copyright. Requests and inquiries c<strong>on</strong>cerning reproducti<strong>on</strong> and rights should<br />
be addressed to pos@achs.org.au
Medicati<strong>on</strong> Safety, v3<br />
Variati<strong>on</strong> between HCOs<br />
There were no potential gains in 2011.<br />
Outliers<br />
In 2011 there were two outlier submissi<strong>on</strong>s from <strong>on</strong>e HCO whose combined excess was 35<br />
more separati<strong>on</strong>s receiving warfarin as an inpatient with an INR reading greater than five. The<br />
outlier HCO rate was 4.1 per 100 separati<strong>on</strong>s.<br />
Australasian Clinical Indicator Report 2004–2011 Page 14<br />
© ACHS. This work is copyright. Requests and inquiries c<strong>on</strong>cerning reproducti<strong>on</strong> and rights should<br />
be addressed to pos@achs.org.au
Medicati<strong>on</strong> Safety, v3<br />
CI 5.3: Warfarin – written drug informati<strong>on</strong> up<strong>on</strong> discharge (H)<br />
Rati<strong>on</strong>ale<br />
Warfarin is a widely used drug with a narrow therapeutic index and with potentially serious<br />
adverse reacti<strong>on</strong>s such as sp<strong>on</strong>taneous bleeding.<br />
Numerator<br />
Denominator<br />
Total number of patients discharged <strong>on</strong> warfarin who receive written drug informati<strong>on</strong> prior<br />
to discharge<br />
Total number of n<strong>on</strong> same-day separati<strong>on</strong>s receiving warfarin as an inpatient<br />
Year<br />
Dimensi<strong>on</strong>s of care: Accessibility Appropriateness C<strong>on</strong>tinuity<br />
Effectiveness Quality Improvement and Risk Safety<br />
Desirable level: Low High Not specified<br />
Type of Indicator: Process Outcome Structure<br />
No.<br />
HCOs<br />
Total<br />
numerator<br />
Total<br />
denominator<br />
Rate #<br />
Rate#<br />
(20)<br />
Rate #<br />
(80)<br />
Centile<br />
Gains<br />
Stratum<br />
Gains<br />
Outlier<br />
Gains<br />
2004 18 385 420 91.7 85.1 99.2 31 17 17<br />
2005 29 665 779 85.4 86.9 99.5 110 70 72<br />
2006 24 483 509 94.9 96.2 99.3 22 16<br />
2007 30 542 734 73.8 78.1 98.8 183 89 116<br />
2008 27 619 807 76.7 61.0 96.9 163 74<br />
2009 23 549 689 79.7 88.6 96.6 116 105 26<br />
2010 25 577 652 88.5 82.1 97.6 60 7<br />
2011 20 2,296 2,728 84.2 27.9 99.0 404 87 129<br />
#per 100 patients<br />
In 2011 there were 25 submissi<strong>on</strong>s from 20 HCOs. The annual rate was 84.2 per 100 patients.<br />
Trends<br />
The fitted rate deteriorated from 86.0 to 82.6, a change of 3.4 per 100 patients.<br />
Rates and centiles by year<br />
A High rate is desirable<br />
80 th centile rate<br />
x<br />
Aggregate rate<br />
Period average rate<br />
Fitted rate<br />
20 th centile rate<br />
Australasian Clinical Indicator Report 2004–2011 Page 15<br />
© ACHS. This work is copyright. Requests and inquiries c<strong>on</strong>cerning reproducti<strong>on</strong> and rights should<br />
be addressed to pos@achs.org.au
Medicati<strong>on</strong> Safety, v3<br />
Variati<strong>on</strong> between strata<br />
Rates by Public / Private<br />
Year<br />
Stratum<br />
No.<br />
HCOs<br />
Total<br />
numerator<br />
Total<br />
denominator<br />
Stratum<br />
rate #<br />
Standard<br />
error<br />
Stratum<br />
gains<br />
2011 Private 8 2,072 2,370 87.4 3.86<br />
Public 12 224 358 63.1 9.94 87<br />
#per 100 patients<br />
Variati<strong>on</strong> between HCOs<br />
In 2011 the potential gains totalled 404 more patients discharged <strong>on</strong> warfarin who receive<br />
written drug informati<strong>on</strong> prior to discharge.<br />
Outliers<br />
In 2011 there were seven outlier submissi<strong>on</strong>s from seven HCOs whose combined excess was<br />
128 fewer patients discharged <strong>on</strong> warfarin who receive written drug informati<strong>on</strong> prior to<br />
discharge. The outlier HCO rate was 22.4 per 100 patients.<br />
Australasian Clinical Indicator Report 2004–2011 Page 16<br />
© ACHS. This work is copyright. Requests and inquiries c<strong>on</strong>cerning reproducti<strong>on</strong> and rights should<br />
be addressed to pos@achs.org.au
Medicati<strong>on</strong> Safety, v3<br />
CI 5.4: Warfarin – dosage review following high INR result (H)<br />
Rati<strong>on</strong>ale<br />
Warfarin is a widely used drug with a narrow therapeutic index and with potentially serious<br />
adverse reacti<strong>on</strong>s such as sp<strong>on</strong>taneous bleeding.<br />
Numerator<br />
Denominator<br />
Total number of patients <strong>on</strong> warfarin with an INR of 4 or above whose dosage has been<br />
adjusted or reviewed prior to the next warfarin dose<br />
Total number of patients <strong>on</strong> warfarin with an INR result of 4 or above<br />
Year<br />
Dimensi<strong>on</strong>s of care: Accessibility Appropriateness C<strong>on</strong>tinuity<br />
Effectiveness Quality Improvement and Risk Safety<br />
Desirable level: Low High Not specified<br />
Type of Indicator: Process Outcome Structure<br />
No.<br />
HCOs<br />
Total<br />
numerator<br />
Total<br />
denominator<br />
Rate #<br />
Rate#<br />
(20)<br />
Rate #<br />
(80)<br />
Centile<br />
Gains<br />
Stratum<br />
Gains<br />
2011 23 271 280 96.8 97.6 99.4 7 6<br />
#per 100 patients<br />
In 2011 there were 30 submissi<strong>on</strong>s from 23 HCOs. The annual rate was 96.8 per 100 patients.<br />
Outlier<br />
Gains<br />
Variati<strong>on</strong> between strata<br />
There were no significant stratum differences in 2011.<br />
Variati<strong>on</strong> between HCOs<br />
There was relatively little variati<strong>on</strong> between HCOs and so the potential gains were small in<br />
2011.<br />
Outliers<br />
In 2011 there were two outlier submissi<strong>on</strong>s from two HCOs whose combined excess was six<br />
fewer patients whose dosage has been adjusted or reviewed prior to the next warfarin dose.<br />
The outlier HCO rate was 50.0 per 100 patients.<br />
Australasian Clinical Indicator Report 2004–2011 Page 17<br />
© ACHS. This work is copyright. Requests and inquiries c<strong>on</strong>cerning reproducti<strong>on</strong> and rights should<br />
be addressed to pos@achs.org.au
Medicati<strong>on</strong> Safety, v3<br />
CI 5.5: Warfarin – starting doses c<strong>on</strong>sistent with hospital approved protocol (H)<br />
Rati<strong>on</strong>ale<br />
Warfarin is a widely used drug with a narrow therapeutic index and with potentially serious<br />
adverse reacti<strong>on</strong>s such as sp<strong>on</strong>taneous bleeding.<br />
Numerator<br />
Denominator<br />
Total number of patients prescribed hospital initiated warfarin whose starting doses are<br />
c<strong>on</strong>sistent with a hospital approved protocol<br />
Total number of patients initiated <strong>on</strong> warfarin<br />
Dimensi<strong>on</strong>s of care: Accessibility Appropriateness C<strong>on</strong>tinuity<br />
Effectiveness Quality Improvement and Risk Safety<br />
Desirable level: Low High Not specified<br />
Type of Indicator: Process Outcome Structure<br />
Year<br />
No.<br />
HCOs<br />
Total<br />
numerator<br />
Total<br />
denominator<br />
Rate #<br />
Rate#<br />
(20)<br />
Rate #<br />
(80)<br />
Centile<br />
Gains<br />
2011 7 57 85 67.1 52.0 98.1 26<br />
#per 100 patients<br />
Stratum<br />
Gains<br />
Outlier<br />
Gains<br />
In 2011 there were eight submissi<strong>on</strong>s from seven HCOs. The annual rate was 67.1 per 100<br />
patients.<br />
Variati<strong>on</strong> between strata<br />
There were no significant stratum differences in 2011.<br />
Variati<strong>on</strong> between HCOs<br />
In 2011 the potential gains totalled 26 more patients whose starting doses of warfarin are<br />
c<strong>on</strong>sistent with a hospital approved protocol.<br />
Outliers<br />
There were no outlier HCOs in 2011.<br />
Australasian Clinical Indicator Report 2004–2011 Page 18<br />
© ACHS. This work is copyright. Requests and inquiries c<strong>on</strong>cerning reproducti<strong>on</strong> and rights should<br />
be addressed to pos@achs.org.au
Medicati<strong>on</strong> Safety, v3<br />
Timely and appropriate m<strong>on</strong>itoring of aminoglycoside antibiotics<br />
CI 6.1: Aminoglycoside toxicity – dosage adjustment prior to next dose (H)<br />
Rati<strong>on</strong>ale<br />
Aminoglycosides are useful but toxic medicines with a narrow therapeutic index. In patients<br />
treated with aminoglycosides for more than 48 hours, dosage should be adjusted according to<br />
plasma drug c<strong>on</strong>centrati<strong>on</strong>s and renal functi<strong>on</strong>. Failure to act <strong>on</strong> a toxic c<strong>on</strong>centrati<strong>on</strong> result<br />
could lead to renal impairment and ototoxicity.<br />
Numerator<br />
Denominator<br />
Total number of patients with a toxic aminoglycoside c<strong>on</strong>centrati<strong>on</strong> whose dosage has<br />
been adjusted prior to the next aminoglycoside dose<br />
Total number of patients with a toxic aminoglycoside c<strong>on</strong>centrati<strong>on</strong> in the sample<br />
Dimensi<strong>on</strong>s of care: Accessibility Appropriateness C<strong>on</strong>tinuity<br />
Effectiveness Quality Improvement and Risk Safety<br />
Desirable level: Low High Not specified<br />
Type of Indicator: Process Outcome Structure<br />
Year<br />
No.<br />
HCOs<br />
Total<br />
numerator<br />
Total<br />
denominator<br />
Rate #<br />
Rate#<br />
(20)<br />
Rate #<br />
(80)<br />
2011 3 45 46 97.8 97.8 97.8<br />
#per 100 patients<br />
Centile<br />
Gains<br />
Stratum<br />
Gains<br />
Outlier<br />
Gains<br />
In 2011 there were three submissi<strong>on</strong>s from three HCOs. The annual rate was 97.8 per 100<br />
patients.<br />
Variati<strong>on</strong> between strata<br />
There were no significant stratum differences in 2011.<br />
Variati<strong>on</strong> between HCOs<br />
There were no potential gains in 2011.<br />
Outliers<br />
There were no outlier HCOs in 2011.<br />
Australasian Clinical Indicator Report 2004–2011 Page 19<br />
© ACHS. This work is copyright. Requests and inquiries c<strong>on</strong>cerning reproducti<strong>on</strong> and rights should<br />
be addressed to pos@achs.org.au
Medicati<strong>on</strong> Safety, v3<br />
Clinical Significance of these results<br />
Of the six indicators that were suitable for trending, two improved and two deteriorated. There was a<br />
significant c<strong>on</strong>tributi<strong>on</strong> from private HCOs to these indicators, in excess of 50% of patients covered in<br />
several indicators.<br />
Reporting of adverse drug reacti<strong>on</strong>s to the TGA<br />
CI 1.1: Adverse drug reacti<strong>on</strong>s reported to OPC, TGA (N)<br />
In 2011, there were 893,193 separati<strong>on</strong>s reported to the Therapeutic Goods Administrati<strong>on</strong> (TGA) from 97<br />
HCOs. The annual rate was 0.12 per 100 separati<strong>on</strong>s. The fitted rate decreased from 0.17 to 0.093, a<br />
change of 0.074 per 100 separati<strong>on</strong>s. This trend was also significant after allowing for the changing<br />
compositi<strong>on</strong> of HCOs c<strong>on</strong>tributing over the period.<br />
Medicati<strong>on</strong> errors resulting in an adverse event<br />
CI 2.1: Medicati<strong>on</strong> errors – adverse event requiring interventi<strong>on</strong> (L)<br />
In 2011, there were 7,132,050 bed days reported from 247 HCOs. The annual rate was 0.013 per 100 bed<br />
days. The fitted rate improved from 0.051 to 0.030, a change of 0.021 per 100 bed days. This trend was<br />
also significant after allowing for the changing compositi<strong>on</strong> of HCOs c<strong>on</strong>tributing over the period. The rate<br />
change was 0.020 per 100 bed days. In 2011, there were 21 outlier submissi<strong>on</strong>s from 17 HCOs whose<br />
combined excess was 330 more medicati<strong>on</strong> errors resulting in an adverse event requiring interventi<strong>on</strong>.<br />
Documentati<strong>on</strong> of adverse drug reacti<strong>on</strong>s (ADRs)<br />
CI 3.1: Known ADRs documented in current medicati<strong>on</strong> chart (H)<br />
In 2011, there were 15,674 patients reported from 57 HCOs. The annual rate was 93.0 per 100 patients. In<br />
2011, there were 21 outlier submissi<strong>on</strong>s from 17 HCOs whose combined excess was 569 fewer patients<br />
whose known ADRs are documented <strong>on</strong> the current medicati<strong>on</strong> chart.<br />
Error-pr<strong>on</strong>e abbreviati<strong>on</strong>s<br />
CI 4.1: Medicati<strong>on</strong> orders with error-pr<strong>on</strong>e abbreviati<strong>on</strong>s (L)<br />
In 2011, 58,827 medicati<strong>on</strong> orders were reported from 36 HCOs. The annual rate was 4.7 per 100<br />
medicati<strong>on</strong> orders. There were 12 outlier submissi<strong>on</strong>s from nine HCOs whose combined excess was 1,072<br />
more medicati<strong>on</strong> orders that include error-pr<strong>on</strong>e abbreviati<strong>on</strong>s.<br />
Warfarin management<br />
CI 5.1: Warfarin – abnormal bleeding (L)<br />
In 2011, there were 35 submissi<strong>on</strong>s reported from 24 HCOs. The annual rate was 1.4 per 100 separati<strong>on</strong>s.<br />
The fitted rate deteriorated from 0.45 to 0.77, a change of 0.32 per 100 separati<strong>on</strong>s. In 2011, there were<br />
three outlier submissi<strong>on</strong>s from two HCOs whose combined excess was nine more separati<strong>on</strong>s of inpatients<br />
receiving warfarin who experience abnormal bleeding. The outlier HCO rate was 11.8 per 100 separati<strong>on</strong>s.<br />
CI 5.2: Warfarin – INR * / prothrombin reading >5 (L)<br />
In 2011, there were 7,296 separati<strong>on</strong>s reported from 26 HCOs. The annual rate was 2.2 per 100<br />
separati<strong>on</strong>s. The fitted rate improved from 4.2 to 2.8, a change of 1.3 per 100 separati<strong>on</strong>s. This trend was<br />
also significant after allowing for the changing compositi<strong>on</strong> of HCOs c<strong>on</strong>tributing over the period. The rate<br />
change was 1.4 per 100 separati<strong>on</strong>s. In 2011, there were two outlier submissi<strong>on</strong>s from a single HCO<br />
whose combined excess was 35 more separati<strong>on</strong>s receiving warfarin as an inpatient with an INR* reading<br />
greater than 5.<br />
* The Internati<strong>on</strong>al Normalised Ratio is a test for blood clotting.<br />
Australasian Clinical Indicator Report 2004–2011 Page 20<br />
© ACHS. This work is copyright. Requests and inquiries c<strong>on</strong>cerning reproducti<strong>on</strong> and rights should<br />
be addressed to pos@achs.org.au
Medicati<strong>on</strong> Safety, v3<br />
CI 5.3: Warfarin – written drug informati<strong>on</strong> up<strong>on</strong> discharge (H)<br />
In 2011, there were 2,728 patients reported from 20 HCOs. The annual rate was 84.2 per 100 patients.<br />
The fitted rate deteriorated from 86.0 to 82.6, a change of 3.4 per 100 patients. In 2011, there were seven<br />
outlier submissi<strong>on</strong>s from seven HCOs whose combined excess was 128 fewer patients discharged <strong>on</strong><br />
warfarin who received written drug informati<strong>on</strong> up<strong>on</strong> discharge.<br />
CI 5.4: Warfarin – dosage review following high INR result (H)<br />
In 2011, there were 280 patients reported from 23 HCOs. The annual rate was 96.8 per 100 patients. In<br />
2011, there were two outlier submissi<strong>on</strong>s from two HCOs whose combined excess was six fewer patients<br />
whose dosage has been adjusted or reviewed prior to the next warfarin dose.<br />
CI 5.5: Warfarin – starting doses c<strong>on</strong>sistent with hospital approved protocol (H)<br />
In 2011, there were 85 patients reported from seven HCOs. The annual rate was 67.1 per 100 patients.<br />
Timely and appropriate m<strong>on</strong>itoring of aminoglycoside antibiotics<br />
CI 6.1: Aminoglycoside toxicity – dosage adjustment prior to next dose (H)<br />
In 2011, there were 46 patients reported from three HCOs. The annual rate was 97.8 per 100 patients. *<br />
Australasian Clinical Indicator Report 2004–2011 Page 21<br />
© ACHS. This work is copyright. Requests and inquiries c<strong>on</strong>cerning reproducti<strong>on</strong> and rights should<br />
be addressed to pos@achs.org.au
Medicati<strong>on</strong> Safety, v3<br />
Expert commentary<br />
Therapeutic Goods Administrati<strong>on</strong> (TGA)<br />
Reporting of adverse drug reacti<strong>on</strong>s to the TGA<br />
Although the number of adverse drug reacti<strong>on</strong> (ADR) reports submitted to the TGA increased<br />
from almost 11,000 in 2004 to 14,500 in 2011, there has been a drop in reporting of CI 1.1 by<br />
HCOs from a peak of 3,010 in 2004 to 1,660 in 2011. This is c<strong>on</strong>trary to internati<strong>on</strong>al trends,<br />
where the number of hospital admissi<strong>on</strong>s, and hospital admissi<strong>on</strong>s extended by adverse drug<br />
reacti<strong>on</strong>s, is increasing. 1,2 Australia shares an ageing populati<strong>on</strong> and the tendency to increasing<br />
polypharmacy, suggesting a likely increase in the total number of adverse drug reacti<strong>on</strong>s<br />
(ADRs) experienced by c<strong>on</strong>sumers. 3,4<br />
While the rate of reporting increased in 2011 to a rate of 0.12 reports per 100 separati<strong>on</strong>s, it is<br />
not clear why the number of reports and the number of reporting HCOs has dropped,<br />
particularly since there is a requirement for the clinical workforce in public hospitals to document<br />
patients’ previously known ADRs and report them to the TGA.<br />
The TGA seeks informati<strong>on</strong> from a variety of sources when m<strong>on</strong>itoring the safety of medicines<br />
and vaccines <strong>on</strong> the market. One source of informati<strong>on</strong> is sp<strong>on</strong>taneous adverse event reporting.<br />
The TGA encourages all hospitals to ensure that they have systems in place for reporting<br />
adverse events related to medicines.<br />
Adverse event reports from hospitals are particularly important to the TGA for a number of<br />
reas<strong>on</strong>s:<br />
<br />
<br />
<br />
hospitals have early experience with new medicines and/or their use in people with comorbidities<br />
who would be excluded from clinical trials, and therefore may detect new<br />
signals;<br />
hospitals are encouraged to have in place systems to ensure that ADRs are identified<br />
and reported internally and to the TGA and<br />
patients may present to a hospital following a serious ADR.<br />
The TGA encourages all health professi<strong>on</strong>als to report adverse events associated with<br />
medicines and thus c<strong>on</strong>tribute to the post-market detecti<strong>on</strong> and understanding of adverse drug<br />
reacti<strong>on</strong>s. The TGA supports the use of e-prescripti<strong>on</strong> forms to increase ADR reporting, and<br />
looks forward to the update of the software functi<strong>on</strong>ality.<br />
Medicines are just <strong>on</strong>e clinical indicator data set. Equal c<strong>on</strong>siderati<strong>on</strong> should be given to<br />
collecting CIs <strong>on</strong> medical device incident reports. The TGA also analyses reports of adverse<br />
reacti<strong>on</strong>s to medical devices to detect and investigate safety signals, and can provide<br />
comments <strong>on</strong> these.<br />
Australasian Clinical Indicator Report 2004–2011 Page 22<br />
© ACHS. This work is copyright. Requests and inquiries c<strong>on</strong>cerning reproducti<strong>on</strong> and rights should<br />
be addressed to pos@achs.org.au
Medicati<strong>on</strong> Safety, v3<br />
Warfarin management<br />
The TGA encourages the collecti<strong>on</strong> of data <strong>on</strong> reporting rates of warfarin, however has no<br />
specific comment <strong>on</strong> these indicators (CIs 5.1–5.5). As other anticoagulants gain market<br />
prominence, their potential for exacerbating morbidity and mortality may need to be m<strong>on</strong>itored.<br />
The TGA suggests that c<strong>on</strong>siderati<strong>on</strong> be given to collecting data <strong>on</strong> the use of other<br />
anticoagulants as they become available.<br />
References<br />
1 Wu TY, Jen MH, Bottle A et al. Ten year trends in hospital admissi<strong>on</strong>s for adverse drug reacti<strong>on</strong>s in<br />
England 1999–2009. J R Soc Med 2010; 103(6): 239–250.<br />
2 Hartholt KA, van der Velde N, Looman CWN et al. Adverse drug reacti<strong>on</strong>s related hospital admissi<strong>on</strong>s in<br />
pers<strong>on</strong>s aged 60 years and over, The Netherlands, 1981–2007: less rapid increase, different drugs. PLoS<br />
One 2010; 5(11): e13977.<br />
3 Hovstadius B, Hovstadius K, Astrand B and Peterss<strong>on</strong> G. Increasing polypharmacy – an individualbased<br />
study of the Swedish populati<strong>on</strong> 2005–2008. NCHS Data Brief 2010; 42(Sep): 1–8.<br />
4 Jyrkkä J, Vartiainen L, Hartikainen S et al. Increasing use of medicines in elderly pers<strong>on</strong>s: a five year<br />
follow-up of the Kuopio 75+ study. Eur J Clin Pharmacol 2006; 62(2): 151–158.<br />
Australasian Clinical Indicator Report 2004–2011 Page 23<br />
© ACHS. This work is copyright. Requests and inquiries c<strong>on</strong>cerning reproducti<strong>on</strong> and rights should<br />
be addressed to pos@achs.org.au