Revving up! Ashok Leyland - Motilal Oswal
Revving up! Ashok Leyland - Motilal Oswal
Revving up! Ashok Leyland - Motilal Oswal

You also want an ePaper? Increase the reach of your titles
YUMPU automatically turns print PDFs into web optimized ePapers that Google loves.
12 November 2012<br />
Initiating Coverage | Sector: Automobile<br />
<strong>Ashok</strong> <strong>Leyland</strong><br />
Jinesh Gandhi (Jinesh@<strong>Motilal</strong><strong>Oswal</strong>.com) + 91 22 3982 5416<br />
Chirag Jain (Chirag.Jain@<strong>Motilal</strong><strong>Oswal</strong>.com) + 91 22 3982 5418<br />
<strong>Revving</strong> <strong>up</strong>!
<strong>Ashok</strong> <strong>Leyland</strong><br />
<strong>Ashok</strong> <strong>Leyland</strong>: <strong>Revving</strong> <strong>up</strong>!<br />
Page No.<br />
Summary ............................................................................................................ 3<br />
CV cycle bottoming out, expect recovery in FY14 ....................................... 4-7<br />
Expect <strong>Ashok</strong> <strong>Leyland</strong> to recover lost ground ........................................... 7-11<br />
JV with Nissan for LCVs to plug gaps in product portfolio ...................... 12-14<br />
Other JVs/investments also promising ..................................................... 15-16<br />
Auxiliary businesses, exports to lower earnings cyclicality..................... 17-18<br />
Pantnagar ramp-<strong>up</strong>, operating leverage to s<strong>up</strong>port margins ................ 19-21<br />
2QFY13: Strong performance with EBITDA margin of 10.1% ........................22<br />
Initiate coverage with Buy rating ............................................................. 23-25<br />
Snapshot of operating and financial indicators ...................................... 26-27<br />
Financials and valuation ........................................................................... 28-29<br />
Investors are advised to refer through disclosures made at the end of the Research Report.<br />
12 November 2012<br />
2
BSE SENSEX<br />
S&P CNX<br />
18,684 5,686<br />
Initiating Coverage | 12 November 2012<br />
Sector: Automobiles<br />
<strong>Ashok</strong> <strong>Leyland</strong><br />
CMP: INR24 TP: INR32 Buy<br />
<strong>Revving</strong> <strong>up</strong>!<br />
CV cycle to recover in FY14; AL offers best play<br />
Bloomberg<br />
AL IN<br />
Equity Shares (m) 2,660.7<br />
52-Week Range 33/20<br />
1,6,12 Rel. Perf. (%) 8/-19/-17<br />
M.Cap. (INR b) 64<br />
M.Cap. (USD b) 1.2<br />
Financial summary (INR b)<br />
Y/E March 2012 2013E 2014E<br />
Net Income 128.4 139.2 161.6<br />
EBITDA 12.6 13.9 16.6<br />
Adj. EPS (INR) 2.1 2.1 2.8<br />
EPS Gr. (%) -10.3 -0.9 31.4<br />
BV/Sh. (INR) 15.8 16.8 18.1<br />
P/E (x) 11.3 11.4 8.7<br />
P/BV (x) 1.5 1.4 1.3<br />
EV/EBITDA (x) 7.3 7.4 6.1<br />
Div. Payout (%) 47 47 45<br />
Div. Yield (%) 4.1 4.1 5.2<br />
RoE (%) 13.4 12.6 15.3<br />
RoCE (%) 12.5 12.1 13.6<br />
Prices as on 9 November 2012<br />
Shareholding pattern (%)<br />
As on Sep-12 Jun-12 Sep-11<br />
Promoter 38.61 38.61 38.61<br />
Dom. Inst 14.23 14.05 15.32<br />
Foreign 29.24 30.14 30.55<br />
Others 17.92 17.19 15.51<br />
Stock performance (1 year)<br />
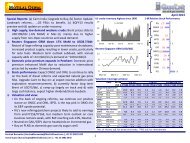
• CV cycle to bottom-out in FY13 and witness sharp recovery in FY14, driven by expected<br />
monetary easing and resultant pick-<strong>up</strong> in the industrial activity.<br />
• <strong>Ashok</strong> <strong>Leyland</strong>'s volumes would be s<strong>up</strong>ported by demand pick-<strong>up</strong> in South India, new<br />
launches, and Dost ramp-<strong>up</strong>. Higher utilization at Pantnagar co<strong>up</strong>led with better<br />
operating leverage would s<strong>up</strong>port margins; Dost would contribute meaningfully to<br />
overall profits.<br />
• Estimate EPS growth of ~31% CAGR in FY14-15 driven by volume growth of 16%. RoE to<br />
bottom-out in FY13 and improve 270bp in FY14. Also, it trades at very attractive yield<br />
of over 4%. Initiate coverage with a Buy rating and a target price of INR32.<br />
CV cycle bottoming out, expect recovery in FY14: Expected monetary easing to<br />
drive pick-<strong>up</strong> in the industrial activity, with estimated growth of ~5.3% in IIP in<br />
FY14 v/s ~1.4% in FY13. Improvement in infrastructure activity co<strong>up</strong>led withbetter<br />
outlook in agriculture outlook (driven by late recovery in monsoon) augurs well<br />
for CV demand. CV volumes for the Industry are estimated to grow at 14% in<br />
FY14, with 12% M&HCV volumes and LCV volumes growing 15%. AL's volumes are<br />
estimated to grow 16.5% in FY14, with 12% M&HCV volume growth and ~29%<br />
volume growth of Dost.<br />
JV with Nissan for LCVs to plug gap in product portfolio: The launch of LCV Dost by<br />
the AL-Nissan JV plugs the gap in AL's product portfolio and marks its entry into<br />
the high growth LCV segment. Initially, Dost is being manufactured and marketed<br />
using AL's existing infrastructure, for which it gets manufacturing and marketing<br />
margins. The JV plans to launch two more LCVs, Stile and Partner, with overall<br />
intent to launch one product every six months. While Dost would have an adverse<br />
impact on margins, it would contribute 14%/11% to profits.<br />
Pantnagar ramp-<strong>up</strong>, operating leverage to s<strong>up</strong>port margins, offset weak pricing<br />
power: Operating leverage and ramp-<strong>up</strong> at the excise/income tax exempt<br />
Pantnagar plant would offset the impact of higher discounts and increase in<br />
contribution from Dost (margin dilutive, but EBITDA accretive). We expect EBITDA<br />
margin to improve by 20bp in FY13 to 10% and by 30bp in 10.3% in FY14.Softening<br />
commodity prices could drive <strong>up</strong> margins (not yet factored in our estimates).<br />
Initiate coverage with Buy rating: AL's operating and stock performance is highly<br />
correlated with M&HCV volumes. Expected improvement in M&HCV outlook for<br />
FY14 augurs well for AL, driving 31% EPS CAGR in FY14-15 and s<strong>up</strong>porting higher<br />
dividend payout. AL, being pure play and second largest CV player in India, is the<br />
best bet to play expected improvement in CV cycle. The stock currently trades at<br />
8.7x FY13E EPS of INR2.8, an EV of 6.1x FY14E EBITDA and attractive dividend yield<br />
of 4.1%. Initiate coverage with Buy rating and target price of INR32 (EV of ~7.5x<br />
FY14E EBITDA) - an <strong>up</strong>side of 34%.<br />
12 November 2012<br />
3
<strong>Ashok</strong> <strong>Leyland</strong><br />
CV cycle bottoming out, expect recovery in FY14<br />
LCVs on secular growth path<br />
• Expected monetary easing to drive pick-<strong>up</strong> in the industrial activity, with estimated growth<br />
of ~5.3% in IIP in FY14 v/s ~1.4% in FY13.<br />
• Further, improvement in infrastructure activity co<strong>up</strong>led with improvement in agriculture<br />
outlook driven by late recovery monsoon augurs well for CV demand.<br />
• Improvement in freight availability to drive improvement in utilization and profitability<br />
for fleet operators, driving CV demand.<br />
• CV volumes estimated to grow at 14% in FY14, with 12% M&HCV volumes and LCV<br />
volumes growing 15% in FY14.<br />
IIP bottoming out, with recovery expected in FY14…<br />
Empirical evidence indicates high correlation between IIP growth and CV volume<br />
growth. Over FY03-12, IIP has grown at a CAGR of 8.2% against a CAGR of 18% for the<br />
CV sector. However, in FY12/FY13E, IIP growth was just 3.1%/1.4%, down sharply from<br />
5%+ in 1HFY12 and 8.2% in FY11. Both capital goods and intermediate goods de-grew<br />
4.1% and 1%, respectively. As a result, CV demand has been under pressure during<br />
FY12-13 with growth of just 1% CAGR over FY11-13 and ~5% de-growth in FY13E.<br />
However, we believe economic activity to bottom out in FY13 with GDP growth of<br />
5.8% and IIP growth of just ~1.4%. While monetary softening would boost industrial<br />
activity, recovery in monsoon would boost Rabi crop. As a result, our economist<br />
estimates FY14 to be year of recovery with GDP growth of 6.5%, led by 5.3% growth in<br />
Industry, 7.6% growth in Services and 3.6% growth in Agriculture.<br />
M&HCV growth correlated to IIP growth<br />
Our economist estimates<br />
GDP growth at 6.5% for<br />
FY14, translating into IIP<br />
growth of 5.3%<br />
Source: SIAM; *data prior to FY02 relates to calender year<br />
…driven by expected monetary easing<br />
To control inflation, RBI hiked interest rates seven times in CY11, aggregating 225bp,<br />
on top of a 150bp increase in CY10. Higher cost of borrowing led to ~200bp increase in<br />
auto financing rate in FY12. With ~85% of M&HCVs being purchased on finance (on an<br />
average), higher interest rates dented transporters' profitability, adversely impacting<br />
M&HCV sales. RBI initiated easing of monetary policy by implementing a 50bp rate<br />
cut in April 2012. In the recent Monetary Policy, RBI altered the stance to give priority<br />
to liquidity followed by revival of growth and then control of inflation. This contrasts<br />
with the last mentioned stance of end-July 2012 whereby inflation control was<br />
accorded highest priority, followed by growth and then liquidity. Further, its guidance<br />
12 November 2012<br />
4
<strong>Ashok</strong> <strong>Leyland</strong><br />
indicates easing: The cut in CRR …"anticipates projected inflation trajectory which<br />
indicates a rise in inflation before easing in last quarter. While risks to this trajectory<br />
remain, the baseline scenario suggests a reasonable likelihood of further policy easing<br />
in the fourth quarter of 2012-13. The above policy guidance will, however, be<br />
conditioned by the evolving growth-inflation dynamic". Our economist believes that<br />
multiple headwinds to growth and easing inflationary pressures provide the necessary<br />
backdrop for RBI to continue its easing monetary policy stance. We expect at least<br />
another 50bp rate cut in FY13 (over and above 50bp cut in April 2012) along with other<br />
liquidity easing measures.<br />
HDFC Bank's Base rate has been lowered by 25bp<br />
RBI has guided<br />
for reasonable likelihood<br />
of rate-cut in 4QFY13,<br />
which would drive<br />
further reduction in<br />
lending rates for CVs<br />
Source: Company, MOSL<br />
Availability of freight - key to fleet operator profitability and CV demand<br />
Freight rates are a proxy for freight availability and act as a lead indicator for CV demand.<br />
Better freight availability leads to higher capacity utilization, which in turn provides<br />
fleet operators flexibility to pass on cost inflation and s<strong>up</strong>port his profitability. Lower<br />
freight availability has resulted in freight rate increase lagging cost inflation. Ownership/<br />
operating costs have increased considerably due to a) hike in excise duty, b) higher<br />
interest rates, (c) increase in toll rates in certain routes, and (d) prices increase in diesel<br />
and tyres. However, fleet operators have been able to only partly pass-through cost<br />
inflation and that too only recent diesel cost increase. As a result, the profitability of<br />
fleet operators has shrunk of high levels, although still earning near average margins.<br />
This is reflected in ~12.5% de-growth in M&HCV volumes in 1HFY13.<br />
Freight rates have been lagging cost inflation (indexed)<br />
Source: TCI, MOSL<br />
12 November 2012<br />
5
<strong>Ashok</strong> <strong>Leyland</strong><br />
Freight availability expected to improve as all 3 key drivers turning positive<br />
Freight availability, which is key driver for CV demand, is largely determined by<br />
industrial output, agricultural output, and infrastructure activity. These three<br />
parameters co<strong>up</strong>led with interest rates explain ~95% of CV demand. While FY13YTD<br />
has seen poor performance in all these 3 key drivers, we believe improvement in<br />
them over next 3-6 months driven by a) softening in interest rates aiding industrial<br />
activity and infrastructure, b) late recovery in monsoon benefitting Rabi crop and c)<br />
State elections in key states and General election in 2014 driving pre-election<br />
developmental work.<br />
Expected improvement<br />
in industrial activity,<br />
possibility of pick-<strong>up</strong> in<br />
infrastructure activity and<br />
late recovery in monsoon<br />
aiding agri output bodes<br />
well for improvement in<br />
freight availability<br />
While infrastructure projects, especially roads are witnessing several delays, recent<br />
drive from the government to set the investment cycle rolling will help resurrecting<br />
infrastructure projects. With exclusive focus on infrastructure, the government is<br />
planning to set-<strong>up</strong> National Investment Board-a body to approve and speed <strong>up</strong> stalled<br />
infrastructure projects. While the increased focus on infrastructure and road<br />
development augurs well for demand for tippers, improved road infrastructure<br />
enhances traffic movement and drives a shift towards higher tonnage vehicles.<br />
Lastly, progressive reduction in rainfall deficit, has improved kharif sowing (hough<br />
still below normal) and improved the prospects for the rabi crop. Further, the<br />
agriculture ministry is targeting average 4% growth in the 12th 5 year Plan as against<br />
3.3% in the 11th Plan, which augurs well for CV demand from the agriculture sector.<br />
CV cycle bottoming out, expect sharp recovery in FY14<br />
We expect macroeconomic headwinds to persist in short term, resulting in continued<br />
pressure on M&HCV demand in the short term. While M&HCV volumes declined 12.5%<br />
in 1HFY13, we expect FY13 de-growth of ~5%. Our recent channel checks indicate that<br />
inventory is under control. However, expected monetary easing and resultant pick<strong>up</strong><br />
in the economic activity would drive better freight availability. This co<strong>up</strong>led with<br />
under control inventory augurs well for M&HCV demand. We expect M&HCVs to grow<br />
-5%/12% and LCVs to grow 15%/15% in FY13/14, leading to overall CV growth of 6%/<br />
14%. Anecdotal evidence suggests that recovery in M&HCV volumes are sharp,<br />
providing positive surprise to our FY14 estimates.<br />
M&HCV volumes to grow at 13.5% CAGR over FY13-FY15<br />
LCV volumes to grow at 15% CAGR over FY13-FY15<br />
Source: Company, MOSL<br />
12 November 2012<br />
6
<strong>Ashok</strong> <strong>Leyland</strong><br />
Expect <strong>Ashok</strong> <strong>Leyland</strong> to recover lost ground<br />
To outperform M&HCV industry; Dost to help gain share in LCVs<br />
• In FY12, AL lost 250bp market share, primarily led by slowdown in South India, its largest<br />
market. With activity levels picking <strong>up</strong> in the region, it is likely to recover its lost share.<br />
• Volumes will be further boosted by four new launches in the M&HCV segment (scheduled<br />
for 2HFY13) and the ramp-<strong>up</strong> of Dost.<br />
• We expect volumes to grow ~21% CAGR over FY12-14 led by ramp-<strong>up</strong> of Dost to 45,000<br />
units in FY14 and 5% CAGR in M&HCV volumes. M&HCV volume growth will be largely<br />
back-ended, driven by easing in monetary policy and new launches kick in from 2HFY13.<br />
• For AL, the management has guided 2-3% growth in M&HCV volumes and sale of ~36,000<br />
units of Dost in FY13, indicating total volume growth of 30% (v/s our estimate of 25%).<br />
While the management<br />
has guided 2-3% growth<br />
in M&HCV volumes in<br />
FY13, we have built in<br />
2.5% de-growth<br />
To outperform M&CHV industry in FY13<br />
We expect AL's M&HCV volumes to de-grow ~2.5% in FY13, against 5% de-growth for<br />
the M&HCV industry. In FY12, AL's M&HCV volumes had grown 1.1%, against industry<br />
volume growth of ~7.2%, primarily led by slowdown in its largest market of South<br />
India. Its market share declined 250bp to ~23.3% in FY12. With activity levels picking<br />
<strong>up</strong> in South India, we expect AL to recover some of its lost market share.<br />
We expect AL's overall volumes to grow 25% in FY13, led by ramp-<strong>up</strong> of Dost to 35,000<br />
units and 2.5% de-growth in M&HCVs. The management has guided total volumes of<br />
~132,000 (30% growth) in FY13, led by ramp-<strong>up</strong> of Dost volumes to 36,000 units, 2-3%<br />
growth in its domestic M&HCV volumes and export volumes of ~10,000 units (v/s<br />
~12,850 units). While M&HCV volume recovery is likely to be largely back-ended,<br />
driven by easing in monetary policy and new launches kick in from 2HFY13.<br />
AL has outperformed M&HCV industry in FY13YTD<br />
AL to partly recover lost market share in FY13, despite<br />
increasing competitive pressure<br />
Source: SIAM, MOSL<br />
12 November 2012<br />
7
<strong>Ashok</strong> <strong>Leyland</strong><br />
Revival of demand in South India to drive market share gain<br />
In FY12, AL lost 250bp market share, primarily due to slowdown in South India, its<br />
largest market. It is the dominant player in South India, holding ~51% market share. In<br />
FY12, volumes in South India were impacted by elections in Tamil Nadu, political<br />
uncertainty in Andhra Pradesh and ban on mining in Karnataka. Moreover, the impact<br />
was higher in segments where AL has greater exposure. Industry volumes for MAVs<br />
fell 17% in South India, while remaining flat across the country. The 4x2 haulage<br />
segment also de-grew by 15% in South India.<br />
AL: Trend in market share (region-wise)<br />
Source: Company, MOSL<br />
Recovery in South India<br />
led to AL's market share<br />
recovery to ~25.7% in<br />
2QFY13<br />
AL has indicated that activity levels have already begun picking <strong>up</strong> in South India,<br />
resulting in improvement in overall market share to 25.7% in 2QFY13, as against 23.3%<br />
in FY12. Also, the S<strong>up</strong>reme Court has partially lifted the ban on iron ore mining in<br />
Karnataka by allowing re-start of mining <strong>up</strong> to 25mtpa in the Bellary region and <strong>up</strong> to<br />
5mtpa in the Tumkur and Chitradurga regions. Our Metals & Mining team believes<br />
that it would take 4-6 months for mining to re-start in the region. We expect<br />
incremental volumes from South India to largely kick in from 2HFY13, resulting in<br />
partial recovery of lost market share.<br />
Four new M&HCV launches in 2HFY13 to s<strong>up</strong>port volume growth<br />
AL has lined <strong>up</strong> four new M&HCV launches for 2HFY13. It plans to introduce a) Next<br />
gen ICV vehicle, b) 10x2 30T vehicle (5 axle), c) Jan Bus (world's first front engine<br />
single-step flat floor bus), d) Neptune engine tipper, and e) 2-3 variants to Stallion<br />
vehicle on defense side. Also, it plans to launch Avia fleet of trucks in India, which are<br />
already operational in European markets. It currently manufactures the Avia range of<br />
vehicles at its Prague plant, especially for European markets. In addition to the Prague<br />
plant, it will also manufacture Avia trucks at its Pantnagar plant. Besides this, the<br />
company is also planning to launch Neptune engines. We expect these launches to<br />
s<strong>up</strong>port volumes in 2HFY13 and beyond.<br />
12 November 2012<br />
8
<strong>Ashok</strong> <strong>Leyland</strong><br />
10x2: India’s first 5 axle rigid truck Jan Bus - first bus with front engine<br />
U-3723 H - India's first 37-tonne haulage truck Avia Truck - to be manufactured at Pantnagar<br />
Dost has already<br />
garnered ~31% market<br />
share in its segment<br />
DOST - 2.5 ton LCV, from AL's JV with Nissan<br />
Source: Company, MOSL<br />
Dost - a meaningful contributor to volumes<br />
While AL holds ~25% market share in M&HCVs, it remains a small player in the LCV<br />
segment, with just 1.7% market share in FY12. However, its LCV market share will<br />
increase in FY13, led by the benefit of full year volumes and further ramp-<strong>up</strong> of its<br />
2.5-tonne LCV, Dost (produced in JV with Nissan).<br />
Dost, launched in September 2011, has shown good traction in the LCV segment,<br />
gaining ~21% market share in the 2-3.5 tonne segment. Moreover, it enjoys 31% market<br />
share in the eight markets where it was launched. The company currently has two<br />
months' order book for the vehicle, with greater demand for the higher end models.<br />
It has increased production of Dost to 100 per day and expects to sell 36,000 units in<br />
FY13. We model Dost volumes to ramp <strong>up</strong> to 35,000 in FY13 and 45,000 in FY14.<br />
Ramp <strong>up</strong> of DOST volumes<br />
12 November 2012<br />
Source: Company, MOSL<br />
9
<strong>Ashok</strong> <strong>Leyland</strong><br />
Export markets to boost volumes<br />
AL exports mainly to SAARC countries and the Middle East, and has a low presence in<br />
Latin America. Its export volumes grew 25% in FY12, led by exports to Sri Lanka,<br />
Bangladesh and Kenya, where growth remains strong. Overall, the management has<br />
guided export de-growth in FY13 to 10,000 units due to sluggiesh demand from its key<br />
markets viz Sri Lanka and Bangladesh. We estimate AL's export to grow by ~26% CAGR<br />
over FY13-15, albeit on low base of FY13 (22% de-growth).<br />
A:'s exports to grow at 26% CAGR over FY13-15<br />
Trend in AL market mix<br />
Source: Company, MOSL<br />
Volumes to grow at 17% CAGR over FY13-15, led by Dost ramp-<strong>up</strong><br />
We expect AL's overall volumes to grow at 17% CAGR over FY13-15, primarily led by<br />
ramp-<strong>up</strong> of its LCV, Dost. Our estimates factor in Dost volumes of 35,000 in FY13 and<br />
40,000 in FY14. We expect M&HCV volumes to grow at 13.5% CAGR over FY13-15.<br />
LCV's contribution<br />
estimated to grow to<br />
~32% by FY15 from<br />
~1% in FY11<br />
<strong>Ashok</strong> <strong>Leyland</strong> - Revenue Model<br />
units FY09 FY10 FY11 FY12 FY13E FY14E FY15E<br />
Commercial Vehicles<br />
M&HCV passenger (nos) 19,746 18,479 25,226 25,843 25,197 28,221 32,454<br />
Growth (%) (11.3) (6.4) 36.5 2.4 (2.5) 12.0 15.0<br />
% of total volumes 36.3 28.9 26.8 25.3 19.8 19.1 18.7<br />
M&HCV goods (nos) 33,362 44,345 68,010 67,443 65,757 73,648 84,695<br />
Growth (%) (44.6) 32.9 53.4 (0.8) (2.5) 12.0 15.0<br />
% of total volumes 61.3 69.4 72.3 66.1 51.8 49.7 48.8<br />
LCV (incl DOST) 1,323 1,097 870 8,704 36,111 46,200 56,320<br />
Growth (%) 61.1 (17.1) (20.7) 900.5 314.9 27.9 21.9<br />
% of total volumes 2.4 1.7 0.9 8.5 28.4 31.2 32.5<br />
Total Volumes (nos) 54,431 63,921 94,106 101,990 127,065 148,068 173,468<br />
Growth (%) (34.7) 17.4 47.2 8.4 24.6 16.5 17.2<br />
Mkt Sh (%) of CV 12.7 11.1 12.4 12.1 14.2 14.6 14.9<br />
Mkt Sh (%) of M&HCV 26.5 23.7 26.5 24.7 25.4 25.4 25.4<br />
Source: Company, MOSL<br />
12 November 2012<br />
10
<strong>Ashok</strong> <strong>Leyland</strong><br />
Second largest M&HCV player with focus on heavy-duty segment<br />
<strong>Ashok</strong> <strong>Leyland</strong> (AL) is the second largest M&HCV player in India, with a focus on the<br />
heavy-duty segment. In FY12, its volume composition was as follows: trucks - 59%,<br />
buses - 20%, LCVs - 8%, and exports - 13%.<br />
M&HCV: Market share concentrated among two players<br />
Market share trend in LCVs<br />
(%)<br />
FY12: Domestic M&HCV contributes ~60% to volumes<br />
AL: Higher contribution of heavy duty vehicles in M&HCV<br />
Source: Company, MOSL<br />
12 November 2012<br />
11
<strong>Ashok</strong> <strong>Leyland</strong><br />
JV with Nissan for LCVs to plug gaps in product portfolio<br />
Dost ramping <strong>up</strong>; planning two more launches<br />
• Launch of LCV, Dost by the AL-Nissan JV plugs the gap in AL's product portfolio and marks<br />
its entry into the high-growth LCV segment.<br />
• Initially, Dost is being manufactured and marketed by leveraging AL's existing infrastructure,<br />
for which AL gets manufacturing and marketing margins.<br />
• Post Dost, the JV plans to launch two more LCVs, Stile and Partner, with overall intent to<br />
launch one product every six months.<br />
Dost launch plugs gap in product portfolio; enters secular growth LCV<br />
segment<br />
Dost, launched in September 2011, has received encouraging response, gaining ~21%<br />
market share in the 2-3.5 tonne segment. Moreover, it enjoys 31% market share in the<br />
eight markets where it has been launched. The company currently has two months'<br />
order book for the vehicle, with greater demand for the higher-end models. It has<br />
increased production of Dost to 100 per day and expects to sell 36,000 units in FY13<br />
and over 50,000 in FY14. We model Dost volumes to ramp <strong>up</strong> to 35,000 in FY13 and<br />
45,000 in FY14.<br />
AL's market share in LCV<br />
segment estimated to<br />
improve to ~10% by FY15<br />
based on ramp-<strong>up</strong><br />
of just Dost<br />
While AL holds ~25% market share in M&HCVs, it was a small player in the fast growing<br />
LCV segment, with just 1.7% market share in FY12. We believe this JV plugs gaps in<br />
AL's product portfolio, as LCVs are expected to grow at a faster rate due to high<br />
acceptance of the hub-and-spoke model of logistics. We expect AL's LCV market share<br />
to increase to ~8.2% in FY13 and to ~9.1% by FY14, led by ramp-<strong>up</strong> of Dost. Our estimates<br />
doesn't factor in for any meaningful contribution from other new launches.<br />
DOST to drive AL's market share improvement in LCV segment (%)<br />
Source: Company, MOSL<br />
12 November 2012<br />
12
<strong>Ashok</strong> <strong>Leyland</strong><br />
JV currently leveraging AL's manufacturing and marketing set-<strong>up</strong>…<br />
AL entered into three JVs with Nissan for technology development, vehicle<br />
manufacturing and powertrain manufacturing. Due to the economic slowdown, the<br />
JV modified its manufacturing strategy to optimize investment, leverage surplus<br />
capacities available with its partners and make use of available incentives. AL contract<br />
manufactures Dost at its Hosur plant and also distributes it.<br />
The marketing of Dost is structured so as to optimize the sales tax benefit available to<br />
the JV. All sales within Tamil Nadu are done by the JV through AL's marketing network.<br />
Outside Tamil Nadu, sales are done directly by AL. As a result, only sales outside Tamil<br />
Nadu reflect in AL's revenue and cost; for sales within Tamil Nadu, AL only books<br />
marketing fees (part of other operating income) in its P&L.<br />
JV leverages on AL's manufacturing and distribution network<br />
Marketing of Dost is<br />
structured to optimize<br />
the sales tax benefit<br />
available to the JV<br />
Source: Company, MOSL<br />
…for which AL gets well compensated<br />
AL gets compensated for manufacturing and marketing Dost. While the exact<br />
compensation is not known, the management indicated that it would be earning<br />
INR15,000-18,000/unit of Dost on marketing (for all sales). We estimate contract<br />
manufacturing margins of ~INR25,000/unit. The management has indicated that Dost<br />
profitability is comparable with Tata Ace, which is over 20%. We expect AL to earn 11-<br />
12% margins for manufacturing and marketing, while the JV retaining ~10% margins.<br />
Effectively, Nissan (~50% stake in the JV) would be earning ~5% EBITDA margin on<br />
Dost, which can be attributed to 'royalty' for technology provided. The management<br />
expects cash breakeven for the JV at ~50,000 units i.e in 1.5 years. We are not factoring<br />
for this JV, though we include AL's gains from manufacturing and distribution.<br />
12 November 2012<br />
13
<strong>Ashok</strong> <strong>Leyland</strong><br />
Dost - AL well compensated for leveraging its manufacturing, brand and marketing assets<br />
Source: Company, MOSL<br />
Dost - first of four launches planned by the JV<br />
Dost is one of the four new launches planned by the JV. It plans to launch new vehicles<br />
every six months over the next 18 months. It would be launching two more LCVs, Stile<br />
and Partner, apart from a CNG and passenger variant of Dost. Stile, a multi-functional<br />
vehicle based on Nissan's MPV Evalia, would be launched in 2HFY13. Partner, a 6.5-<br />
tonne LCV, would be launched in FY14. While Partner would be manufactured at AL's<br />
Hosur plant, Stile (along with Evalia) will be manufactured at Nissan's plant at<br />
Oragadam, Chennai. Eventually, the JV plans to have its own manufacturing plant in<br />
Tamil Nadu. Total investment planned is INR41.5b, with phase-I investment at INR20b<br />
over FY13-15 (including INR2b invested in FY12) for setting-<strong>up</strong> ~190,000 units capacity.<br />
AL plans further equity investment of INR3.5b in the JV in FY13.<br />
The plant, which JV would be setting-<strong>up</strong>, would enjoy VAT incentive for sales within<br />
Tamil Nadu - in form of 14 year interest free sales tax loans. The management expects<br />
this incentive to be ~INR15,000/unit and is expected to be INR750m-1b annually on<br />
full ramp-<strong>up</strong> of the plant (not factored in).<br />
Stile based on Nissan Evalia<br />
Partner LCV is based on Nissan Capstar<br />
Source: Company, MOSL<br />
12 November 2012<br />
14
<strong>Ashok</strong> <strong>Leyland</strong><br />
Other JVs/investments also promising<br />
Expect contribution from FY14<br />
• AL's has entered into multiple joint ventures to diversify its portfolio, with JVs with<br />
Nissan Motors for LCVs and John-Deere for construction equipments already operational.<br />
• Further, it has also entered into smaller but niche JVs viz Irizar TVS JV (for coach building),<br />
Alteams (for high pressure die cast aluminium castings), Continental (for automotive<br />
infotronics) and investment in Albonair GmbH (for development of vehicle emission<br />
treatment / control systems).<br />
• While these JVs would not contribute meaningfully by FY13, we believe they have<br />
potential to contribute and reduce cyclicality of CVs business in long term.<br />
JV with John-Deere for construction equipment<br />
AL entered into a 50:50 JV with John-Deere (JD) to make and market construction<br />
equipment in India. The JV commenced production in November 2010 and sold ~221<br />
back-hoe loaders in FY12. It manufactures backhoes, four-wheel drive loaders and<br />
excavators. The range will subsequently be expanded to include other construction<br />
equipment. The range will complement AL's CVs used in the construction business,<br />
underscoring the synergy that exists between the two segments.<br />
The JV has a 48-acre manufacturing facility at Gummidipoondi near Chennai. JD is a<br />
leading construction equipment manufacturer and the JV will have access to JD's<br />
range of construction equipment. The JV will pool AL's expertise in the Indian<br />
automobile sector, its s<strong>up</strong>ply chain and marketing & distribution strength, and JD's<br />
technical knowhow and experience in the construction equipment business. The<br />
management expects this JV to achieve cash breakeven in two years.<br />
Break<strong>up</strong> of Construction Equipment industry<br />
Segment break-<strong>up</strong> in Earth moving equipments<br />
Equipment Contribution (%)<br />
Earth Moving Equipment 57<br />
Material Handling 13<br />
Tunneling and Drilling for mining 12<br />
Road construction equipment 7<br />
Concrete equipment 6<br />
Concrete preparation 5<br />
Source: Company, MOSL<br />
12 November 2012<br />
15
<strong>Ashok</strong> <strong>Leyland</strong><br />
JV with Alteams OY for aluminum castings<br />
AL entered into a JV with Alteams OY, which will cater to a growing market for high<br />
pressure die-cast aluminum castings for applications in automobile and telecom<br />
equipment. The state-of-the-art manufacturing facility at Cheyyar, near Kanchipuram<br />
(Tamil Nadu) was inaugurated in FY10. It has begun s<strong>up</strong>plies, meeting stringent<br />
requirements of customers in both the segments.<br />
JV with Continental AG for automobile infotronics<br />
AL formed a JV with Continental AG, which will focus on opportunities for automobile<br />
infotronics. Vehicle electronics are expected to play an increasingly important role in<br />
CVs, making them economical, safer and cleaner. The JV focuses on developing<br />
innovative solutions in vehicle electronic systems, such as instrument cluster<br />
applications, cockpit electronics and body control units for CVs and special vehicles.<br />
The JV started operations in FY10 and has been developing products and providing<br />
engineering services s<strong>up</strong>port to Continental AG.<br />
JV with Albonair GmbH for vehicle emission treatment<br />
Albonair GmbH, AL's associate company, is focused on the development of vehicle<br />
emission treatment and control systems and products. Albonair (India) was<br />
incorporated in FY10 to cater to emerging markets in China and India. It has developed<br />
the complete solution for Selective Catalytic Reduction (SCR) and Urea Dosing System<br />
(UDS) conforming to Euro 4, 5 and 6 emission standards for commercial as well as<br />
passenger vehicles.<br />
Optare Plc (subsidiary) - low floor bus specialist<br />
AL invested USD11.5m to acquire 75.1% stake in Optare, UK, for access to technology,<br />
product development and to gain entry into newer markets (especially Europe). Optare<br />
pioneered low floor double-decker buses in UK. It is also known for its innovative,<br />
weight optimized 'low carbon' range of low-floor mid-size buses as well as a modern<br />
range of city buses. Its new electric bus has already secured several orders, as more<br />
countries in Europe are promoting cleaner, greener mobility. AL's long-term objective<br />
is not only <strong>up</strong>grading it to world class standards but also to produce these high-end<br />
buses at the Indian plants, giving it a significant price advantage.<br />
Performance of JVs under pressure being in ramp-<strong>up</strong> mode<br />
FY11<br />
FY12<br />
INR m Income Exp Profit Income Exp Profit<br />
AL Nissan Vehicles 21 31 -11 1,135 1,306 -171<br />
Nissan AL Powertrain 12 15 -3 309 356 -46<br />
Nissan AL Technologies 1 103 -102 172 331 -158<br />
AL JD Construction Eqpt 1 46 -45 201 493 -293<br />
Ashley Alteams India 470 577 -107 607 714 -107<br />
Automotive Infotronics 28 5 22 29 58 -28<br />
Total 532 778 -246 2,453 3,256 -803<br />
Source: Company/MOSL<br />
12 November 2012<br />
16
<strong>Ashok</strong> <strong>Leyland</strong><br />
Auxiliary businesses, exports to lower earnings cyclicality<br />
Sales of spares, defense kits, engines less cyclical<br />
• To counter the cyclical nature of the M&HCV business, AL is focusing on enhancing<br />
contribution from businesses like LCVs, spares, defense kits and power solutions.<br />
• Sales of spare parts, including the sale of defense kits and customized vehicles to the<br />
defense factory in Jabalpur, comprise ~13.4% of revenue and are likely to post 18.6%<br />
CAGR over FY12-14.<br />
• Also, ramp-<strong>up</strong> in nascent exports would help offset the cyclicality in domestic business.<br />
Sales of spares, defense kits, engines less cyclical<br />
AL sells spare parts, including defense kits and customized vehicles to the defense<br />
factory in Jabalpur. This includes sales of Stallion trucks, Topchi tractors and buses.<br />
The spare parts segment comprised ~13.4% of revenue in FY12 (26% CAGR over FY07-<br />
12), and is likely to post 18.6% CAGR over FY12-14. AL also sells engines/gensets for<br />
commercial and industrial applications. However, its engine volumes contracted ~9%<br />
in FY11 and ~7% in FY12, led by slowdown in sales to the telecom sector. Despite<br />
lower volumes, revenue from engine and genset sales grew 2% in FY12, driven by<br />
higher realization. Engine and genset sales now contribute ~2.7% to total revenue.<br />
We expect the engine segment to post 14.7% CAGR over FY12-14, driven by business<br />
re-structuring, with reducing contribution from the telecom sector.<br />
Revenues from its LCV, Dost are likely to contribute meaningfully from FY13, led by<br />
ramp-<strong>up</strong> of volumes. We expect Dost to account for 7% of AL's net revenues in FY13<br />
and 7.7% in FY14.<br />
Trend in spare part and defence sales (INRm)<br />
Revenue contibution from LCV DOST<br />
Trend in Engine Volumes (units) Trend in Engine sales (INR m)<br />
12 November 2012<br />
17
<strong>Ashok</strong> <strong>Leyland</strong><br />
Ramp-<strong>up</strong> in exports to help counter domestic cyclicality<br />
Export potential provides opportunity to s<strong>up</strong>plement growth and offset the cyclicality<br />
in the domestic M&HCV segment. Exports contributed ~12% to AL's FY12 revenue and<br />
should grow consistently, as AL enters new markets beyond the existing SAARC and<br />
Middle East countries.<br />
AL is targeting five regions - West Asia, Africa, CIS, Asean and Latin America - to either<br />
export to or start local operations. It has appointed Mr Per Gustav Nilsson from German<br />
truck-maker MAN as Executive Director, International Operations, to spearhead its<br />
export strategy. AL can either export from India or leverage on its existing international<br />
subsidiaries like Optare (for buses) and Avia (for trucks).<br />
AL's Ras-Al-Khaimah based bus assembly plant, with initial capacity of 2,000 buses,<br />
will improve its footprint in the GCC and African markets. This plant will initially be a<br />
bus assembly unit and will later be <strong>up</strong>graded to a vehicle assembly plant (trucks and<br />
buses). Also, the new U-truck series, powered by H series (160-230 HP) and Neptune<br />
engine (<strong>up</strong> to 380 HP), will give a fillip to truck exports, as they offer higher power/<br />
tonnage ratio. The management has guided for exports to de-growth to 10,000 units<br />
in FY13 as its key markets viz Sri Lanka and Bangladesh remains weak. However,<br />
management expects the share of exports to rise to 15% over the next 2-3 years.<br />
Export contribution to increase gradually<br />
Source: Company, MOSL<br />
12 November 2012<br />
18
<strong>Ashok</strong> <strong>Leyland</strong><br />
Pantnagar ramp-<strong>up</strong>, operating leverage to s<strong>up</strong>port<br />
margins<br />
Pricing power, though, likely to remain weak<br />
• Operating leverage and ramp-<strong>up</strong> at excise/income tax exempt Pantnagar plant would<br />
offset the impact of higher discounts and increase in contribution from Dost.<br />
• Though ramp-<strong>up</strong> of Dost would have an adverse impact on EBITDA margin, it would<br />
contribute 14%/11% to PAT.<br />
• We expect EBITDA margin to improve 20bp/30bp in FY13/FY14 to 10%/10.3%. The<br />
management has guided EBITDA margin of 10% in FY13.<br />
• Softening in commodity prices could drive <strong>up</strong> margins (not yet factored in our estimates).<br />
Pantnagar plant enjoys fiscal benefits…<br />
AL's Pantnagar plant, which enjoys fiscal incentives, became operational in FY10,<br />
with initial installed capacity of 50,000 vehicles (on a two-shift basis). Capacity can be<br />
increased to 75,000 units on a three-shift basis. Ramp-<strong>up</strong> at this plant was slow, with<br />
29,000 units produced in FY12. While it has ramped-<strong>up</strong> production to a quarterly runrate<br />
of 10,000 units, due to slowdown in volumes we estimate Pantnagar's FY13<br />
production at 32,000 units (v/s management guidance of 40,000 units). As a result, we<br />
estimate Pantnagar's volume contribution (ex Dost) to increase from ~31% in FY12 to<br />
~35% in FY13 and ~37% in FY14.<br />
Production ramp-<strong>up</strong> at Pantnagar<br />
Source: Company, MOSL<br />
…further boosted by increase in excise duty<br />
Post the 2% excise duty increase in the 2012 budget, the excise benefit for the<br />
Pantnagar plant has increased to ~INR59,000/vehicle (net of excise on components).<br />
This co<strong>up</strong>led with benefit of operating leverage translates to ~60bp contribution to<br />
overall EBITDA margin in FY13, as Pantnagar would enjoy ~170bp higher margin.<br />
Inclusive of income tax savings, the overall benefit from Pantnagar amounts to<br />
~INR74,950/unit in FY13.<br />
12 November 2012<br />
19
<strong>Ashok</strong> <strong>Leyland</strong><br />
Savings due to fiscal incentives at Pantnagar (INR/Unit)<br />
Ramp-<strong>up</strong> at Panatnagar to drive margins<br />
Trend in excise duty<br />
Pantnagar plant: Income statement<br />
FY12E FY13E FY14E<br />
Volumes (units) 29,000 32,000 38,000<br />
Net sales (INR m) 41,102 47,784 57,744<br />
Net realn (INR / unit)* 1,417 1,493 1,520<br />
EBITDA (INR m) 3,721 5,303 6,808<br />
EBITDA margins (%) 9.1 11.1 11.8<br />
EBITDA (INR / unit)* 128 165 179<br />
PAT (INR m) 2,696 4,216 5,608<br />
PAT (INR / unit) 92,961 131,745 147,577<br />
Growth (%) 707.8 41.7 12.0<br />
(*'000)<br />
Source: Company, MOSL<br />
Pricing power likely to remain weak<br />
Weak economic outlook co<strong>up</strong>led with declining freight rates signals muted outlook<br />
for the industry. The slowdown has become more pronounced over the last co<strong>up</strong>le of<br />
months. To induce demand, incumbents are offering higher discounts. Pricing power<br />
of the incumbents is likely to remain weak in the short term, as demand outlook<br />
remains muted. We expect AL's EBITDA margin to improve by 20bp/30bp in FY13/FY14<br />
to 10%/10.3%.<br />
Dost - margin dilutive but EBITDA accretive<br />
The marketing of Dost is structured so as to optimize the sales tax benefit available to<br />
the JV. All sales within Tamil Nadu are done by the JV through AL's marketing network.<br />
Outside Tamil Nadu, sales are done directly by AL. As a result, only sales outside Tamil<br />
Nadu reflect in AL's revenue and cost; for sales within Tamil Nadu, AL only books<br />
marketing fees (part of other operating income) in its P&L. While Dost is margindilutive<br />
(due to inflated RM cost), it would be EBITDA and PAT accretive, with<br />
contribution of 7%/6% at EBITDA and 14%/11% at PAT level in FY13/FY14.<br />
12 November 2012<br />
20
<strong>Ashok</strong> <strong>Leyland</strong><br />
Revenue contibution from LCV DOST<br />
A meaningful contributor to profits<br />
Source: Company, MOSL<br />
Softening in commodity prices to drive margins<br />
In USD terms, international prices of key commodities used in automobile production<br />
have corrected by 5-15% QoQ in 2QFY13 (after factoring in for INR depreciation).Our<br />
estimates do not factor in any RM cost savings. Further correction in commodity prices<br />
(or INR strengthening) would provide <strong>up</strong>side risk to our EBITDA margin estimates of<br />
10%/10.3% for FY13/FY14.<br />
Trend in commodity cost (indexed)<br />
Source: Company, MOSL<br />
12 November 2012<br />
21
<strong>Ashok</strong> <strong>Leyland</strong><br />
2QFY13: Strong performance with EBITDA margin of 10.1% (+210bp QoQ)<br />
<strong>Ashok</strong> <strong>Leyland</strong>'s 2QFY13 performance was above consensus estimates. Favorable<br />
export mix (higher buses) and higher export realizations (INR depreciation) off-set<br />
increase in discounts. This co<strong>up</strong>led with cost control and Fx gain leads to EBITDA<br />
margins improvement of 210bps QoQ (-50bp YoY) at 10.1%. Key highlights include:<br />
• Volumes grew by 27%YoY (+9% QoQ) at 29,840 units. Realizations improved 1%<br />
QoQ (-16% YoY) despite product mix change in favor of LCV DOST and higher<br />
discounts due to competitive pressures & demand slowdown. Realizations<br />
increased QoQ due to a) better mix in exports (with higher buses), b) higher<br />
export realizations (INR depreciation) and c) 37% growth in spare parts sales.<br />
Hence, Net sales grew 6% YoY (+10% QoQ) to INR33b.<br />
• EBITDA margins improved by 210bp QoQ (-50bp YoY) to 10.1%, benefitting from<br />
better export mix and higher export realizations. Also, cost control (lower power<br />
cost & advertisement), operating leverage and MTM Fx gain (~INR120m) also<br />
s<strong>up</strong>ported margins. Further lower tax boosted PAT to INR1.43b, a decline of 8%<br />
YoY (+113% QoQ).<br />
• Gross Debt has increased to ~INR43b v/s INR32.6b as of Mar-12, impacted by<br />
increase in working capital to ~INR13.5b v/s INR6.9b (seasonal increase).<br />
• Earnings call highlights: 1) Management expects domestic MHCV industry to<br />
decline by 5-10% in FY13. 2) AL's MHCV volume guidance reduced to 93k units for<br />
FY13 (v/s earlier guidance of 103k units), flat YoY. 3) Guidance for Dost and Pantnagar<br />
volumes increased to 36k units (v/s earlier 32k units) and 40k units (v/s earlier 30k<br />
units) respectively, 5) Margin guidance maintained at 10% for FY13, 6) Expects<br />
competitive intensity to unchanged, 7) Increased capex (incl investment) guidance<br />
to ~INR13b (from ~INR8b earlier), and 8) Focus on working capital reduction<br />
remains (~INR7b reduction in 2QFY13).<br />
12 November 2012<br />
22
<strong>Ashok</strong> <strong>Leyland</strong><br />
Initiate coverage with Buy rating<br />
Target price of INR32 implies 34% <strong>up</strong>side<br />
• AL's operating and stock performance is highly correlated with M&HCV volumes. Expected<br />
improvement in M&HCV outlook for FY14 augurs well for AL.<br />
• Upcycle to drive 31% EPS CAGR over FY14-15, s<strong>up</strong>porting higher dividend payout.<br />
• AL, being pure play and second largest CV player in India, is the best bet to play expected<br />
improvement in CV cycle.<br />
• Key risks: (a) Significant capex restricting balance sheet deleveraging, (b) faster than<br />
expected inroads by new players, and (c) equity dilution.<br />
• Initiate coverage with Buy rating and target price of INR32 (EV of ~7.5x FY14E EBITDA).<br />
Outlook for M&HCV expected to improve, auguring well for AL<br />
AL's operating and stock performance is highly correlated with M&HCV volumes.<br />
Expected monetary easing would drive pick-<strong>up</strong> in the industrial activity, with estimated<br />
growth of ~5.3% in IIP in FY14 v/s ~1.4% in FY13. Further, improvement in infrastructure<br />
activity co<strong>up</strong>led with improvement in agriculture outlook driven by late recovery<br />
monsoon augurs well for CV demand. Improvement in freight availability would drive<br />
improvement in utilization and profitability for fleet operators, driving CV demand.<br />
CV volumes estimated to grow at 14% in FY14, with 12% M&HCV volumes and LCV<br />
volumes growing 15% in FY14. We expect AL to outperform the domestic M&HCV<br />
industry in FY13-14, its operating and stock performance would be driven by the<br />
outlook for the domestic M&HCV industry - which we believe has bottomed out and<br />
would witness recovery. AL, being pure play and second largest CV player in India, is<br />
the best bet to play expected improvement in CV cycle.<br />
AL's stock performance highly correlated with its M&HCV volumes<br />
Source: Company, MOSL<br />
Upcycle to drive 31% EPS CAGR in FY14-15, s<strong>up</strong>porting high dividend payout<br />
Based on our expectation of recovery in M&HCV cycle, we estimate 12% M&HCV<br />
volume growth and ~29% growth in Dost volumes for AL. This co<strong>up</strong>led with benign<br />
commodity prices and volume led operating leverage would drive EBITDA margin<br />
expansion of 30bp in FY14 and drive ~31% EPS growth to ~INR2.8. We expect high<br />
dividend payout to be maintained at ~45% (~INR1.25/share).<br />
12 November 2012<br />
23
<strong>Ashok</strong> <strong>Leyland</strong><br />
Initiate coverage with a Buy rating and target price of INR32<br />
The stock currently trades at 8.7x FY13E EPS of INR2.8, an EV of 6.1x FY14E EBITDA and<br />
attractive dividend yield of 4.1%. We initiate coverage with a Buy rating and target<br />
price of INR32, implying an <strong>up</strong>side of 34%. We have valued the company at an EV of<br />
7.5x FY14E EBITDA, which is in line to its 10-year average multiple of 7.4x. We believe<br />
FY14 is going to be beginning of the <strong>up</strong>cyle and hence we believe there is scope of<br />
further re-rating in the stock. Key risks: (a) Significant capex restricting balance sheet<br />
deleveraging, (b) faster than expected inroads by new players, and (c) equity dilution.<br />
<strong>Ashok</strong> <strong>Leyland</strong> EV/EBITDA band<br />
<strong>Ashok</strong> <strong>Leyland</strong> PE band<br />
Sensitivity analysis for FY14 M&HCV volumes<br />
Volume M&HCV EBITDA EPS FCF PE EV/EBITDA RoE TP @ 7x<br />
growth (%) Volumes Margins (INR) (INR B) (x) (x) (%) EV/EBITDA<br />
('000 units) (INR)<br />
-10 87,402 9.3 1.8 13.2 13.2 7.5 10.7 23.4<br />
0 93,977 9.8 2.3 13.6 10.7 6.8 12.9 27.5<br />
5 97,265 10.0 2.5 13.8 9.8 6.5 13.9 29.5<br />
12 101,868 10.3 2.8 14.0 8.7 6.1 15.3 32.3<br />
15 103,841 10.4 2.9 14.1 8.3 6.0 15.9 33.5<br />
20 107,129 10.6 3.1 14.3 7.7 5.7 16.9 35.5<br />
30 113,705 10.9 3.5 14.6 6.8 5.3 18.8 39.6<br />
Based on our volume estimates<br />
Source: Company, MOSL<br />
12 November 2012<br />
24
<strong>Ashok</strong> <strong>Leyland</strong><br />
Key Risks<br />
Significant capex plans to restrict balance sheet improvement<br />
It has increased its capex/investment plan to ~INR13b for FY13 (v/s INR8b earlier),<br />
with capex of ~INR6.5b and investment of INR6.5b in subsidiaries and JVs. It would be<br />
financing these investments through mixture of debt (~Rs7b) and internal accruals.<br />
This would restrict possible balance sheet improvement, though we estimate cash<br />
flow from operations at INR8.8b in FY13 and INR15.5b in FY14.<br />
We estimate net debt to increase to INR42.5b in FY14 (v/s INR32.3b in FY12 and INR43.7b<br />
in FY13), implying net-debt-to-equity of 0.9x. These investments would begin to add<br />
value from FY15. While the board has approved raising of INR7.5b through equity<br />
issuance, there are no immediate plans of equity issuance.<br />
Intensifying competition could materially alter duopoly structure<br />
The domestic M&HCV industry has witnessed the entry/resurgence of players like<br />
Bharat Benz, Mahindra Navistar, Volvo Eicher, MAN Trucks, etc. In the medium term,<br />
we do not expect any meaningful change in the competitive landscape, as new<br />
entrants work towards overcoming entry barriers in the form of servicing network,<br />
and relevant and cost competitive product portfolio.<br />
However, in the long run, we see a risk to the existing duopoly structure of the industry,<br />
especially as the domestic M&HCV industry evolves, driven by factors like shift towards<br />
higher tonnage vehicles, focus on <strong>up</strong>time/total cost of ownership, regulatory<br />
requirement-driven technology change, etc.<br />
12 November 2012<br />
25
<strong>Ashok</strong> <strong>Leyland</strong><br />
Snapshot of operating and financial indicators<br />
<strong>Ashok</strong> <strong>Leyland</strong> - Revenue Model<br />
FY09 FY10 FY11 FY12 FY13E FY14E FY15E<br />
Commercial Vehicles<br />
M&HCV passenger (nos) 19,746 18,479 25,226 25,843 25,197 28,221 32,454<br />
Growth (%) (11.3) (6.4) 36.5 2.4 (2.5) 12.0 15.0<br />
% of total volumes 36.3 28.9 26.8 25.3 19.8 19.1 18.7<br />
M&HCV goods (nos) 33,362 44,345 68,010 67,443 65,757 73,648 84,695<br />
Growth (%) (44.6) 32.9 53.4 (0.8) (2.5) 12.0 15.0<br />
% of total volumes 61.3 69.4 72.3 66.1 51.8 49.7 48.8<br />
LCV (incl DOST) 1,323 1,097 870 8,704 36,111 46,200 56,320<br />
Growth (%) 61.1 (17.1) (20.7) 900.5 314.9 27.9 21.9<br />
% of total volumes 2.4 1.7 0.9 8.5 28.4 31.2 32.5<br />
Total Volumes (nos) 54,431 63,921 94,106 101,990 127,065 148,068 173,468<br />
Growth (%) (34.7) 17.4 47.2 8.4 24.6 16.5 17.2<br />
Mkt Sh (%) of CV 12.7 11.1 12.4 12.1 14.2 14.6 14.9<br />
Mkt Sh (%) of M&HCV 26.5 23.7 26.5 24.7 25.4 25.4 25.4<br />
Vehicle Sales (INR m) 55,195 67,456 108,365 118,462 124,622 143,656 169,254<br />
% of total sales 81.6 84.3 88.4 85.1 83.0 83.3 84.3<br />
Engines & Spares<br />
Volumes (nos) 21,447 19,050 17,643 16,432 18,897 20,786 21,826<br />
Growth (%) 82.4 (11.2) (7.4) (6.9) 15.0 10.0 5.0<br />
Engine Sales (INR m) 4,423 3,688 3,558 3,492 4,136 4,596 4,874<br />
% of total sales 6.5 4.6 2.9 2.5 2.8 2.7 2.4<br />
Spare & Others (INR m) 7,997 8,851 10,613 17,175 21,469 24,152 26,567<br />
% of total sales 11.8 11.1 8.7 12.3 14.3 14.0 13.2<br />
Total Sales (INR m) 67,615 79,994 122,536 139,129 150,227 172,404 200,695<br />
Growth (%) (25.9) 18.3 53.2 13.5 8.0 14.8 16.4<br />
Source: Company, MOSL<br />
Realizations declined due to contribution of DOST<br />
Trend in Revenue-mix<br />
Source: Company, MOSL<br />
12 November 2012<br />
26
<strong>Ashok</strong> <strong>Leyland</strong><br />
Trend in EBITDA margins<br />
PAT estimated to grow ~31% CAGR over FY13-15<br />
Significant capex plans (including investments in JV) to restrict FCF generation and balance sheet deleveraging (INR b)<br />
Capital efficiency set to improve<br />
AL: consistent track record of high dividend payout<br />
Source: Company, MOSL<br />
12 November 2012<br />
27
<strong>Ashok</strong> <strong>Leyland</strong><br />
Financials and Valuation<br />
Income Statement<br />
(INR Million)<br />
Y/E March 2010 2011 2012 2013E 2014E 2015E<br />
Net Sales 72,447 111,771 128,420 139,232 161,566 190,726<br />
Change (%) 21.1 54.3 14.9 8.4 16.0 18.0<br />
Total Income 72,447 111,771 128,420 139,232 161,566 190,726<br />
Expenditure 64,819 99,634 115,859 125,365 144,962 171,504<br />
EBITDA 7,628 12,137 12,561 13,867 16,604 19,222<br />
% of Net Sales 10.5 10.9 9.8 10.0 10.3 10.1<br />
Depreciation 2,041 2,674 3,528 3,943 4,299 4,490<br />
EBIT 5,587 9,463 9,033 9,925 12,305 14,731<br />
Interest & Fin. Charges 811 1,889 2,553 3,646 4,036 3,851<br />
Other Income 704 445 404 560 720 900<br />
PBT 5,448 8,018 6,900 6,839 8,989 11,780<br />
Tax 1,211 1,705 1,240 1,231 1,618 2,120<br />
Effective Rate (%) 22.2 21.3 18.0 18.0 18.0 18.0<br />
Rep. PAT 4,237 6,313 5,660 5,608 7,371 9,660<br />
Change (%) 108.2 49.0 -10.3 -0.9 31.4 31.1<br />
Adjusted PAT 4,262 6,313 5,647 5,608 7,371 9,660<br />
Change (%) 109.5 48.1 -10.6 -0.7 31.4 31.1<br />
Balance Sheet<br />
(INR Million)<br />
Y/E March 2010 2011 2012 2013E 2014E 2015E<br />
Share Capital 1,330 1,330 2,661 2,661 2,661 2,661<br />
Reserves 35,357 38,299 39,421 41,937 45,443 50,466<br />
Net Worth 36,688 39,630 42,082 44,598 48,104 53,126<br />
Loans 22,039 26,733 32,630 44,130 43,130 40,130<br />
Deferred Tax Liability 4,611 4,439 4,904 5,246 5,695 6,284<br />
Capital Employed 63,213 70,802 79,657 94,015 96,971 99,582<br />
Gross Fixed Assets 60,186 66,919 72,564 82,046 86,546 89,546<br />
Less: Depreciation 17,691 20,581 23,429 27,372 31,671 36,161<br />
Net Fixed Assets 42,496 46,338 49,135 54,675 54,875 53,385<br />
Capital WIP 5,615 3,580 5,482 2,500 2,000 3,000<br />
Investments 3,262 12,300 15,345 22,345 24,845 24,845<br />
Curr.Assets, L & Adv. 41,397 43,716 49,195 55,924 63,601 75,505<br />
Inventory 16,382 22,089 22,306 24,795 28,772 33,965<br />
Sundry Debtors 10,221 11,645 12,302 14,495 15,493 18,289<br />
Cash & Bank Balances 5,189 1,795 326 422 524 1,043<br />
Loans & Advances 9,605 8,186 14,261 16,212 18,812 22,208<br />
Current Liab. & Prov. 29,608 35,131 39,501 41,428 48,351 57,153<br />
Sundry Creditors 23,317 23,085 27,725 28,609 33,199 39,190<br />
Other Liabilities 2,604 7,092 6,807 7,629 8,853 10,451<br />
Provisions 3,687 4,954 4,969 5,190 6,299 7,512<br />
Net Current Assets 11,789 8,584 9,695 14,496 15,250 18,352<br />
Application of Funds 63,213 70,802 79,657 94,015 96,971 99,582<br />
E: MOSL Estimates<br />
12 November 2012<br />
28
<strong>Ashok</strong> <strong>Leyland</strong><br />
Financials and Valuation<br />
Ratios<br />
Y/E March 2010 2011 2012 2013E 2014E 2015E<br />
Basic (INR)<br />
EPS Fully Diluted 1.6 2.4 2.1 2.1 2.8 3.6<br />
EPS Growth (%) 108.2 49.0 -10.3 -0.9 31.4 31.1<br />
Cash EPS 2.4 3.4 3.4 3.6 4.4 5.3<br />
Book Value per Share 13.8 14.9 15.8 16.8 18.1 20.0<br />
DPS 0.7 1.0 1.0 1.0 1.3 1.5<br />
Payout (Excl. Div. Tax) % 47.1 42.1 47.0 47.4 45.1 41.3<br />
Valuation (x)<br />
P/E 11.3 11.4 8.7 6.6<br />
Cash P/E 7.0 6.7 5.5 4.5<br />
EV/EBITDA 7.3 7.4 6.1 5.1<br />
Price to Book Value 1.5 1.4 1.3 1.2<br />
Dividend Yield (%) 4.1 4.1 5.2 6.2<br />
Profitability Ratios (%)<br />
RoE 11.6 15.9 13.4 12.6 15.3 18.2<br />
RoCE 10.5 14.8 12.5 12.1 13.6 15.9<br />
Turnover Ratios<br />
Debtors (Days) 51 38 35 38 35 35<br />
Inventory (Days) 83 72 63 65 65 65<br />
Creditors (Days) 117 75 79 75 75 75<br />
Fixed-Asset Turnover (x) 1.7 2.4 2.6 2.5 2.9 3.6<br />
Leverage Ratio<br />
Debt/Equity (x) 0.6 0.7 0.8 1.0 0.9 0.8<br />
Cash flow Statement<br />
(INR Million)<br />
Y/E March 2010 2011 2012 2013E 2014E 2015E<br />
OP/(Loss) before Tax 5,448 8,018 9,033 9,925 12,305 14,731<br />
Interest/Dividends Received 387 139 404 560 720 900<br />
Depreciation & Amortisation 2,041 2,674 3,528 3,943 4,299 4,490<br />
Direct Taxes Paid -893 -1,503 -775 -889 -1,169 -1,531<br />
(Inc)/Dec in Working Capital 4,339 -4,914 -2,580 -4,705 -653 -2,582<br />
CF after EO Items 11,289 6,053 9,625 8,834 15,503 16,008<br />
(Inc)/Dec in FA+CWIP -6,844 -3,501 -5,645 -6,500 -4,000 -4,000<br />
(Pur)/Sale of Invest. -1,375 -5,816 -3,045 -7,000 -2,500 0<br />
CF from Inv. Activity -8,219 -9,317 -8,690 -13,500 -6,500 -4,000<br />
Issue of Shares 0 0 1,330 0 0 0<br />
Inc/(Dec) in Debt 4,247 3,733 5,897 11,500 -1,000 -3,000<br />
Interest Rec./(Paid) -1,458 -1,542 -2,553 -3,646 -4,036 -3,851<br />
Dividends Paid -1,556 -2,327 -3,092 -3,092 -3,865 -4,638<br />
CF from Fin. Activity 1,233 -136 1,582 4,762 -8,900 -11,488<br />
Inc/(Dec) in Cash 4,303 -3,400 2,517 96 102 519<br />
Add: Beginning Balance 851 5,155 1,755 4,272 4,368 4,470<br />
Closing Balance 5,155 1,755 4,272 4,368 4,470 4,989<br />
E: MOSL Estimates<br />
12 November 2012<br />
29
Disclosures<br />
This report is for personal information of the authorized recipient and does not construe to be any investment, legal or taxation advice to you. This research report does not constitute an offer, invitation or inducement<br />
to invest in securities or other investments and <strong>Motilal</strong> <strong>Oswal</strong> Securities Limited (hereinafter referred as MOSt) is not soliciting any action based <strong>up</strong>on it. This report is not for public distribution and has been<br />
furnished to you solely for your information and should not be reproduced or redistributed to any other person in any form.<br />
Unauthorized disclosure, use, dissemination or copying (either whole or partial) of this information, is prohibited. The person accessing this information specifically agrees to exempt MOSt or any of its affiliates<br />
or employees from, any and all responsibility/liability arising from such misuse and agrees not to hold MOSt or any of its affiliates or employees responsible for any such misuse and further agrees to hold MOSt<br />
or any of its affiliates or employees free and harmless from all losses, costs, damages, expenses that may be suffered by the person accessing this information due to any errors and delays.<br />
The information contained herein is based on publicly available data or other sources believed to be reliable. While we would endeavour to <strong>up</strong>date the information herein on reasonable basis, MOSt and/or its<br />
affiliates are under no obligation to <strong>up</strong>date the information. Also there may be regulatory, compliance, or other reasons that may prevent MOSt and/or its affiliates from doing so. MOSt or any of its affiliates or<br />
employees shall not be in any way responsible and liable for any loss or damage that may arise to any person from any inadvertent error in the information contained in this report . MOSt or any of its affiliates<br />
or employees do not provide, at any time, any express or implied warranty of any kind, regarding any matter pertaining to this report, including without limitation the implied warranties of merchantability, fitness<br />
for a particular purpose, and non-infringement. The recipients of this report should rely on their own investigations.<br />
This report is intended for distribution to institutional investors. Recipients who are not institutional investors should seek advice of their independent financial advisor prior to taking any investment decision<br />
based on this report or for any necessary explanation of its contents.<br />
MOSt and/or its affiliates and/or employees may have interests/positions, financial or otherwise in the securities mentioned in this report. To enhance transparency, MOSt has incorporated a Disclosure of Interest<br />
Statement in this document. This should, however, not be treated as endorsement of the views expressed in the report.<br />
Disclosure of Interest Statement<br />
<strong>Ashok</strong> <strong>Leyland</strong><br />
1. Analyst ownership of the stock No<br />
2. Gro<strong>up</strong>/Directors ownership of the stock No<br />
3. Broking relationship with company covered No<br />
4. Investment Banking relationship with company covered No<br />
Analyst Certification<br />
The views expressed in this research report accurately reflect the personal views of the analyst(s) about the subject securities or issues, and no part of the compensation of the research analyst(s) was, is, or<br />
will be directly or indirectly related to the specific recommendations and views expressed by research analyst(s) in this report. The research analysts, strategists, or research associates principally responsible<br />
for preparation of MOSt research receive compensation based <strong>up</strong>on various factors, including quality of research, investor client feedback, stock picking, competitive factors and firm revenues.<br />
Regional Disclosures (outside India)<br />
This report is not directed or intended for distribution to or use by any person or entity resident in a state, country or any jurisdiction, where such distribution, publication, availability or use would be contrary to<br />
law, regulation or which would subject MOSt & its gro<strong>up</strong> companies to registration or licensing requirements within such jurisdictions.<br />
For U.K.<br />
This report is intended for distribution only to persons having professional experience in matters relating to investments as described in Article 19 of the Financial Services and Markets Act 2000 (Financial<br />
Promotion) Order 2005 (referred to as "investment professionals"). This document must not be acted on or relied on by persons who are not investment professionals. Any investment or investment activity to<br />
which this document relates is only available to investment professionals and will be engaged in only with such persons.<br />
For U.S.<br />
MOSt is not a registered broker-dealer in the United States (U.S.) and, therefore, is not subject to U.S. rules. In reliance on the exemption from registration provided by Rule 15a-6 of the U.S. Securities Exchange<br />
Act of 1934, as amended (the "Exchange Act") and interpretations thereof by the U.S. Securities and Exchange Commission ("SEC") in order to conduct business with Institutional Investors based in the U.S.,<br />
<strong>Motilal</strong> <strong>Oswal</strong> has entered into a chaperoning agreement with a U.S. registered broker-dealer, Marco Polo Securities Inc. ("Marco Polo"). Any business interaction pursuant to this report will have to be executed<br />
within the provisions of this Chaperoning agreement.<br />
This report is intended for distribution only to "Major Institutional Investors" as defined by Rule 15a-6(b)(4) of the Exchange Act and interpretations thereof by SEC (henceforth referred to as "major institutional<br />
investors"). This document must not be acted on or relied on by persons who are not major institutional investors. Any investment or investment activity to which this document relates is only available to major<br />
institutional investors and will be engaged in only with major institutional investors.<br />
The Research Analysts contributing to the report may not be registered /qualified as research analyst with FINRA. Such research analyst may not be associated persons of the U.S. registered broker-dealer, Marco<br />
Polo and therefore, may not be subject to NASD rule 2711 and NYSE Rule 472 restrictions on communication with a subject company, public appearances and trading securities held by a research analyst account.<br />
<strong>Motilal</strong> <strong>Oswal</strong> Securities Ltd<br />
<strong>Motilal</strong> <strong>Oswal</strong> Tower, Level 9, Sayani Road, Prabhadevi, Mumbai 400 025<br />
Phone: +91 22 3982 5500 E-mail: reports@motilaloswal.com
![Electronic Contract Note [ECN] â DECLARATION (VOLUNTARY) To ...](https://img.yumpu.com/48604692/1/158x260/electronic-contract-note-ecn-a-declaration-voluntary-to-.jpg?quality=85)