Click here - Woolworths Holdings
Click here - Woolworths Holdings
Click here - Woolworths Holdings

You also want an ePaper? Increase the reach of your titles
YUMPU automatically turns print PDFs into web optimized ePapers that Google loves.
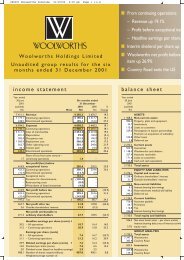
woolworths holdings limited<br />
“business unusual”<br />
• Continuation of market deterioration from October 2007<br />
• Compounded by collapse in global economy<br />
- Need to refine our positioning in the market<br />
• Significant changes in consumer behaviour<br />
- Deleveraging<br />
- Realignment of needs back to necessities<br />
- Trading down<br />
• Our customers hit the hardest<br />
- Holding quality and innovation but shifting opening price points and cutting costs
woolworths holdings limited<br />
review of the period<br />
• <strong>Woolworths</strong> Retail<br />
- Sales growth below expectations<br />
- Repositioning of opening price points<br />
- Clothing and General merchandise<br />
• Underestimated demand for value<br />
and core product<br />
• Improved margin<br />
• Good stock control<br />
- Food<br />
• Value lines performed well<br />
12mma market share<br />
Clothing and<br />
footwear<br />
Food<br />
(per RLC) (per Nielsen)<br />
Dec 2006 15.3% 8.9%<br />
Dec 2007 15.4% 9.3%<br />
Dec 2008 14.7% 88% 8.8%<br />
- Excellent expense control
woolworths holdings limited<br />
review of the period (continued)<br />
• Country Road<br />
- Business repositioned<br />
- Excellent sales performance in tough trading conditions<br />
- Record profit growth<br />
- Becoming a material profit contributor<br />
• Financial Services<br />
- Successful implementation of ABSA JV – attitude shift<br />
- Bad debts well controlled<br />
• Strong balance sheet
woolworths holdings limited<br />
financial i overview<br />
• Retail turnover up 8.1% to R10.5 billion<br />
• Profit before tax and exceptional items up 18.1% to R878 million<br />
• Effective tax rate decreased from 36.9% to 32.9% (excluding STC on special dividend)<br />
• Diluted headline earnings per share up 11.5% to 62.0 cps<br />
• Adjusted headline earnings per share up 26.9%<br />
• Interim dividend to shareholders increased to 31.5 cps<br />
• ROE increased from 27.8% to 29.6%
woolworths holdings limited<br />
group income statement<br />
Dec 2008<br />
Rm<br />
Dec 2007<br />
Rm<br />
%<br />
change<br />
SA Retail 635.4 611.8 3.9<br />
Country Road 90.9 48.2 88.6<br />
Financial Services 119.6 71.77 66.8<br />
Q1 – 100% subsidiary 92.2<br />
Q2 – JV (after tax) 27.4<br />
Net group interest 32.4 11.9 >100<br />
Profit before exceptional item 878.3 743.6 18.1<br />
Exceptional item 380.0 -<br />
Profit before tax 1 258.3 743.6 69.2<br />
Tax 364.33 274.44 32.8<br />
Profit after tax 894.0 469.2 90.5<br />
Effective tax rate<br />
(excluding STC on special<br />
dividend)<br />
32.9% 36.9%
woolworths holdings limited<br />
group income statement commentary<br />
1. Financial Services – consolidated in Q1 and equity accounted in Q2 (see separate slide)<br />
2. Net group interest – net group interest excludes WFS, and is earned on excess cash (net of remaining<br />
term borrowings) after the 1 October disposal of a controlling interest in WFS (which is no longer<br />
consolidated)<br />
3. Exceptional item – the profit on disposal of the controlling interest in WFS (proceeds R875m, net value of<br />
equity disposed R447m, costs R48m)<br />
4. Taxation – Excluding STC on this year’s special dividend, the effective rate has reduced from 36.9% to<br />
32.9%. The main reasons are the 1% reduction in the rate of normal tax, and the impact of the JV share of<br />
profit, which is already taxed.
woolworths holdings limited<br />
SA retail income statement<br />
Dec 2008<br />
Rm<br />
Dec 2007<br />
Rm<br />
%<br />
change<br />
Revenue 9 384.9 8 913.8 5.3<br />
Turnover 9 338.1 8 867.6 5.3<br />
Cost of sales* 6 779.2 6 363.1 6.5<br />
Gross profit 2 558.9 2 504.5 2.2<br />
Other revenue 46.8 46.2 1.3<br />
Expenses 1 970.3 1 938.9 1.6<br />
Store costs 1 267.3 1 139.2 11.2<br />
Other operating costs 703.0 799.7 (12.1)<br />
Profit before tax 635.4 611.8 3.9<br />
Gross margin - on turnover 27.4% 28.2%<br />
Operating margin - on revenue 6.8% 6.9%<br />
Return on equity 49.1% 56.5% 5%<br />
* Cost of sales now includes distribution costs (previously in expenses) – 2007 restated
woolworths holdings limited<br />
SA retail income statement commentary<br />
1. Turnover Total Comparable stores<br />
Clothing and GM (0.6%) (4.1%)<br />
Food 9.5% 0.3%<br />
Total 5.3% (1.6%)<br />
2. Gross profit – 0.8% drop in margin due to margin pressures in Food, offset by higher margin in Clothing.<br />
Margin now includes Food distribution costs and the prior period has been restated.<br />
3. Expenses – Store costs were well controlled and in line with the store plan. Other costs were tightly<br />
controlled. Disclosure has changed due to the exclusion of distribution ib i costs.<br />
4. Operating margin – maintained due to tight expense control<br />
5. ROE – remains good
woolworths holdings limited<br />
country road income statement<br />
Dec 2008 Dec 2007 %<br />
A$m<br />
A$m change<br />
Revenue 178.77 146.44 22.1<br />
Turnover 177.7 145.7 22.0<br />
-Retail 130.0 110.0 18.2<br />
- Concession 41.8 35.7 17.1<br />
- Wholesale 59 5.9 -<br />
Cost of sales 70.1 56.9 23.2<br />
Gross profit 107.6 88.8 21.2<br />
Other revenue 1.0 0.7 42.9<br />
Expenses 93.8 81.4 15.2<br />
Operating profit 14.8 8.1 82.7<br />
Finance costs 0.1 0.1 -<br />
Profit before tax 14.7 8.0 83.8<br />
Average exchange rate (R/A$) 6.8 6.1<br />
Profit before tax (Rm) 90.9 48.2<br />
Gross margin - on turnover 60.6% 60.9%<br />
Operating margin - on revenue 8.3% 5.5%<br />
Return on equity (A$) 25.4% 16.0%
woolworths holdings limited<br />
country road commentary<br />
1. Turnover Total Comparable stores<br />
Retail 18.2% 12.8%<br />
Concession 17.1% 11.1%<br />
2. Gross profit – well controlled margins<br />
3. Expenses – well controlled, but impacted by the accounting for long-term incentives<br />
4. Operating margin – getting near the 10% goal<br />
5. ROE – improved to 25.4% due to increased profitability
woolworths holdings limited<br />
financial i services income statement<br />
Dec 2008<br />
Rm<br />
% to<br />
book<br />
Dec 2007<br />
Rm<br />
% to<br />
book<br />
%<br />
change<br />
Interest income 752.5 26.2 651.4 22.9 15.5<br />
Interest paid 308.1 10.7 241.2 8.5 27.7<br />
Net interest income 444.4 15.5 410.2 14.4 8.3<br />
Impairment charge 210.2 7.3 261.2 9.2 (19.5)<br />
Risk-adjusted margin 234.2 8.2 149.0 5.2 57.2<br />
Non-interest revenue 191.0 6.6 141.5 5.0 35.0<br />
Operating costs* 257.5 9.0 218.8 7.7 17.7<br />
Profit before tax (before<br />
deduction of ABSA share) 167.7 5.8 71.7 2.5 >100<br />
Average financial services assets 5 746.9 5 668.9 1.4<br />
Return on equity 12.5% 6.0%<br />
* Change in allocation methodology of retail costs to WFS at year end - 2007 restated
woolworths holdings limited<br />
financial i services commentary<br />
1. Gross financial services assets – fairly static, in line with sales growth in <strong>Woolworths</strong> and tighter NCA<br />
requirements. This is the biggest challenge in this business. Note that no longer carried on WHL balance<br />
sheet.<br />
2. Interest income – increased yields due to higher average interest rates<br />
3. Interest paid – increased due to higher average rates and greater gearing of JV<br />
4. Impairment charge – bad debts tightly managed and improved book shape in store card and personal loans<br />
5. Non-interest revenue – benefit of NCA-related charges<br />
6. Operating costs – well controlled, and have invested in extra collections resources<br />
7. ROE – improved mainly due to lower impairment charge and higher NIR
woolworths holdings limited<br />
financial i services book performance<br />
Store Card<br />
Personal Loans<br />
VISA Card<br />
4 000<br />
3 500<br />
3 000<br />
2 500<br />
2 000<br />
1 500<br />
1 000<br />
500<br />
-<br />
3 618<br />
3 801<br />
6.6% 6.9%<br />
1 585 1 560<br />
Dec-07<br />
Dec-08<br />
14% 4 000<br />
12% 3 500<br />
10%<br />
3 000<br />
2 500<br />
8%<br />
2 000 5.1% 5.0%<br />
6%<br />
1 500<br />
4%<br />
1 064 1 045<br />
1 000<br />
2% 500<br />
186 182<br />
0% -<br />
Dec-07<br />
Dec-08<br />
14% 4 000<br />
12% 3 500<br />
13.5%<br />
10%<br />
3 000<br />
2 500<br />
10.9%<br />
8%<br />
2 000<br />
6%<br />
1 500 1 026 1 034<br />
4%<br />
1 000<br />
2% 500<br />
168 158<br />
0% -<br />
Dec-07<br />
Dec-08<br />
14%<br />
12%<br />
10%<br />
8%<br />
6%<br />
4%<br />
2%<br />
0%<br />
Gross book value (Rm) Number of customers (000's) Net bad debt * (%)<br />
* 6mma excluding cost of recoveries, and calculated based on billing book data
woolworths holdings limited<br />
financial i services review<br />
• JV has gone well<br />
• Benefit from implementing Barclays/ABSA policies and aligning provisioning<br />
• Trading is in line with expectations<br />
• Bad debts remain stable, particularly with store card and personal loans, but remain a<br />
concern in VISA book<br />
• Challenge is growth in card sales
woolworths holdings limited<br />
bl balance sheet<br />
Dec 2008<br />
Rm<br />
Dec 2007<br />
Rm<br />
%<br />
change<br />
Assets<br />
Property, plant and equipment,<br />
intangible assets, loans and other<br />
2 393.9 2 216.1 8.0<br />
assets<br />
Investment in WFS JV 503.33 -<br />
Inventory 1 551.8 1 473.2 5.3<br />
Financial services assets - 5 558.7<br />
Accounts receivable and deferred tax 1 558.2 1 324.6 17.6<br />
Cash 2 913.2 866.9 >100<br />
8 920.4 11 439.5 (22.0)<br />
Equity and liabilities<br />
Shareholders’ funds 3 274.3 3 417.9 (4.2)<br />
Accounts payable 4 146.11 3 605.00 15.0<br />
Borrowings 1 500.0 4 416.6 (66.0)<br />
8 920.4 11 439.5 (22.0)<br />
• Strong balance sheet<br />
• Moderate growth in assets
woolworths holdings limited<br />
bl balance sheet commentary<br />
1. Property, plant and equipment – grown in line with capex (refer to investment slide)<br />
2. Investment in WFS JV – represents our equity in the JV (minimum 8%)<br />
3. Inventory – was well managed in both Country Road and South Africa, with lower stock levels and lower<br />
provisioning required<br />
4. Cash and borrowings – cash proceeds from sale of WFS business. See cash flow statement and cash<br />
generation slide.
woolworths holdings limited<br />
cash generation<br />
4 500<br />
4 000<br />
R3 697m<br />
3 500<br />
3 000<br />
2 500<br />
(R750m)<br />
(R153m)<br />
2 000<br />
1 500<br />
R1 151m<br />
1 000<br />
500<br />
0<br />
EBITDA<br />
(R26m)<br />
Working<br />
capital and<br />
similar<br />
movements<br />
(R225m)<br />
(R102m)<br />
(R285m)<br />
(R410m)<br />
Interest paid Tax Net capex Dividends<br />
paid<br />
Cash flow<br />
from WFS<br />
disposal<br />
Special<br />
dividend<br />
Share<br />
repurchase
woolworths holdings limited<br />
investment in the business<br />
Capex (Rm)<br />
R294.7m (Dec 07: R362.0m)<br />
115.3<br />
36.6<br />
210.1<br />
61.8<br />
84.2<br />
148.7<br />
Dec 2007<br />
Dec 2008<br />
Retail IT Other (including property)<br />
• Increase in IT includes residual investment in data warehouse and IPEX
woolworths holdings limited<br />
return on equity<br />
40%<br />
35%<br />
30%<br />
25%<br />
20%<br />
15%<br />
10%<br />
5%<br />
17.5%<br />
12.3%<br />
33.5% 34.8% 35.1%<br />
37.5%<br />
24.7% 27.4% 27.6% 27.8% 29.6%<br />
18.3%<br />
16.3% 13.8% 13.8%<br />
11.3% 11.8% 13.3% 14.8% 12.5% 13.2%<br />
14.5%<br />
0%<br />
Jun-01 Jun-02 Jun-03 Jun-04 Jun-05 Jun-06 Jun-07 Jun-08 Dec-06 Dec-07 Dec-08<br />
ROE<br />
WACC
woolworths holdings limited<br />
earnings and dividendid d<br />
cps<br />
times<br />
70<br />
60<br />
50<br />
2.5<br />
2.2<br />
2.2<br />
19 1.9<br />
20 2.0<br />
3.0<br />
2.5<br />
2.0<br />
40<br />
30<br />
20<br />
46.7<br />
53.1<br />
64.4<br />
56.9<br />
62.8<br />
1.5<br />
1.0<br />
10<br />
0<br />
18.5 24.0 29.5 29.5 31.5<br />
2004 2005 2006 2007 2008<br />
HEPS DPS Dividend cover<br />
0.5<br />
-
woolworths holdings limited<br />
outlook<br />
• Inflationary ypressures in Clothing due to currency. Inflationary ypressures in Food will<br />
continue in Q3, then ease<br />
• Sales growth will remain muted<br />
• Retail gross margin to be held at current level<br />
• Tight control of costs to continue<br />
• Certain WFS related benefits in H1 will not be repeated in H2<br />
• Capex planned FY2009 FY2010<br />
- SA Retail R650m R550m<br />
- Country Road R150m R145m<br />
• Continue cautious share repurchase<br />
• Trading space growth in <strong>Woolworths</strong> to slow
woolworths holdings limited<br />
SA retail – store growth<br />
Growth to<br />
Dec 2008<br />
(12 mths)<br />
Projected<br />
growth to<br />
Jun 2009<br />
(6 mths)<br />
Projected<br />
growth to<br />
Jun 2010<br />
(12 mths)<br />
Number of stores<br />
Corporate stores<br />
Full-line 8 6 11<br />
Food standalone 20 4 8<br />
Trading space<br />
Corporate stores<br />
Clothing and General merchandise 4.9% 3.3% 7.9%<br />
Food 14.7% 4.4% 10.5%
woolworths holdings limited<br />
retail turnover<br />
Clothing and General merchandise<br />
Food<br />
30%<br />
25%<br />
20%<br />
15%<br />
10%<br />
5%<br />
0%<br />
-5%<br />
14.4%<br />
12.6%<br />
10.9% 9.8%<br />
8.4% 8.2%<br />
7.3%<br />
4.7%<br />
-0.6%<br />
-4.1%<br />
Dec-04 Dec-05 Dec-06 Dec-07 Dec-08<br />
30%<br />
25%<br />
20%<br />
15%<br />
10%<br />
5%<br />
0%<br />
-5%<br />
25.9%<br />
20.6% 20.9%<br />
18.8% 8%<br />
12.8% 12.2%<br />
15.1%<br />
9.7% 9.5%<br />
0.3%<br />
Dec-04 Dec-05 Dec-06 Dec-07 Dec-08<br />
Comparable growth Sales growth Comparable growth Sales growth
woolworths holdings limited<br />
retail overview<br />
• Clothing Cot and General merchandise<br />
- Under bought and oversold on value and core products<br />
- Womenswear – overall disappointing performance – swimwear, activewear, Twist and<br />
Re traded well<br />
- Menswear – focus on essentials, success of SuperSport<br />
- Childrenswear – excellent growth – demand more than anticipated on core<br />
- Homeware – poor performance<br />
- Beauty – great performance of colour and fragrance – private label impacted by<br />
continuity of supply<br />
- Margin improvement and tight control of stock
woolworths holdings limited<br />
retail overview (continued)<br />
• Food<br />
- Repositioned pricing<br />
- Continue to drive the <strong>Woolworths</strong> difference<br />
- Benefit of promotions<br />
- Availability and waste improving – remain a challenge<br />
- Impact of change in product mix – price movement less than inflation<br />
• Stores<br />
- Excellent expense control through productivity gains<br />
- Service levels maintained<br />
- Impact of strike
woolworths holdings limited<br />
dii driving implementation<br />
i<br />
• 2007/2008<br />
- Understanding the business<br />
- Planning new processes, procedures and strategies<br />
• 2008/2009<br />
- Re-organisation<br />
- More consistent and disciplined ways of working<br />
- Talent recruitment and development<br />
- Control<br />
• 2009/2010<br />
- Implementation<br />
- Sourcing – margin improvement<br />
- Quality:value equation
woolworths holdings limited<br />
woolworths retail – dli deliverables<br />
Timelines<br />
Progress<br />
1. Customer understanding ongoing<br />
2. Quality : Value ongoing<br />
g<br />
3. Range differentiation and innovation complete<br />
4. Improved availability Summer 09<br />
5. Talent upgrade / skills base complete<br />
6. Greater speed to market in Clothing and GM Winter/Summer 10<br />
7. Improved productivity Winter/Summer 10
woolworths holdings limited<br />
1. customer – the relationship journey<br />
Retail strategy<br />
Loyalty relationship<br />
<strong>Woolworths</strong>: the shop<br />
Lifestyle segmentation<br />
CLOTHING FOOD BEAUTY HOME WFS<br />
HEADQUARTER ASSORTMENTS<br />
DESTINATION FOR SPECIAL OCCASIONS<br />
GOOD-BUSINESS JOURNEY MILESTONES<br />
CONNECT<br />
UNIQUE, FRESH & MODERN STORE EXPERIENCE<br />
BE FAMOUS FOR SERVICE – GET OUR PEOPLE EXCITED AGAIN<br />
Great Special Offers<br />
VALUE TIERING<br />
Outstanding Value Product Differentiation<br />
Store clustering<br />
Store format –<br />
w<strong>here</strong> does she shop?<br />
40m 2<br />
Engen<br />
ToGo 120m 2<br />
Micro (small) 260m 2<br />
Local (medium) 385m 2<br />
Supermarket (large) 800m 2<br />
Wext/Resort 900m 2<br />
Home & Food/Clothing only 2,140/1,390m 2<br />
Small 1,800m 2<br />
Medium 3,000m 2<br />
Large 4,000m 2<br />
Best Bett ter Good<br />
Budget<br />
Families<br />
Classic Modern Contemporary<br />
Mr<br />
Practical<br />
Comfy<br />
Conserv’s<br />
Finest Cross<br />
Shoppers<br />
Kids<br />
Come First<br />
All About<br />
Me<br />
9 box grid –<br />
what do we buy?<br />
Flagship 6,200m 2
woolworths holdings limited<br />
2. quality:value l – Clothing<br />
Clothing pricing<br />
% price movement FY2009 FY2008<br />
1 st half 0.0% 9.6%<br />
2 nd half 7.3%<br />
• Customer buying more value items<br />
• Held prices - improved margin<br />
• Summer 25 value lines - 86% sell through and sold 3.1m units, a 40% increase – underbought<br />
• Value without compromising quality
03-Dec-08<br />
woolworths holdings limited<br />
2. quality:value l – Food<br />
12%<br />
10%<br />
8%<br />
6%<br />
4%<br />
2%<br />
0%<br />
-2%<br />
-4%<br />
-6%<br />
Promotions started<br />
12-Mar-08<br />
26-Mar-08<br />
09-Apr-08<br />
23-Apr-08<br />
07-May-08<br />
21-May-08<br />
04-Jun-08<br />
18-Jun-08<br />
02-Jul-08<br />
16-Jul-08<br />
30-Jul-08<br />
13-Aug-08<br />
27-Aug-08<br />
10-Sep-08<br />
24-Sep-08<br />
08-Oct-08<br />
22-Oct-08<br />
05-Nov-08<br />
19-Nov-08<br />
Premium to Store A Premium to Store B Premium to Store C<br />
• Price repositioning changing customer perception<br />
• Now competitively priced<br />
• Quality remains key
woolworths holdings limited<br />
2. quality:value l – Food<br />
Comparable Food sales - weekly increase<br />
30%<br />
25%<br />
20%<br />
15%<br />
10%<br />
5%<br />
0%<br />
-5%<br />
-10%<br />
-15%<br />
Promotions started<br />
Jan-08 Apr-08 Jul-08 Oct-08 Jan-09<br />
Weekly increase<br />
10 week average
woolworths holdings limited<br />
3. range differentiation i i – segmentation in womenswear<br />
Best<br />
Classic<br />
Modern<br />
Contemporary<br />
SA<br />
Designers<br />
Modern<br />
Better<br />
classic collection<br />
<strong>Woolworths</strong><br />
headquarters assortments<br />
Good<br />
classic collection<br />
Modern<br />
• Process implemented across all product groups<br />
• Embedded d in stores
woolworths holdings limited<br />
3. innovation i – Food<br />
• Four clear pillars<br />
Everyday<br />
Gastronomic<br />
Reasons to<br />
Health<br />
the difference<br />
adventure celebrate<br />
• Continued re-engineering for innovation and value<br />
- 824 new lines launched from Jul – Dec 08 (LY: 543)<br />
- 444 lines upgraded from Jul – Dec 08 (LY: 413)<br />
• Innovation key to <strong>Woolworths</strong> difference
woolworths holdings limited<br />
3. great new product launches: Organics
woolworths holdings limited<br />
3. great new product launches: Cooks Essentials
woolworths holdings limited<br />
3. great new product launches: Earth Friendly range
woolworths holdings limited<br />
4. improved availability<br />
• Clothing<br />
- Sizing an issue<br />
- New cluster work to align merchandise with customer profile<br />
- Demand increase in value and core products – underestimated in Summer 08<br />
• Food<br />
- Forecasting system shifted from bottom up to top down<br />
• Store location forecasting<br />
• Product group forecasting<br />
- Focus on major lines<br />
- Store catalogue to customer profile<br />
- Significant improvement by Summer 09
woolworths holdings limited<br />
5. talent upgrade / skill base<br />
• Key people in place pac<br />
- New head of product development in Food<br />
- New Director of Stores<br />
- New design talent<br />
• Continuous upskilling<br />
- Merchant academy for buying and planning - now includes supplier component and<br />
focus on back to basics<br />
- Food and Store academy
woolworths holdings limited<br />
6. speed to market in Clothing and General merchandise<br />
• Sourcing strategy update<br />
- 6 months into 3 year plan<br />
- Well on track<br />
- Continuous review of supplier base locally and overseas to drive best quality,<br />
technology and value<br />
- Intake margin improving
woolworths holdings limited<br />
7. improved productivity<br />
i<br />
• Improve productivity<br />
- Expense control<br />
• Real estate - format<br />
- Shift to fewer bigger stores<br />
- 14 modernisations this year<br />
• Clothing and Home cluster strategy<br />
- Stock efficiency<br />
- Alignment of customer, store and stock profile<br />
• Delivery of new Clothing and Home range planning<br />
- Project on track<br />
- Improved planning for Winter 09<br />
- Better allocations
woolworths holdings limited<br />
trading in tough times<br />
• Focus on value and quality whilst strengthening innovation<br />
• Improve availability<br />
• Utilise customer information to drive promotions and store catalogue<br />
• Continue to manage stock tightly<br />
• Improve margin<br />
• Continue to manage cost growth<br />
• Looking after our people<br />
• No change in the Retail strategy
woolworths holdings limited<br />
country road – review<br />
• Repositioning o<br />
has worked<br />
- Prices down 40% over 3 years<br />
- Volumes up well over 100%<br />
• Growing profit contributor<br />
• Strategic opportunity<br />
- Both Country Road (modern) and Trenery (classic) have very good long-term growth<br />
opportunities in South Africa and Australia<br />
- Integration of Country Road into <strong>Woolworths</strong> is strengthening<br />
• 15 new Country Road stores within <strong>Woolworths</strong> in H2<br />
• Launch of Trenery brand in 26 <strong>Woolworths</strong> stores in August
woolworths holdings limited<br />
country road – outlook<br />
• Australian economy expected to slow further in H2<br />
• Bold long-term plans but very tight short-term management
woolworths holdings limited<br />
outlook<br />
• Environment unpredictable<br />
• South Africa and Australia are intrinsic long-term growth economies<br />
• Big shift in consumer spending to value<br />
- Both <strong>Woolworths</strong> and Country Road can provide excellent value for money offer<br />
within our quality ethos<br />
• Our positioning – no shift!<br />
- Maintain quality<br />
- Drive innovation and the difference<br />
- Continue success on opening prices
woolworths holdings limited<br />
group income statement<br />
Dec 2008<br />
Rm<br />
Dec 2007<br />
Rm<br />
%<br />
change<br />
Revenue 11 134.6 10 557.1 5.5<br />
Turnover 10 547.7 9 756.5 8.1<br />
Cost of sales* 7 258.9 6 706.9 8.2<br />
Gross profit 3 288.8 3 049.6 7.8<br />
Other revenue 586.9 800.6 (26.7)<br />
Expenses 2 829.6 2 864.44 (1.2)<br />
Operating profit 1 046.1 985.8 6.1<br />
Finance costs 195.2 242.2 (19.4)<br />
Earnings from JV 27.4 -<br />
Profit before exceptional item 878.3 743.6 18.11<br />
Exceptional item 380.0 -<br />
Profit before tax 1 258.3 743.6 69.2<br />
Tax 364.3 274.4 32.8<br />
Profit after tax 894.0 469.2 90.5<br />
Gross margin - on turnover 31.2% 31.3%<br />
Operating margin - on revenue 9.4% 9.3%<br />
Effective tax rate on profit before 32.9% 36.9%<br />
exceptional item<br />
(excluding STC on special dividend)<br />
* Cost of sales now includes distribution costs (previously in expenses) – 2007 restated
woolworths holdings limited<br />
SA retail – bl balance sheet<br />
Assets<br />
Dec 2008 Dec 2007<br />
%<br />
Rm Rm change<br />
Property, plant and equipment, investments,<br />
deferred tax, loans and goodwill 2 051.3 2 544.7 (19.4)<br />
Inventory 1 323.8 1 273.7 3.9<br />
Accounts receivable 1 433.8 571.2 >100<br />
Cash 376.6 441.4 (16.7)<br />
5 176.5 4 831.0 7.2<br />
Equity and liabilities<br />
Shareholders’ funds 1 398.2 1 585.2 (11.8)<br />
Accounts payable, provisions and tax 3 778.3 3 245.8 16.4<br />
5 176.5 4 831.0 7.2
woolworths holdings limited<br />
SA retail – revenue analysis<br />
Dec 2008 Dec 2007 % %<br />
Rm<br />
Rm change price<br />
movement<br />
Clothing and General merchandise 3 691.5 3 714.5 (0.6) 0.0<br />
Corporate (retail) 3 228.0 3 251.8 (0.1)<br />
Franchise (wholesale) – local 358.55 349.6 (3.5)<br />
Franchise (wholesale) – international 105.0 113.1 (6.7)<br />
Food 5 449.8 4 977.4 9.5 9.0<br />
Corporate (retail) 4 996.7 4 604.8 8.5<br />
Franchise (wholesale) – local 418.7 346.9 20.7<br />
Franchise (wholesale) – international 34.4 25.7 33.9<br />
Logistics and other 196.8 175.7 12.0<br />
Other revenue 46.8 46.2 1.3<br />
9 384.9 8 913.8 5.3
woolworths holdings limited<br />
SA retail – trading space<br />
Dec 2008<br />
Dec 2007<br />
%<br />
m2 m2 change<br />
Projected<br />
Jun 2009<br />
m2<br />
%<br />
change<br />
(6 mths)<br />
Projected<br />
Jun 2010 %<br />
m2 change<br />
Total footage 499 888 466 693 7.1 514 749 3.0 551 778 7.2<br />
Clothing and<br />
General merchandise 359 321 343 837 4.5 368 278 2.5 391 183 6.2<br />
Corporate 270 752 258 077 4.9 279 709 3.3 301 849 7.9<br />
Franchise SA 61 097 56 331 85 8.5 61 097 - 61 862 13 1.3<br />
Franchise Intnl 27 472 29 429 (6.6) 27 472 - 27 472 -<br />
Food 140 567 122 856 14.4 146 471 4.2 160 595 9.6<br />
Corporate 128 248 111 793 14.7 133 928 44 4.4 148 052 10.5<br />
Franchise SA 10 325 8 679 19.0 10 549 2.2 10 549 -<br />
Franchise Intnl 1 994 2 384 (16.4) 1 994 - 1 994 -
woolworths holdings limited<br />
SA retail – number of stores<br />
As at<br />
Dec 2008<br />
No.<br />
As at<br />
Dec 2007<br />
No.<br />
Growth<br />
(12 mths)<br />
No.<br />
Projected<br />
growth to<br />
Jun 2009<br />
(6 mths)<br />
No.<br />
Projected<br />
growth to<br />
Jun 2010<br />
(12 mths)<br />
No.<br />
Total stores 407 372 35 17 27<br />
Corporate 244 216 28 10 19<br />
Full-line 113 104 9 6 11<br />
Clothing and<br />
General merchandise 5 6 (1) - -<br />
Food 126 106 20 4 8<br />
Franchise SA 80 77 3 - 1<br />
Franchise Engen 42 36 6 7 7<br />
Franchise International 41 43 (2) - -
woolworths holdings limited<br />
financial i services – contribution i to sales<br />
% of sales spent on <strong>Woolworths</strong> cards Dec 2008 Dec 2007<br />
Clothing and General merchandise 35.2% 39.4%<br />
Food 18.9% 22.0%<br />
Total 25.6% 29.7%
woolworths holdings limited<br />
country road – bl balance sheet<br />
Dec 2008<br />
A$m<br />
Dec 2007<br />
A$m<br />
%<br />
change<br />
Assets<br />
Property, plant and equipment 42.3 34.3 23.3<br />
Trademarks * 11.2 11.2<br />
-<br />
Inventory 34.1 32.5 4.9<br />
Accounts receivable 27.5 13.2 >100<br />
Cash 31.6 18.7 69.0<br />
146.7 109.9 33.5<br />
Equity and liabilities<br />
Shareholders’ funds 91.7 70.8 29.5<br />
Accounts payable and provisions 55.0 39.1 40.7<br />
146.7 109.9 33.5<br />
Period-end exchange rate (R/A$) 6.7 6.1<br />
* Eliminates on consolidation
woolworths holdings limited<br />
country road – income statement (in rands)<br />
Dec 2008<br />
Rm<br />
Dec 2007<br />
Rm<br />
%<br />
change<br />
Revenue 1 212.2 884.4 37.1<br />
Turnover 1 205.6 880.1 37.0<br />
Cost of sales 479.7 343.7 39.6<br />
Gross profit 725.9 536.4 35.3<br />
Other revenue 6.6 4.3 53.5<br />
Expenses 641.3 491.9 30.4<br />
Store costs 453.8 366.9 23.7<br />
Other operating costs 187.5 125.0 50.0<br />
Operating profit 91.2 48.8 86.9<br />
Finance costs 0.3 0.6 (50.0)<br />
Profit before tax 90.9 48.2 88.6