Annual Report & Accounts - Countrywide Farmers
Annual Report & Accounts - Countrywide Farmers
Annual Report & Accounts - Countrywide Farmers

You also want an ePaper? Increase the reach of your titles
YUMPU automatically turns print PDFs into web optimized ePapers that Google loves.
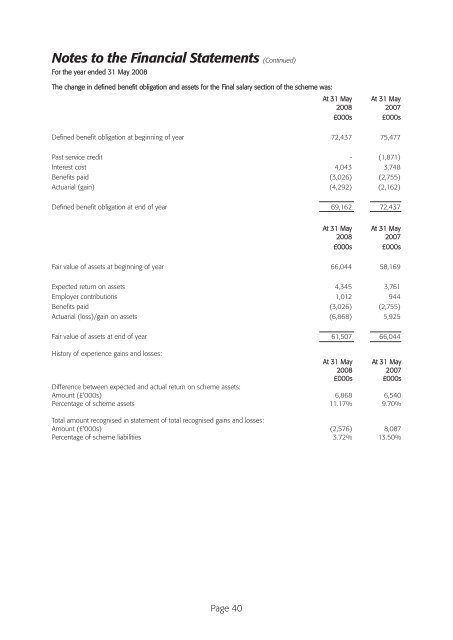
Notes to the Financial Statements (Continued)<br />
For the year ended 31 May 2008<br />
The change in defined benefit obligation and assets for the Final salary section of the scheme was:<br />
At 31 May<br />
2008<br />
At 31 May<br />
2007<br />
£000s £000s<br />
Defined benefit obligation at beginning of year 72,437 75,477<br />
Past service credit - (1,871)<br />
Interest cost 4,043 3,748<br />
Benefits paid (3,026) (2,755)<br />
Actuarial (gain) (4,292) (2,162)<br />
Defined benefit obligation at end of year 69,162 72,437<br />
At 31 May<br />
2008<br />
At 31 May<br />
2007<br />
£000s £000s<br />
Fair value of assets at beginning of year 66,044 58,169<br />
Expected return on assets 4,345 3,761<br />
Employer contributions 1,012 944<br />
Benefits paid (3,026) (2,755)<br />
Actuarial (loss)/gain on assets (6,868) 5,925<br />
Fair value of assets at end of year 61,507 66,044<br />
History of experience gains and losses:<br />
At 31 May<br />
2008<br />
At 31 May<br />
2007<br />
£000s £000s<br />
Difference between expected and actual return on scheme assets:<br />
Amount (£'000s) 6,868 6,540<br />
Percentage of scheme assets 11.17% 9.70%<br />
Total amount recognised in statement of total recognised gains and losses:<br />
Amount (£'000s) (2,576) 8,087<br />
Percentage of scheme liabilities 3.72% 13.50%<br />
Page 40