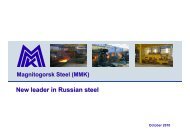
MMK Growth Prospects - Magnitogorsk Iron & Steel Works
MMK Growth Prospects - Magnitogorsk Iron & Steel Works
MMK Growth Prospects - Magnitogorsk Iron & Steel Works

Create successful ePaper yourself
Turn your PDF publications into a flip-book with our unique Google optimized e-Paper software.
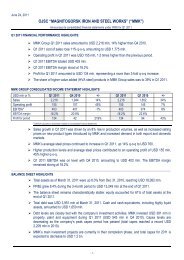
<strong>Magnitogorsk</strong> <strong>Steel</strong> (<strong>MMK</strong>)<br />
June 2011
Global <strong>Steel</strong> Industry Highlights<br />
World <strong>Steel</strong> Production, mln tonnes<br />
Finished <strong>Steel</strong> Production/Consumption in China, mln tonnes<br />
1 000<br />
750<br />
500<br />
250<br />
0<br />
656<br />
787 810<br />
574<br />
627<br />
ROW<br />
China<br />
2009 2010 2011Е<br />
685<br />
800<br />
700<br />
600<br />
500<br />
400<br />
300<br />
200<br />
100<br />
0<br />
-100<br />
632<br />
657 677 680 685 690<br />
602 620 630 639 649<br />
576<br />
573<br />
535<br />
-24 -24 -25 -26 -27 -28 -29<br />
2009 2010 2011E 2012E 2013E 2014E 2015E<br />
Production Consumption Export<br />
Source: WSA, Nomura<br />
World <strong>Steel</strong> Consumption, mln tonnes<br />
Apparent <strong>Steel</strong> Consumption <strong>Growth</strong>, % y-on-y<br />
1 500<br />
1 400<br />
1 300<br />
1 200<br />
1 100<br />
World steel consumption<br />
continues to grow<br />
1 215 1 207<br />
1 119<br />
15%<br />
1 284<br />
6%<br />
1 359<br />
6%<br />
1 441<br />
40%<br />
35%<br />
30%<br />
25%<br />
20%<br />
15%<br />
10%<br />
5%<br />
38%<br />
33%<br />
10% 11%<br />
10%<br />
7%<br />
Russian market demonstrates the<br />
highest growth rates<br />
24%<br />
6% 7% 6%<br />
5% 4%<br />
5% 5% 4%<br />
1 000<br />
2007 2008 2009 2010 2011E 2012E<br />
0%<br />
Russia NAFTA EU-27 China Middle East<br />
2010 2011E 2012E<br />
Source: WSA<br />
Source: WSA, Nomura<br />
2
Russian <strong>Steel</strong> Dynamics<br />
<strong>Steel</strong> Consumption in Russia and Export, mln tonnes<br />
Russian Import Structure, mln tonnes<br />
80<br />
60<br />
40<br />
20<br />
0<br />
30,0<br />
3,2<br />
10,4<br />
13,7<br />
27,3<br />
4,0<br />
13,7<br />
30,1<br />
4,4<br />
15,1<br />
32,9<br />
16,5<br />
19,8 21,9 24,0<br />
2009 2010 2011E 2012E<br />
Flat steel Long steel Other steel products Export<br />
4,8<br />
7<br />
6<br />
5<br />
4<br />
3<br />
2<br />
1<br />
2,7<br />
1,7<br />
1,9<br />
0,6<br />
0,7<br />
0,5<br />
1,3<br />
0,9<br />
1,0<br />
0,4 0,3<br />
0,3<br />
0,9 1,2 1,2<br />
Russia sees solid import<br />
volumes, mostly of HVA<br />
products<br />
1,0<br />
0,4<br />
0,9<br />
0,2<br />
0,8<br />
HVA products<br />
2,0<br />
1,8<br />
1,7<br />
0,8<br />
0,8<br />
0,7<br />
1,0<br />
1,2<br />
1,3<br />
0,4 0,4 0,5<br />
1,4 1,5 1,6<br />
0<br />
2006 2007 2008 2009 2010 2011E 2012E<br />
Coated products C/r products Thick plate H/r products Long products<br />
Source: Metal Expert<br />
BOF Shop<br />
Source: Metal Courrier<br />
Domestic Flat <strong>Steel</strong> Consumption, mln tonnes<br />
24,0<br />
25<br />
21,9<br />
0,2<br />
19,8<br />
0,2<br />
2,7<br />
20<br />
0,2<br />
2,5<br />
3,2<br />
2,3<br />
13,7<br />
2,9<br />
15<br />
2,6<br />
0,1<br />
8,6<br />
2,2<br />
7,7<br />
1,4<br />
6,7<br />
10<br />
4,9<br />
5<br />
5,1<br />
8,0 8,5 9,3<br />
0<br />
2009 2010 2011E 2012E<br />
Construction Pipe plants Machinery Coating and metalwork Other<br />
Source: Metal Expert<br />
3
Jan 09<br />
Feb 09<br />
Mar 09<br />
Apr 09<br />
May 09<br />
Jun 09<br />
Jul 09<br />
Aug 09<br />
Sep 09<br />
Oct 09<br />
Nov 09<br />
Dec 09<br />
Jan 10<br />
Feb 10<br />
Mar 10<br />
Apr 10<br />
May 10<br />
Jun 10<br />
Jul 10<br />
Aug 10<br />
Sep 10<br />
Oct 10<br />
Nov 10<br />
Dec 10<br />
Jan 11<br />
Feb 11<br />
Mar 11<br />
Apr 11<br />
May 11<br />
Jun 11<br />
Russian Market <strong>Growth</strong> <strong>Prospects</strong><br />
Domestic <strong>Steel</strong> Price Dynamics, USD/tonne<br />
Russian <strong>Steel</strong> Consumption by Industry, mln tonnes<br />
1 200<br />
1 000<br />
800<br />
600<br />
400<br />
Re-bar H/r Flat <strong>Steel</strong> C/r Flat <strong>Steel</strong> Galvanized steel<br />
12,0<br />
10,0<br />
8,0<br />
6,0<br />
4,0<br />
2,0<br />
0,0<br />
11,0<br />
10,4<br />
9,1<br />
6,1 6,2<br />
9,4<br />
8,6<br />
7,8<br />
2,8<br />
2,5<br />
2,1<br />
1,1<br />
<strong>Steel</strong> consumption by major<br />
industries is bound to grow<br />
by 20% on average<br />
3,2<br />
2,9<br />
2,6<br />
2,2<br />
Pipe making Construction Machine building Metalware<br />
(incl. car-makers)<br />
2009 2010 2011E 2012E<br />
1,4<br />
1,3<br />
1,2<br />
0,9<br />
Bridge&Ship<br />
building<br />
Source: Metal Torg<br />
Capacities Utilization in Russia, %<br />
100%<br />
90%<br />
80%<br />
70%<br />
Source: Metal Courrier<br />
<strong>MMK</strong> Finished Products Output, th. tonnes<br />
1 000<br />
800<br />
600<br />
400<br />
60%<br />
50%<br />
Pipe-making hits 100% utilization rate<br />
2001 2002 2003 2004 2005 2006 2007 2008 2009 2010<br />
200<br />
0<br />
Source: Chermet<br />
Cast <strong>Iron</strong> Crude <strong>Steel</strong> Rolled <strong>Steel</strong> <strong>Steel</strong> Pipes<br />
Source: <strong>MMK</strong><br />
4
<strong>MMK</strong> – Russian <strong>Steel</strong> Leader<br />
Largest single-site steelmaker in Russia with current crude steel capacity of 14 mln tonnes<br />
Currently planned production growth of more than 70% by 2017 (45% by 2013) from 2010<br />
Production of HVA products currently expected to almost double by 2013 from 2010, representing 45% share of<br />
total production volumes<br />
Import substitution strategy: favorable geographical location to meet strong demand from the most intensive steel<br />
consuming regions of Russia – the Urals and Volga regions<br />
Great play on Russian infrastructure:<br />
• 17.7% domestic steel market share enables <strong>MMK</strong> to benefit from premium pricing for domestic sales<br />
• Largest exposure to pipe-manufacturing, auto-building and heavy machinery<br />
Disciplined investment strategy with priority given to investments in high-return projects and high-quality assets<br />
investments approach<br />
The most modern asset base – over USD 7 bn of investments over the last 4 years<br />
Mill 5000 Shop Mill 5000 Galvanizing Line<br />
5
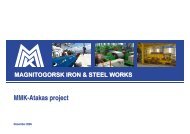
ММК Geography<br />
Interkos-IV<br />
Metals service center<br />
and stamped-product<br />
factory with 250 th.<br />
tpy capacity.<br />
69%<br />
Profit<br />
Covers 100% of <strong>MMK</strong><br />
scrap needs.<br />
Belon<br />
Prioskolsky GОК<br />
Largest iron-ore<br />
deposit, more than 2<br />
bn tonnes of reserves.<br />
6%<br />
15%<br />
6%<br />
4.2 mln tonnes of<br />
coking coal mined in<br />
2010. Covers 50% of<br />
<strong>MMK</strong> needs.<br />
ММК Metiz<br />
<strong>MMK</strong> (Turkey)<br />
2.3 mln tpy capacity<br />
by 2012.<br />
<strong>Steel</strong> making complex<br />
and two service<br />
centers.<br />
ММК trading house<br />
Profit’s scrap collecting yards<br />
% Share of <strong>MMK</strong> shipments,<br />
mln tonnes<br />
1%<br />
High-priority (domestic)<br />
Priority (export)<br />
Other (export)<br />
ММК (2010)<br />
№1 by rolled products output in Russia<br />
11.4 mln tonnes of steel<br />
10.2 mln tonnes of finished products in Russia<br />
Markets<br />
<strong>MMK</strong> benefits from a central location,<br />
with proximity to Russian industrial<br />
heartland and proximity to export<br />
markets<br />
CAGR (2010-15) = 6.7%<br />
CAGR (2010-15) = 5.5%<br />
CAGR (2010-15) = 5.0%<br />
One of Russia’s<br />
largest hardware<br />
producers.<br />
450 th. tonnes<br />
produced in 2010.<br />
ENRC<br />
Currently <strong>MMK</strong>’s main<br />
iron-ore supplier.<br />
Long-term agreement<br />
with ММК (until 2017).<br />
Fortescue MG<br />
ММК controls 5%<br />
оf Fortescue Metals<br />
Group, one of<br />
Australia's largest<br />
iron-ore producers.<br />
Source: <strong>MMK</strong><br />
6
<strong>MMK</strong> <strong>Growth</strong> <strong>Prospects</strong><br />
Product Structure Dynamics, %<br />
Crude <strong>Steel</strong> <strong>Growth</strong> Drivers, th. tonnes<br />
100%<br />
80%<br />
60%<br />
40%<br />
20%<br />
0%<br />
11% 10% 12% 13% 13% 14% 14%<br />
58% 51% 50% 47% 45% 42% 41%<br />
5%<br />
13% 14% 14% 14% 13%<br />
15%<br />
12% 10% 9% 11% 11% 13%<br />
9%<br />
13% 14% 13% 17% 18% 19% 19%<br />
2009 2010 2011E 2012E 2013Е 2014Е 2015Е<br />
Downstream products Flat cold-rolled products Thick plate (Mill 5000)<br />
Flat hot-rolled products Long products Slabs and billets<br />
20 000<br />
18 542<br />
15 000<br />
11 419<br />
10 000<br />
5 000<br />
0<br />
2010 2011E 2012E 2013E 2014Е 2015Е 2016Е 2017Е<br />
ММК, currently run capacities <strong>MMK</strong>, upside on current capacities <strong>MMK</strong>, new capacities <strong>MMK</strong>-Turkey<br />
Sourсe: <strong>MMK</strong><br />
Finished <strong>Steel</strong> Products Structure Evolution, th. tonnes<br />
Sourсe: <strong>MMK</strong><br />
EBITDA per ton of Finished <strong>Steel</strong> Products, USD<br />
18 000<br />
16 000<br />
14 000<br />
12 000<br />
10 000<br />
8 000<br />
6 000<br />
4 000<br />
2 000<br />
0<br />
70% output growth by 2017<br />
HVA share ≈ 45% by 2013<br />
8 831<br />
34 %<br />
45 %<br />
17 282<br />
2009 2010 2011E 2012E 2013E 2014Е 2015Е 2016E 2017E<br />
<strong>MMK</strong> <strong>MMK</strong> (Turkey) HVA products<br />
300<br />
250<br />
200<br />
150<br />
100<br />
50<br />
0<br />
118<br />
Long steel<br />
91 95<br />
HR flat<br />
steel<br />
CR flat<br />
steel<br />
EBITDA/t (LHS)<br />
HVA (Higher Value-Added products)<br />
156<br />
Mill 5000<br />
plate<br />
228 236<br />
Galvanized<br />
steel<br />
Formed<br />
sections<br />
EBITDA margin (RHS)<br />
272<br />
Colour -<br />
coated steel<br />
35%<br />
30%<br />
25%<br />
20%<br />
15%<br />
10%<br />
5%<br />
0%<br />
Sourсe: <strong>MMK</strong><br />
Sourсe: <strong>MMK</strong>, 2010<br />
7
<strong>MMK</strong> <strong>Growth</strong> <strong>Prospects</strong><br />
Russian Import / Export Balance, th. tonnes<br />
<strong>MMK</strong> <strong>Growth</strong> in RF by Product Type vs. Import Structure, th. tonnes<br />
2 000<br />
1 000<br />
0<br />
-1 000<br />
-2 000<br />
-3 000<br />
-4 000<br />
-5 000<br />
-6 000<br />
-7 000<br />
-5 381<br />
-5 932<br />
-6 496<br />
-1 583<br />
-1 746<br />
-1 911<br />
453<br />
500 547<br />
995 1 097 1 202<br />
Hot-rolled steel Long product Thick plate Coated steel<br />
Russia remains net exporter of ordinary steel,<br />
while shortage of HVA products persists<br />
2010 2011E 2012E<br />
7 000<br />
6 000<br />
5 000<br />
4 000<br />
3 000<br />
2 000<br />
1 000<br />
0<br />
214<br />
323<br />
288<br />
1 839<br />
752<br />
1 157<br />
415<br />
1 495<br />
Expected imports<br />
provide more than<br />
enough room for<br />
<strong>MMK</strong> HVA output<br />
growth<br />
435<br />
370<br />
211<br />
283<br />
2 014<br />
823<br />
1 266<br />
455<br />
1 638<br />
ММК 2011Е Import 2011Е ММК 2012Е Import 2012Е<br />
(growth to 2010)<br />
(growth to 2010)<br />
Coated steel Cold-rolled steel Thick plate Hot-rolled steel Long product<br />
Source: Metal Expert, <strong>MMK</strong><br />
Source: Metal Expert<br />
<strong>MMK</strong> Production Portfolio Change y-on-y, th. tonnes <strong>MMK</strong> Share in Russian Production, %<br />
12500<br />
27<br />
12000<br />
221<br />
149<br />
82<br />
11500<br />
458<br />
11000<br />
66<br />
239<br />
214<br />
323<br />
10500<br />
288<br />
10000<br />
2011Е<br />
2012Е<br />
Coated steel Cold-rolled steel Thick plate Hot-rolled steel Long product Other<br />
50%<br />
40%<br />
30%<br />
20%<br />
10%<br />
0%<br />
11%<br />
7% 8%<br />
41%<br />
40%<br />
32%<br />
Dominating position on the Russian<br />
market<br />
32%<br />
34%<br />
29%<br />
31%<br />
26%<br />
22%<br />
34%<br />
32%<br />
51%<br />
Long steel H/r steel Thick plate C/r steel Coated steel<br />
2010 2011E 2012E<br />
Source: <strong>MMK</strong><br />
Source: <strong>MMK</strong><br />
8
Competitive Cost Position (Continued)<br />
Integration in Coking Coal, mln tonnes<br />
Integration in <strong>Iron</strong> Ore, th. tonnes<br />
7<br />
6<br />
5<br />
4<br />
3<br />
2<br />
1<br />
0<br />
Coal concentrate production to grow by<br />
6,2<br />
more than 50% by 2017 compared to 2010<br />
-19<br />
5,1 5,1<br />
4,6<br />
4,5<br />
4,2<br />
3,9 3,9 3,9<br />
3,6<br />
3,7 3,7<br />
3,4<br />
3,0<br />
2,7 2,8 2,8<br />
2,5<br />
2009 2010 2011Е 2012Е 2013Е 2014Е 2015Е 2016E 2017E<br />
Coking coal production<br />
Concentrate production<br />
6 000<br />
4 000<br />
2 000<br />
0<br />
<strong>Iron</strong> ore mined to grow by more than<br />
25% by 2013 compared to 2010<br />
2008 2009 2010 2011E 2012E 2013E<br />
M. Kuibas Podotvalnoe Slag Processing Sosnovskoe Bakal<br />
Sourсe: <strong>MMK</strong><br />
Self-sufficiency Level, %<br />
100%<br />
75%<br />
50%<br />
25%<br />
0%<br />
Sourсe: <strong>MMK</strong><br />
70%<br />
30%<br />
ENRC<br />
<strong>MMK</strong><br />
50%<br />
10%<br />
40%<br />
SBU<br />
RASP<br />
<strong>MMK</strong><br />
(Belon)<br />
100%<br />
<strong>MMK</strong><br />
(Profit)<br />
25%<br />
75%<br />
<strong>Iron</strong> ore Coal Scrap Electricity<br />
Own<br />
Purchased<br />
Federal<br />
Grid<br />
<strong>MMK</strong><br />
Sourсe: <strong>MMK</strong><br />
Prioskolsky <strong>Iron</strong> Ore Deposit Development Project<br />
• 2006 - purchase of the license for Prioskol iron ore<br />
deposit development;<br />
• One of the largest iron-ore deposits – more than 2 bn<br />
tonnes of reserves;<br />
• Pre-feasibility study performed by HATCH;<br />
• Projected capacity – up to 50 mtpa of iron ore;<br />
• >100% <strong>MMK</strong> needs in iron ore covered;<br />
• Optional iron ore supplies to <strong>MMK</strong>-Atakas.<br />
Sourсe: <strong>MMK</strong><br />
9
Leading Positions in the Russian <strong>Steel</strong> Industry<br />
Leader in Finished <strong>Steel</strong> Production, th. tonnes <strong>MMK</strong> Share of Russian <strong>Steel</strong> Market, %<br />
12 000<br />
11 000<br />
10 000<br />
<strong>MMK</strong> retains leadership in Russia<br />
while drastically changing its<br />
product mix<br />
NKMK; 2,3%<br />
Others; 19,5%<br />
ММК; 17,7%<br />
Severstal;<br />
17,5%<br />
9 000<br />
8 000<br />
Chelyabinsk<br />
MK; 5,4%<br />
NLMK; 16,2%<br />
7 000<br />
1999 2000 2001 2002 2003 2004 2005 2006 2007 2008 2009 2010<br />
ММК Severstal NLMK<br />
NTMK; 7,2%<br />
ZSMK; 9,5%<br />
Urals <strong>Steel</strong>;<br />
4,5%<br />
Source: Company data, Nomura, CS Source: ММК, Metal Courier, 2010<br />
Diversified Product Mix<br />
Leading Position on Domestic Market<br />
Picture<br />
Long products: 1.1 mln tonnes (10%)<br />
<strong>MMK</strong>'s share<br />
in Russia<br />
Share in <strong>MMK</strong>'s<br />
total production<br />
Place in<br />
Russia<br />
Picture<br />
Picture<br />
Picture<br />
Hot-rolled sheet: 5.5 mln tonnes (54%)<br />
Plate (mill 5000): 0.9 mln tonnes (9%)<br />
Cold-rolled sheet: 1.1 mln tonnes (11%)<br />
Downstream: 1.4 mln tonnes (14%)<br />
Hot-rolled sheet 37% 63% 1<br />
Cold-rolled sheet 22% 11% 3<br />
Galvanized flat products 27% 6% 1<br />
Cold-rolled narrow strip 50% 1% 1<br />
Tin plate 100% 2% 1<br />
Colour-coated rolled products 25% 2% 3<br />
Source: ММК, 2010<br />
Source: ММК, Metal Courier<br />
10
<strong>MMK</strong>’s Dominating Domestic Market Position<br />
<strong>MMK</strong> Domestic and Export Sales, mln tonnes Domestic Sales Structure, 2010<br />
8<br />
7<br />
6<br />
5<br />
4<br />
3<br />
2<br />
3,7<br />
2,1<br />
Source: <strong>MMK</strong><br />
<strong>MMK</strong> organically grows its share in<br />
Russian market as demand in export<br />
markets remains sustainable<br />
1996 1998 2000 2002 2004 2006 2008 2010<br />
Domestic market (Russia + CIS)<br />
Coated &<br />
Downstream<br />
products<br />
19%<br />
Source: <strong>MMK</strong><br />
C/r steel<br />
11%<br />
HVA<br />
Products,<br />
43%<br />
Thick plate<br />
13%<br />
Domestic Sales by Region, 2010 Domestic Sales by Sector, 2010<br />
7,3<br />
4,9<br />
Export<br />
7,0<br />
3,2<br />
H/r steel<br />
43%<br />
Long steel<br />
products<br />
14%<br />
Total: 7,044 kt<br />
<strong>MMK</strong> is located in most intensive<br />
steel consuming region of Russia<br />
Food industry;<br />
1%<br />
Automobile<br />
sector; 6%<br />
Fuel and<br />
energy<br />
companies;<br />
0,37%<br />
Bridge<br />
building;<br />
0,34%<br />
Pipe<br />
production;<br />
34%<br />
Metalware and<br />
semiintegrated<br />
factories; 9%<br />
Spot sales in<br />
Russia; 16%<br />
Machine<br />
building; 13%<br />
Construction<br />
sector; 11%<br />
Spot sales in<br />
CIS; 10%<br />
Total: 7,044 kt<br />
Source: <strong>MMK</strong><br />
Source: <strong>MMK</strong><br />
11
Strong Presence on Export Markets<br />
Share of Export Sales in Shipments, % Export Sales Structure, 2010<br />
100%<br />
75%<br />
46% 41% 39% 34%<br />
28%<br />
36% 31%<br />
Long products<br />
2%<br />
Slabs and<br />
billets<br />
6%<br />
50%<br />
25%<br />
0%<br />
Source: ММК<br />
54% 59% 61% 66%<br />
72%<br />
64% 69%<br />
2004 2005 2006 2007 2008 2009 2010<br />
Domestic Exports<br />
Downstream<br />
products<br />
2%<br />
Source: ММК<br />
Cold-rolled<br />
steel<br />
11%<br />
Domestic Price Premium, USD/tonne Regional Sales Structure, 2010<br />
Hot-rolled steel<br />
79%<br />
Total: 3,201 kt<br />
250<br />
225<br />
200<br />
225<br />
190<br />
Americas<br />
3%<br />
Africa<br />
1%<br />
175<br />
150<br />
125<br />
100<br />
75<br />
50<br />
78<br />
162<br />
150 156<br />
158<br />
Domestic price premium makes Russian market<br />
attractive. Q1 2011 domestic market price<br />
premium equaled to 227 USD/t<br />
2004 2005 2006 2007 2008 2009 2010<br />
Europe<br />
6%<br />
Far East &<br />
Asia<br />
6%<br />
Middle East<br />
15%<br />
Russia &CIS<br />
69%<br />
Total: 10,245 kt<br />
Source: <strong>MMK</strong><br />
Source: ММК<br />
12
Building Value<br />
<strong>MMK</strong> (TURKEY)<br />
Investments<br />
Market<br />
Profile<br />
USD 2.1 bn<br />
Middle East, EU, Africa<br />
state-of-the-art full-cycle steel<br />
production<br />
Capacity, mtpy finished steel 2.3<br />
Product types<br />
Rationale<br />
<strong>MMK</strong>’s investment approach is…<br />
HRC, galvanized, colour-coated<br />
increase presence in key export<br />
regions<br />
geographical diversification<br />
Mill 5000 (RUSSIA)<br />
CAPEX<br />
Market<br />
Profile<br />
USD 1.5 bn<br />
Russian oil&gas infrastructure, ship and<br />
bridge building<br />
HVA rolling facilities<br />
Capacity, mtpy finished steel 1.5<br />
Product types<br />
Rationale<br />
Heavy plates up to x120 strength class<br />
#1 supplier to pipe sector<br />
imports replacement<br />
FOCUSED<br />
STRENGTHENING LEADERSHIP<br />
BEATING THE CYCLE<br />
ENJOYING STATE SUPPORT<br />
WELL - THOUGHT OUT<br />
VALUE - ADDING<br />
CREATING SYNERGIES<br />
TARGETTING KEY MARKETS<br />
CONSISTENT<br />
HIGH RETURN RATE<br />
Belon (RUSSIA)<br />
Acquisition cost<br />
USD 0.543 bn<br />
Market<br />
Russia<br />
Profile<br />
growing producer of high-quality coal<br />
Capacity, mtpy coking coal 4.2 in 2010, 6.2 by 2017<br />
Rationale<br />
Vertical integration and higher profitability<br />
Mill 2000 (RUSSIA)<br />
CAPEX<br />
Market<br />
Profile<br />
USD 1.5 bn<br />
Russia, EU, automotive industry,<br />
construction, white goods production<br />
HVA rolling facilities<br />
Capacity, mtpy finished steel 2<br />
Product types<br />
Rationale<br />
CR galvanized high strength steel<br />
#1 supplier to automotive sector, imports<br />
replacement<br />
13
Plate Mill 5000<br />
ММК is one of 10 producers of premium quality thick plates globally<br />
Specifications<br />
Start-up 2009<br />
Capacity, mln tpy 1,5<br />
Max Plate Width, mm up to 4,800<br />
Plate Length, m 24<br />
Plate Thickness, mm 8-160<br />
Rolling force, tonnes 12 000<br />
Strength class<br />
up to Х120<br />
• Project completion time under SMS Demag contract - 32 months<br />
• November 2007 – May 2009: construction of the mill<br />
• July 2009: first production start up<br />
• December 2009: launch of Continuous Slab Caster # 6<br />
• February 2010: launch of secondary steel-treatment complex<br />
Use of Thick Plate in Russia by Sector, th. tonnes<br />
LDP<br />
Bridge building<br />
6 000 Boiler building<br />
Ship building<br />
Other<br />
<strong>MMK</strong> market share (RHS)<br />
4 000<br />
2 000<br />
0<br />
2008 2009 2010 2011Е 2012Е 2013Е 2014Е 2015Е<br />
Source: pipe-producers’ estimates, ММК<br />
Consumers of Mill 5,000 Products<br />
120%<br />
90%<br />
60%<br />
30%<br />
0%<br />
Agreements with major customers<br />
• Cooperation agreement with Gazprom<br />
• Strategic cooperation agreement with TMK<br />
• Cooperation agreement with ChTPZ<br />
• Government suggested pipemakers to reduce share of imported<br />
plate<br />
14
Mill 5000 - Strengthening Positions in Pipe Sector<br />
<strong>Growth</strong> in LDP Consumption in Russia, th. tonnes Key <strong>Steel</strong> Suppliers to Pipe-builders in Russia, 2010<br />
4 000<br />
3 000<br />
Demand for LDP remains<br />
strong<br />
<strong>MMK</strong> produces 43% of<br />
steel, used for pipe-making<br />
in Russia<br />
<strong>MMK</strong>; 43%<br />
2 000<br />
1 000<br />
0<br />
Other; 39%<br />
-1 000<br />
Production of LDP<br />
LDP exports<br />
LDP imports<br />
Consumption of LDP in Russia<br />
Import; 18%<br />
Source: pipe-producers’ estimates, <strong>MMK</strong><br />
Use of LDP Produced in Russia by Project, th. tonnes<br />
3 500<br />
3 000<br />
2 500<br />
2 000<br />
1 500<br />
1 000<br />
500<br />
0<br />
3 400<br />
3 025<br />
1 882<br />
2009 2010 2011Е<br />
Nord Stream<br />
Yamal-Europe<br />
Sakhalin-Khabarovsk-Vladivostok<br />
VSTO-2<br />
BTS-2<br />
Current pipelines replacement<br />
Export<br />
Source: pipe-producers’ estimates, <strong>MMK</strong><br />
Source: <strong>MMK</strong><br />
Geography of Main Pipelines<br />
Nord Stream<br />
BTS-2<br />
Yamal-Europe*<br />
Russia<br />
* - Incl. Pochinki-Gryazovets and Bovanenkovo-Uhta<br />
<strong>MMK</strong> steel is used in<br />
construction of all pipelines<br />
VSTO-2<br />
Sakhalin-Khabarovsk-Vladivostok<br />
15
Strengthening Position in Auto Industry<br />
Mill 2,000 Complex<br />
Private Car Ownership, vehicles per 1,000 people<br />
Key Mill 2,000 specifications<br />
Capacity, th. tpa 2,000<br />
Sheet width, mm 850-1,880<br />
800<br />
700<br />
600<br />
765<br />
565<br />
519<br />
Russia is on the way to<br />
diminish the lag to<br />
developed countries<br />
Sheet thickness, mm 0.28 – 3.0<br />
HSLA, IF, HSS, BH, DP, CP,<br />
<strong>Steel</strong> grades<br />
ТRIP<br />
Production volumes:<br />
• 700,000 tpy of galvanized steel annealed<br />
• 400,000 tpy cold-rolled (after annealing) products<br />
• 900,000 tpy unannealed products<br />
Key customers:<br />
• Car-makers, White goods producers<br />
500<br />
400<br />
300<br />
200<br />
100<br />
0<br />
Source: UNO, 2010<br />
426<br />
399<br />
261<br />
156<br />
67<br />
12 10<br />
Russian Vehicle Fleet by Age, %<br />
Mill 2000 Construction<br />
more than 20<br />
yrs; 23%<br />
less than 10 yrs;<br />
44%<br />
more than 10<br />
yrs; 33%<br />
Source: Rosstat, 2010<br />
16
Mill 2000 Cold Rolled <strong>Steel</strong> Complex<br />
Russian Cold-rolled Automotive <strong>Steel</strong> Consumption, % Car-making Projects in Russia by 2015E, %<br />
100%<br />
75%<br />
50%<br />
2%<br />
7%<br />
17%<br />
75%<br />
25%<br />
3%<br />
22%<br />
24%<br />
49%<br />
10%<br />
40%<br />
10%<br />
60%<br />
13%<br />
12%<br />
Volga federal region<br />
North-west federal<br />
region<br />
Central federal region<br />
25%<br />
0%<br />
High strength steel<br />
types to reach 60% in<br />
overall consumption<br />
51%<br />
40%<br />
2010 2015Е 2020Е<br />
Mild <strong>Steel</strong> AHSS HSS UHSS<br />
15%<br />
60%<br />
Other<br />
Source: <strong>MMK</strong> estimates<br />
High Strength <strong>Steel</strong>s Use<br />
Source: <strong>MMK</strong> estimates<br />
Russian Car-makers <strong>Steel</strong> Consumption<br />
HSS<br />
44.5%<br />
Mild <strong>Steel</strong><br />
30.8%<br />
4 000<br />
3 000<br />
<strong>Steel</strong> consumption to reach 2.7 mln tonnes by<br />
2012 and more than double by 2020 from 2010<br />
4 240<br />
3 678<br />
2 000<br />
1 824<br />
1 400<br />
AHSS<br />
15.6%<br />
UHSS<br />
9.1%<br />
1 000<br />
0<br />
2008 2009 2010 2011Е 2012Е 2013Е 2014Е 2015Е 2020Е<br />
All vehicle types output, th.pieces<br />
<strong>Steel</strong> consumption by car-makers<br />
Source: boronextrication.com<br />
Source: WSA<br />
17
Entry to Rapidly Growing Turkish Market<br />
Locations of Key Markets<br />
Turkish Flat <strong>Steel</strong> Market Structure, %<br />
Europe<br />
Istanbul<br />
Boiler making;<br />
6%<br />
Other; 12%<br />
Pipe<br />
production;<br />
25%<br />
Priority export markets<br />
Important export markets<br />
Flat <strong>Steel</strong> Market in Turkey, mln tonnes<br />
14<br />
12<br />
10<br />
8<br />
6<br />
4<br />
2<br />
0<br />
-2<br />
-4<br />
-6<br />
4,0<br />
8,0<br />
5,5<br />
Source: Metal Expert<br />
8,6<br />
Africa<br />
6,8<br />
9,2<br />
Iskenderun<br />
9,9<br />
8,7<br />
Middle East<br />
<strong>MMK</strong> will focus on flat steel in<br />
Turkey, where there is a<br />
structural shortfall<br />
12,2<br />
11,3<br />
10,6<br />
9,2 9,2 9,2<br />
2009 2010E 2011E 2012E 2013E 2014E 2015E<br />
-1,2 -1,4<br />
-2,4<br />
-2,1<br />
-3,1<br />
-2,9<br />
-4,0<br />
Flat steel production Flat steel consumption Balance<br />
Source: ING<br />
Packaging; 7%<br />
Auto industry;<br />
13%<br />
Long <strong>Steel</strong> Market in Turkey, mln tonnes<br />
30<br />
25<br />
20<br />
15<br />
10<br />
5<br />
0<br />
20,5<br />
24,0 24,5 24,9<br />
Spot sales;<br />
18%<br />
Metal Service<br />
Centers; 19%<br />
25,7 25,7 25,7<br />
12,5<br />
13,8 13,7 13,6 13,8 13,2<br />
13,2<br />
9,7 10,2 10,7 11,3 11,9<br />
12,5<br />
10,8<br />
2009 2010E 2011E 2012E 2013E 2014E 2015E<br />
Long steel production Long steel consumption Balance<br />
Source: Metal Expert<br />
18
Financials<br />
IFRS Summary<br />
Financial Highlights, USD mln<br />
Q1 2011 2010 2009 2008<br />
12 000<br />
10 550<br />
Crude steel output, kt 3,092 11,419 9,618 11,957<br />
Finished steel, kt 2,707 10,245 8,764 10,911<br />
10 000<br />
8 000<br />
8 197<br />
7 719<br />
Revenues, $ mln 2,216 7,719 5,081 10,550<br />
6 000<br />
5 081<br />
EBITDA, $ mln 403 1,606 1,309 2,204<br />
EBITDA margin, % 18.2% 20.8% 25.8% 20.9%<br />
Net profit, $ mln 134 232 219 1,081<br />
Net margin, % 6.0% 3.0% 4,3% 10.2%<br />
Assets, $ mln 18,082 16,738 14,833 14,197<br />
Credit & loans, $ mln 3,951 3,548 2,118 1,726<br />
short-term* 1,498 1,087 828 1,295<br />
long-term* 2,453 2,461 1,290 431<br />
Shareholder capital, $ mln 10,953 10,257 9,957 9,663<br />
Cash, $ mln 460 515 165 1,106<br />
* includes leasing<br />
Source: <strong>MMK</strong> 2006-2007 financials under US GAAP, from 2008 – under IFRS<br />
<strong>MMK</strong> credit ratings<br />
BB+, outlook Stable<br />
(changed from BB on May 19, 2011)<br />
Ba3, outlook positive<br />
(outlook changed from “stable” on July 22, 2010)<br />
4 000<br />
2 000<br />
0<br />
Source: <strong>MMK</strong><br />
Financial Highlights, USD mln<br />
2 300<br />
1 800<br />
1 300<br />
800<br />
300<br />
-200<br />
965<br />
100<br />
Source: <strong>MMK</strong><br />
2 407 2 204<br />
1 306<br />
1 081<br />
1 309 1 606<br />
219 232<br />
2007 2008 2009 2010<br />
Revenues EBITDA Net profit<br />
1 038<br />
1 404<br />
319<br />
213<br />
34 76<br />
1 674 1 652<br />
677<br />
219<br />
374<br />
2 068 2 055<br />
1 944<br />
2216<br />
437 388 407 403<br />
94 53 43 42<br />
-110<br />
1Q09 2Q09 3Q09 4Q09 1Q10 2Q10 3Q10 4Q10 1Q11<br />
Revenues EBITDA Net profit<br />
134<br />
19
Investment Highlights<br />
• Key beneficiary of steel market recovery – production growth currently planned at 70% by 2017,<br />
>45% by 2013<br />
• Growing volumes and share of HVA products (45% by 2013) to secure sustainably high efficiency<br />
• Focus on specialty steel products to replace imports in Russia and to capture domestic market price<br />
premium<br />
• Access to lucrative Turkish flat steel market with high-quality steel products<br />
• Emphasized direct exposure to growing industry sectors in the domestic market – pipe-building,<br />
automotive and heavy machinery industries<br />
• Technological flexibility to address raw-material market fluctuations – crude steel production using<br />
iron ore/coking coal vs. scrap<br />
• Strong balance sheet well-positioned to finance further growth<br />
• Plans for further strengthening in commodities<br />
20
<strong>Magnitogorsk</strong> <strong>Steel</strong> (<strong>MMK</strong>)
<strong>MMK</strong> Group Cost of Sales Breakdown and CAPEX Programme<br />
Cost of Sales Q1 2011, m USD Flexible CAPEX Programme till 2015<br />
2000<br />
1500<br />
Others; 92<br />
Amortisation; 215<br />
Labour costs; 211<br />
2 000<br />
1 500<br />
1000<br />
500<br />
0<br />
-500<br />
Sourсe: <strong>MMK</strong><br />
Other Group<br />
Companies<br />
material costs ;<br />
-237<br />
Change in<br />
uninvoiced<br />
products balance;<br />
-98<br />
<strong>MMK</strong> material<br />
costs; 1 593<br />
<strong>MMK</strong> Q1 2011 Material Costs Breakdown, %<br />
1<br />
Total: USD 1,775 m<br />
1 000<br />
500<br />
0<br />
2010 2011 2012 2013 2014 2015<br />
maintanance downstream processing volume growth<br />
cost-saving Belon coal <strong>MMK</strong> Turkey<br />
Other subsidiaries<br />
Sourсe: <strong>MMK</strong><br />
Hot Rolling Mill #10<br />
Auxilary<br />
materials<br />
8%<br />
Power<br />
3%<br />
Fuel<br />
8%<br />
Sinter<br />
14%<br />
Pellets<br />
15%<br />
Sourсe: <strong>MMK</strong><br />
Other main<br />
materials<br />
14%<br />
Scrap<br />
14%<br />
Coals<br />
24%<br />
22
Coking Coal Price Change<br />
Competitive Cost Position<br />
Slab Cash-cost and Raw-material Price, USD/tonne<br />
Slab Cash-Cost Sensitivity, Q1 2011, USD/tonne<br />
400<br />
300<br />
287<br />
323<br />
362 362<br />
450<br />
200<br />
180<br />
160<br />
140<br />
<strong>Iron</strong> Ore Price Change<br />
-30% -20% -10% 0% 10% 20% 30% 40%<br />
-20% 393 407 422 436 451 465 480 495<br />
200<br />
120<br />
-10% 399 414 428 443 457 472 487 501<br />
100<br />
0<br />
60<br />
Q1 10 Q2 10<br />
Slab Cash-cost<br />
Q3 10<br />
Scrap<br />
Q4 10 Q1 11<br />
<strong>Iron</strong> ore (RHS)<br />
Pellets (RHS)<br />
Coal (RHS)<br />
100<br />
80<br />
0% 406 420 435 450 464 479 493 508<br />
10% 413 427 442 456 471 485 500 515<br />
20% 419 434 448 463 478 492 507 521<br />
30% 426 440 455 470 484 499 513 528<br />
Sourсe: <strong>MMK</strong><br />
* - Q1 2011 slab cash-cost<br />
Galvanizing line Slab Cash-Cost Structure, 1Q 2011, %<br />
Wages; 3%<br />
Others; 2%<br />
<strong>Iron</strong> ore; 36%<br />
Fuel and<br />
energy<br />
purchased; 8%<br />
Other raw<br />
materials; 16%<br />
Scrap<br />
purchased; 8%<br />
Coal; 27%<br />
Cash cost: 450 USD/t<br />
Sourсe: <strong>MMK</strong><br />
23
<strong>MMK</strong> Group Debt<br />
<strong>MMK</strong> Debt Structure by Maturity, USD mln Debt Structure by Currency, Q1 2011<br />
4 000<br />
3 500<br />
3 000<br />
2 500<br />
2 000<br />
1 500<br />
1 000<br />
500<br />
0<br />
<strong>MMK</strong> improved its debt structure with shortterm<br />
debt at 38% only<br />
431 1 290<br />
1 295<br />
828<br />
2 461<br />
1 087<br />
2 453<br />
1 498<br />
2008 2009 2010 Q1 2011<br />
Short-term debt<br />
Long-term debt<br />
RUR<br />
32%<br />
Source: <strong>MMK</strong> Source: <strong>MMK</strong>, as of April 1, 2011<br />
Euro<br />
26%<br />
USD<br />
42%<br />
3,951 m USD<br />
Debt Structure by Interest Rate, Q1 2011<br />
Maturity of <strong>MMK</strong> Long-term Borrowings, USD mln<br />
1250<br />
1236<br />
1000<br />
Fixed<br />
53%<br />
750<br />
594<br />
763<br />
778<br />
Floating<br />
47%<br />
500<br />
250<br />
312<br />
3,951 m USD<br />
0<br />
2011 2012 2013 2014 2015 and after<br />
Source: <strong>MMK</strong>, as of April 1, 2011<br />
Source: <strong>MMK</strong>, as of April 1, 2011<br />
24
Iskenderun Istanbul<br />
Schedule of <strong>MMK</strong> Project in Turkey and Construction Costs<br />
Project highlights<br />
• Main production site – near Iskenderun (2.3 tpa)<br />
• 2 service centres: Iskenderun, Istanbul<br />
• Product types: HRC, galvanized & colour-coated steel<br />
• Start of production – 2010<br />
• Ramp up to reach full capacity – 2012<br />
• Cost of Project – USD 2.1 bn<br />
2 500<br />
2 000<br />
1 500<br />
1 000<br />
500<br />
0<br />
2 282<br />
686<br />
68<br />
156<br />
2009 2010 2011Е 2012Е<br />
Flat hot-rolled products Galvinized steel Colour-coated steel<br />
Start-up schedule<br />
• Color-coating line<br />
• Galvanizing line<br />
• Establishment<br />
• Metal service center<br />
• Metals service center<br />
• Mill for hot rolled coil<br />
• Etching line<br />
• Reverse mill<br />
• Hot galvanizing line<br />
• Polymer coating line<br />
• <strong>Steel</strong> making facilities<br />
2007 2008 2009 2010 2011E 2012E<br />
USD 100 mln USD 195 mln USD 242 mln USD 565 mln USD 113 mln<br />
Total construction expenses: USD 1,215 mln<br />
Source: <strong>MMK</strong> estimates<br />
25
Contacts<br />
<strong>MMK</strong> (<strong>Magnitogorsk</strong> <strong>Iron</strong> & <strong>Steel</strong> works)<br />
Ordinary shares listed at MICEX and RTS in June 2006.<br />
GDRs listed at LSE in April 2007<br />
ISIN / СUSIP US5591892048/559189105<br />
Tickers<br />
MICEX, RTS: MAGN<br />
LSE: <strong>MMK</strong><br />
Bloomberg: <strong>MMK</strong>:LI<br />
Contacts at <strong>MMK</strong><br />
Andrey Serov Head of IR<br />
Tel +7 (3519) 24 52 97 serov.ae@mmk.ru<br />
www.mmk.ru<br />
GDR Depositary - BNY Mellon<br />
Contact person at the depositary<br />
Ludmila Leliavskaia<br />
Vice President<br />
Tel +1.212.815.4493<br />
ludmila.leliavskaia@bnymellon.com<br />
Disclaimer<br />
THIS PRESENTATION IS FOR INFORMATION ONLY.<br />
•THIS PRESENTATION IS FOR DISTRIBUTION IN UK ONLY AMONG THE PEOPLE HAVING PROFESSIONAL SKILL IN THE ISSUES RELATED TO INVESTMENTS WITHIN THE MEANING OF ARTICLE 19(5) OF DIRECTIVE ON FINANCIAL ADVERTISEMENT APPROVED IN 2005 ON THE BASIS OF LAW<br />
ON FINANCIAL SERVICES AND MARKETS 2000, OR THOSE PEOPLE, AMONG WHICH IT MAY BE LAWFULLY DISTRIBUTED. THIS INFORMATION IS CONFIDENTIAL AND PROVIDED TO YOU EXCLUSIVELY FOR YOUR REFERENCE. BY ACCEPTANCE OF THIS INFORMATION THE RECIPIENT<br />
HEREOF CONFIRMS THAT HE OR SHE IS A SPECIALIST IN THE SPHERE OF INVESTMENTS WITHIN THE MEANING OF ARTICLE 19(5) OF DIRECTIVE ON FINANCIAL ADVERTISEMENT APPROVED IN 2005 ON THE BASIS OF LAW ON FINANCIAL SERVICES AND MARKETS 2000, ACTING IN HIS OR<br />
HER NATURE.<br />
•THIS PRESENTATION DOES NOT CONSTITUTE AN OFFER OR A PART THEREOF, OR INVITATION TO SELL OR TO ISSUE, OR TO SUBSCRIBE FOR OR OTHERWISE PURCHASE ANY SHARES IN THE COMPANY OR ANY OTHER SECURITIES AND NOTHING CONTAINED HEREIN SHALL FORM<br />
THE BASIS OF ANY CONTRACT OR COMMITMENT WHATSOEVER.<br />
•THE INFORMATION CONTAINED HEREIN IS SUBJECT TO VERIFICATION, COMPLETION AND MAY BE SIGNIFICANTLY CHANGED. NONE OF THE PERSONS IS LIABLE TO UPDATE OR MAINTAIN TOPICALITY OF THE INFORMATION CONTAINED HEREIN, AND THIS INFORMATION AND OPINIONS<br />
REFLECTED THEREIN COULD BE CHANGED WITHOUT ANY NOTIFICATION THEREABOUT.<br />
•THIS PRESENTATION SHOULD REMAIN CONFIDENTIAL UNTIL THE REPORT IS PUBLISHED. SOME INFORMATION CONTAINED HEREIN IS STILL A DRAFT INFORMATION AND WAS NOT LEGALLY CONFIRMED AND WILL BE FINALY DETERMINED ONLY AT THE MOMENT OF FILING THE<br />
APPLICATION FOR FINAL ACCEPTANCE FOR TRADING AT THE STOCK EXCHANGE.<br />
•THIS INFORMATION DOES NOT CONSTITUTE AN OFFER OF THE SECURITIES TO BE SOLD IN RUSSIA, THE UNITED STATES OR ANY OTHER JURISDICTION. THE SECURITIES HAVE NOT BEEN AND WILL NOT BE REGISTERED UNDER THE US SECURITIES ACT OF 1933,AS AMENDED, AND<br />
MAY NOT BE OFFERED OR SOLD INTO THE UNITED STATES EXCEPT IN A TRANSACTION REGISTERED UNDER SUCH ACT, OR NOT REQUIRED TO BE REGISTERED THERE UNDER, OR PURSUANT TO AND EXEMPTION FROM REGISTRATION REQUIREMENTS THEREOF. NO OFFERING OF<br />
SECURITIES IS BEING MADE INTO THE UNITED STATES. NO SECURITIES WILL BE REGISTERED UNDER THE APPLICABLE SECURITIES ACT OF ANY STATE OR TERRITORIAL ENTITY OF CANADA AND JAPAN. THIS PRESENTATION IS NOT SUBJECT TO MAILING, TRANSFERRING OR OTHER<br />
TYPE OF DISTRIBUTION IN THE UNITED STATES OF AMERICA, CANADA, AUSTRALIA AND JAPAN, OR TO THE TERRITORY OR FROM THE TERRITORY OF THE SPECIFIED COUNTRIES TO THE NAME OF ANY ANALYST IN THE SPHERE OF SECURITIES OR OTHER PERSON IN ANY OF THE<br />
SPECIFIED JURISDICTIONS. YOU AGREE TO AVOID FROM DISTRIBUTION OF ANY REPORT RESULTING FROM THE SURVEY OR SIMILAR DOCUMENTS ON THE TERRITORY OF THE UNITED STATES OF AMERICA, CANADA, AUSTRALIA AND JAPAN, SAVE AS IN ACCORDANCE WITH THE<br />
FEDERAL LAWS OF THE UNITED STATES ON SECURITIES INCLUDING SECURITIES ACT, AS WELL AS THE APPLICABLE LAWS OF CANADA, AUSTRALIA AND JAPAN, ACCORDINGLY.<br />
•THIS PRESENTATION INCLUDES THE STATEMENTS RELATED TO THE FUTURE, WHICH REPRODUCE THE INTENTIONS, OPINIONS AND CURRENT EXPECTATIONS OF THE COMPANY. THE STATEMENTS FOR THE FUTURE INCLUDE ANYTHING, WHICH IS NOT A FACT OCCURED. THE<br />
COMPANY TRIED TO HIGHLIGHT SUCH STATEMENTS RELATED TO THE FUTURE BY MEANS OF THE WORDS, SUCH AS “MAY”, “WILL”, “SHOULD”, “EXPECT”, “INTEND”, “EVALUATE”, “ASSUME”, “PLAN”, “TO HAVE AN OPINION”, “TRY”, “FORECAST”, “CONTINUE” AND SIMILAR WORDS OR THEIR<br />
NEGATIVE FORMS. SUCH STATEMENTS HAD BEEN DONE BASING ON THE ASSUMPTIONS AND ASSESSMENTS, WHICH MAY OCCUR FAULTY, THOUGH THE COMPANY CONSIDERS THEM REASONABLE AT THE CURRENT MOMENT.<br />
•SUCH STATEMENTS RELATED TO THE FUTURE ARE LINKED TO THE RISKS, UNCERTAINTIES AND ASSUMPTIONS, AS WELL AS TO OTHER FACTORS, WHICH MAY LEAD TO THE EVENT THAT ACTUAL RESULTS OF THE COMPANY’S ACTIVITY AND ACTIVITY OF THE MARKETS, ON WHICH IT<br />
OPERATES OR INTENDS TO OPERATE IN, THEIR FINANCIAL STATUS, LIQUIDITY, CHARACTERISTICS, PROSPECTS AND ABILITIES COUILD MATERIALLY DIFFER FROM THOSE, WHICH ARE EXPRESSED WITH THE HELP OF SUCH STATEMENTS RELATED TO THE FUTURE. THE IMPORTANT<br />
FACTORS, WHICH MAY RESULT IN SUCH DIFFERENCES, INCLUDE, INTER ALIA, CHANGING BUSINESS CONDITIONS AND OTHER MARKET CONDITIONS, COMMON ECONOMIC CONDITIONS IN RUSSIA, EU COUNTRIES, THE UNITED STATES OF AMERICA OR ANYWHERE ELSE, AS WELL AS<br />
THE ABILITY OF THE COMPANY TO MEET THE TRENDS IN THE INDUSTRY. THE MATERIAL DIFFERENCE OF THE ACTUAL RESULTS, FEATURES AND ACHIEVEMENTS MAY BE THE RESULT OF ADDITIONAL FACTORS. THE COMPANY AND ALL ITS DIRECTORS, OFFICERS, EMPLOYEES AND<br />
ADVISORS HEREWITH STATE THAT THEY ARE NOT OBLIGED TO ISSUE ANY UPDATE OF OR REVISE ANY STATEMENTS RELATED TO THE FUTURE CONTAINED HEREIN, OR DISCLOSE ANY CHANGES IN THE FORECASTS OF THE COMPANY OR EVENTS, CONDITIONS AND<br />
CIRCUMSTANCES, WHICH SUCH STATEMENTS RELATED TO THE FUTURE ARE BASED ON, SAVE AS IN THE CASES PROVIDED FOR BY THE APPLICABLE LAWS.<br />
•RECEIPT OF ANY COPY OF THIS INFORMATION TESTIFIES THE ACCEPTANCE OF THE ABOVE LIMITATIONS.<br />
26