MMK Presentation: Organic Growth Strategy - Magnitogorsk Iron ...
MMK Presentation: Organic Growth Strategy - Magnitogorsk Iron ...
MMK Presentation: Organic Growth Strategy - Magnitogorsk Iron ...

Create successful ePaper yourself
Turn your PDF publications into a flip-book with our unique Google optimized e-Paper software.
<strong>Organic</strong> <strong>Growth</strong><br />
<strong>Strategy</strong><br />
June 2008
‘000 tons<br />
12 000<br />
9 000<br />
6 000<br />
3 000<br />
Moscow<br />
0<br />
5 863<br />
843<br />
897<br />
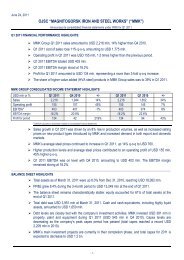
<strong>MMK</strong> at a Glance<br />
Geographic Location Financial & Operational Indicators - <strong>MMK</strong> Group<br />
<strong>Growth</strong> of the Steel Products Output<br />
10 137<br />
1647<br />
CAGR 6.9%<br />
10 201<br />
1542<br />
1331 1698<br />
5262 5438<br />
1579<br />
1634<br />
6095<br />
1483<br />
1563<br />
6391<br />
2521<br />
1043<br />
559<br />
1174<br />
722<br />
1098<br />
425<br />
1707<br />
332<br />
1788<br />
976<br />
1996 2004 2005 2006 2007<br />
Slabs and billets Long products HRC CRC Downstream<br />
Source: ММК<br />
<strong>MMK</strong><br />
SSGPO<br />
Kazakhstan<br />
Suppliers from Kuznetsk Coal<br />
Basin<br />
11 346<br />
12 203<br />
Steel produced, mt 13,3<br />
(1) 11,3 11,4 12,5 6,4<br />
Steel products output, mt 12,2<br />
(1) 10,1 10,2 11,3 8,0<br />
Revenue, US$ mln 4 829 5 380 6 424 8 197 27,6<br />
EBITDA, US$ mln 1 735 1 511 2 005 2 342 16,8<br />
EBITDA margin, % 35,9 28,1 31,2<br />
Net income margin,%<br />
Comprehensive income, US$ mln<br />
Source: US GAAP accounting statements<br />
1.Only <strong>MMK</strong>’s steel production and the steel products output<br />
Mintha<br />
Holding<br />
Limited (2)<br />
2004 2005 2006 2007 %, 06/07<br />
Net income, US$ mln. 1 232 947 1 426 1 772 24,3<br />
25,5<br />
1 232<br />
Share Equity Structure (1)<br />
Fulnek<br />
Enterprises<br />
Limited (2)<br />
1 444<br />
2 368<br />
Earnings per share, US$ 0,125 0,095 0,140 0,164 17,1<br />
46.26% 41.01% 12.73%<br />
Free-float<br />
1. Data upon register closing as of 07.03.2008<br />
2. Mr.V.F.Rashnikov, Chairman of the Board of Directors, <strong>MMK</strong>, is the beneficiary owner of <strong>MMK</strong>’s<br />
ordinary shares, which belongs to Mintha Holding Limited and Fulnek Enterprises Limited.<br />
17,6<br />
947<br />
22,2<br />
28,6<br />
21,6<br />
64,0<br />
1
Key Investment Factors<br />
Target investments<br />
to boost profitability<br />
Experienced<br />
Management<br />
Broad Product Mix<br />
Competitive Edge in<br />
Costs<br />
Strong Positions on<br />
the Fast Growing<br />
Russian Market<br />
Footprint on<br />
Promising Export<br />
Markets<br />
2
Broad Product Mix<br />
<strong>MMK</strong> is the largest producer of steel and rolled products in Russia<br />
<strong>MMK</strong> produces the broadest range of products in Russia, from slabs to downstream,<br />
high added value products<br />
Diversified product mix allows flexibility to respond to demand changes<br />
With main focus flat products, <strong>MMK</strong> commissioned in 2006 state-of-the-art facilities to<br />
produce of 2 mtpy of long products<br />
Product mix is evolving with focus on downstream high value added products<br />
“We view <strong>MMK</strong>’s competitive advantages as production excellence,<br />
supported by world-class facilities and a unique product mix with a<br />
high degree of high value-added products”<br />
Analyst of Credit Suisse<br />
3
Broad Product Mix<br />
Picture<br />
Picture<br />
Picture<br />
Picture<br />
Output of Main Products in 2007<br />
Hot rolled sheet<br />
6.39 m tons (52.4%)<br />
Cold rolled sheet<br />
1.56 m tons (12.8%)<br />
Long products<br />
1.79 m tons (14.7%)<br />
Downstream products<br />
1.49 m tons (12.2%)<br />
Billets and slabs<br />
0.98 m tons (8.0%)<br />
Leading Position in High Added Value Production<br />
Products<br />
HR flat products<br />
CR flat products<br />
Galvanized flat products<br />
CR narrow strip<br />
Tinplate<br />
Special sections<br />
Polymer (colour) coated rolled<br />
products<br />
Source: <strong>MMK</strong>, Chermet<br />
<strong>MMK</strong>’s share in<br />
Russia’s total<br />
42%<br />
35%<br />
24%<br />
53%<br />
100%<br />
54%<br />
23%<br />
% of <strong>MMK</strong>’s<br />
production<br />
52%<br />
13%<br />
3%<br />
3%<br />
2%<br />
2%<br />
1%<br />
Market<br />
position<br />
1<br />
2<br />
2<br />
1<br />
1<br />
1<br />
3<br />
4
Strong Positions on the Russian Market<br />
<strong>MMK</strong>’s geographic position is the key factor to determine its orientation towards<br />
satisfying the demand of the fast growing Russian market<br />
<strong>MMK</strong> is strategically placed in the highest steel consumption region of Russia<br />
The share of domestic sales is constantly growing and will reach at least 65%<br />
The product mix will allow <strong>MMK</strong> to meet the demand of Russia’s various industrial<br />
sectors<br />
The Russian market absorbs all of <strong>MMK</strong>’s long products and downstream products<br />
The entire gain in production level due to modernization (apprx.3 m tons) will be shipped<br />
to the domestic market<br />
“Thanks to its diversified product mix, <strong>MMK</strong> is exposed to all of the<br />
domestic market’s major segments.. <strong>MMK</strong> also enjoys strong links to the<br />
construction market, which accounts for over 20% of its domestic sales,<br />
as well as the mechanical engineering and automotive industries, which<br />
we think could come alive in the future”<br />
Analyst of Troika Dialog<br />
5
Automotive<br />
10,11%<br />
Food<br />
2,60%<br />
Metalware producers<br />
16,25%<br />
ММК: Domestic Market Trends<br />
Goal and <strong>Strategy</strong> of Domestic Sales<br />
• Building a network of metal service centers<br />
• Growing shipments to large consumers<br />
• Vertical integration with steel products<br />
consumers<br />
• Increasing share of downstream products in<br />
the product mix<br />
<strong>MMK</strong> Shipments breakdown by Industries, 2007<br />
Machine building<br />
16,87%<br />
Construction<br />
4,05%<br />
Power and f uel<br />
0,95%<br />
Bridge building<br />
0,44%<br />
Spot market<br />
29,02% (1)<br />
Pipe production<br />
19,71%<br />
Source: <strong>MMK</strong><br />
1. Up to 60% of spot market’s products in used in the construction sector<br />
Growing demand from<br />
pipe manufacturers<br />
Construction industry<br />
growth<br />
Expected growth of<br />
demand from other<br />
industries<br />
Increased consumption<br />
of downstream<br />
products<br />
100<br />
6000<br />
4000<br />
2000<br />
80<br />
60<br />
40<br />
20<br />
0<br />
0<br />
6000<br />
4000<br />
2000<br />
0<br />
2329<br />
1612<br />
Source: ТМК Forecast<br />
36,5<br />
3017<br />
2052<br />
41,9<br />
3449<br />
2531 2550<br />
47,3<br />
53,2<br />
59,5<br />
614 1 020<br />
1 650<br />
2 257<br />
2 879<br />
3 551<br />
4 238<br />
4 926<br />
832 752 756 736 729 719 703 676<br />
2005 2006 2007 2008 2009 2010 2011 2012<br />
Russian Foreign<br />
• High economic growth rates in Russia<br />
• Goods with highest value added are sold in the<br />
Russian market<br />
• Growing demand for high quality galvanized and<br />
polymer coated rolled products<br />
67,6<br />
2005<br />
Source: RenCap<br />
2006 2007 2008 2009 2010<br />
Source: Avtostat<br />
Russian Oil & Gas Pipe Consumption, th.t<br />
CAGR 8,8%<br />
2005 2006 2007F 2008F 2009F 2010F<br />
3550<br />
Large diameter pipes Others<br />
CAGR 21,3%<br />
3600<br />
2100<br />
Real Estate Construction Volume, min m<br />
CAGR 13,1%<br />
Car Consumption in Russia, th. units<br />
2<br />
3700<br />
2300<br />
6
% of supplies, tons<br />
Long Products<br />
24,2%<br />
Dow nstream<br />
17,3%<br />
Source: <strong>MMK</strong>, data on ОАО ММК<br />
1. Domestic market includes Russia and CIS<br />
% of supplies, tons<br />
Dow nstream<br />
4,5%<br />
Source: ММК<br />
Sales Structure<br />
Domestic Market, 2007<br />
Slabs and<br />
Billets<br />
20,0%<br />
CRC<br />
13,9%<br />
CRC<br />
12,1%<br />
Export, 2007<br />
Long Products<br />
0,2%<br />
HRC<br />
46,4%<br />
HRC<br />
61,3%<br />
(1)<br />
Total: 7,327 kt<br />
Total: 4,876 kt<br />
’000 tons<br />
1 200<br />
1 000<br />
800<br />
600<br />
400<br />
200<br />
0<br />
100%<br />
50%<br />
0%<br />
<strong>Growth</strong> of Downstream Products Sales<br />
in Russia and CIS, 2002-2007<br />
158<br />
56<br />
150<br />
133<br />
1,122<br />
73<br />
51<br />
230 178 209<br />
135<br />
1,219<br />
79<br />
422 438 426<br />
197 209 229 218<br />
51% 50% 46% 40%<br />
49% 50% 54%<br />
129 161<br />
2002 2004 2006 2007<br />
Tinplate Galvanized Flat Products Steel Strip Formed Sections Colour coated flat products Other<br />
Source: <strong>MMK</strong><br />
Source: <strong>MMK</strong><br />
694<br />
<strong>Growth</strong> of Domestic Sales in Physical Terms<br />
60%<br />
2004 2005 2006 2007<br />
166<br />
Domestic Market Export<br />
1,266<br />
74<br />
179<br />
7
Footprint on Promising Export Markets<br />
“(ММК) is ideally positioned for work on the growing markets of Russia and the<br />
Middle East. <strong>MMK</strong>’s strong focus on the Middle East promises good income<br />
from presence in yet another growth market”<br />
The Company efficiently manages its export sales flow<br />
Analyst of Morgan Stanley<br />
<strong>MMK</strong> key markets are the fast growing markets of the Middle East, Asia and Far East<br />
<strong>MMK</strong> expands its presence on the most promising markets by building greenfield steel plants<br />
and steel service centres<br />
8
Europe<br />
25,4%<br />
Goal and <strong>Strategy</strong> of International Sales<br />
Africa<br />
9,1%<br />
North<br />
America<br />
2,2%<br />
Goal: Maintain Competitive Position on the International Market<br />
– Export shipments of 4.5 m tons from the <strong>MMK</strong> site in <strong>Magnitogorsk</strong><br />
– <strong>MMK</strong>’s presence on the fast growing markets, including the Middle East, and advanced, traditionally<br />
high priced markets of the industrialized countries<br />
Export structure, 2007 Export structure, 2013<br />
Other<br />
0,9%<br />
Asia and<br />
Far East<br />
12,3%<br />
Middle<br />
East<br />
50,1%<br />
Africa<br />
6,8%<br />
Europe<br />
18,5%<br />
North<br />
America<br />
7,3%<br />
Other<br />
5,4%<br />
* Including shipments from the Turkey plant<br />
Asia and<br />
Far East<br />
7,2%<br />
Middle<br />
East*<br />
54,8%<br />
9
Access to the Fast Growing Turkish Market<br />
Location in Turkey Per capita steel consumption in 2006, kg<br />
Istanbul<br />
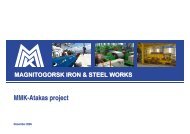
ММК – Atakas Project<br />
• Production capacity:<br />
Iskenderun<br />
- 2,300 ktpy of HR sheet<br />
- 750 ktpy of CR sheet<br />
- 900 ktpy of galvanized coils<br />
- 400 ktpy of polymer coated sheet<br />
• 2 service centres:<br />
-340 ktpy<br />
-340ktpy<br />
• Construction time: 3 years<br />
• IRR: 24,3%<br />
600<br />
400<br />
200<br />
0<br />
213<br />
257<br />
Turkey New EC members<br />
and candidates<br />
Consumption by product, kt<br />
12000<br />
9000<br />
6000<br />
3000<br />
0<br />
5 040<br />
5 500<br />
5 646<br />
2 028 2 213 2 271<br />
1148 1253 1286<br />
372 372<br />
543<br />
ЕС15 USA Japan<br />
8 245<br />
3 317<br />
Flat products production/consumption balance, kt<br />
1879<br />
11 667<br />
4 694<br />
2004 2005 2006 2010E 2015E<br />
* Exclusive of plate ** Exclusive of tinplate<br />
16,0<br />
12,0<br />
8,0<br />
4,0<br />
0,0<br />
-4,0<br />
-8,0<br />
9,2<br />
HR sheet* CR sheet Coated sheet**<br />
10,3<br />
4,7 4,7<br />
-4,5<br />
Source: Lehman Brothers report<br />
11,7<br />
5,3<br />
2004 2005 2006 2007E 2008E 2009E<br />
13,2<br />
5,9<br />
14,3<br />
-5,6<br />
-6,4<br />
-7,3<br />
-7,0<br />
Consumption Production Balance<br />
7,3<br />
15,5<br />
12,0<br />
2658<br />
-3,5<br />
10
<strong>Strategy</strong> in Raw Materials Supplies<br />
Secure in required raw materials in quantities fully meeting the needs<br />
Secure supplies and increased cost transparency in future<br />
11
Establishing long-term relations with key raw material suppliers<br />
Establishing long-term relations with key raw material suppliers securing the supplies<br />
and increase in level of production costs predictability:<br />
Currently the major part of <strong>MMK</strong>’s needs in raw materials is secured by long-term contracts:<br />
� <strong>Iron</strong> ore – up to 80% of <strong>MMK</strong>’s needs are secured by the contract for supply of prepared iron<br />
ore produced by SSGPO (Kazakhstan) till the year of 2017;<br />
� Coking coal – up to 80% of <strong>MMK</strong>’s needs are secured by the contracts with:<br />
• OOO Raspadsky Ugol, OOO Kuzmetugol till the year of 2011<br />
• ZAO Sibuglemet, OOO TD Mechel till the year of 2012<br />
• OAO Belon – 5-year contract is being discussed<br />
� Scrap – 100% of <strong>MMK</strong>’s needs are secured by the contract with ZAO Profit till the year of<br />
2011;<br />
� Natural gas – 100% of <strong>MMK</strong>’s needs are secured by the contracts with OAO Novatek till the<br />
year of 2015 and OOO Chelyabinskregiongaz till the year of 2012.<br />
12
Development of the own raw material base and self-sufficiency in iron<br />
ore<br />
Development of the local iron ore base – securing over 20% of needs in iron<br />
ore in 2008 and over 30% of the same by 2011 due to:<br />
� increase in production of iron ore within the <strong>Magnitogorsk</strong> and Bakal ore fields;<br />
� increase in processing of iron-containing production waste.<br />
Construction of Prioskolsky GOK in Belgorod region:<br />
� securing of up to 80% of the main production site’s needs in iron ore, along with<br />
the local iron ore base, following the implementation of the first stage of the<br />
project;<br />
� securing of up to 100% of the needs following the implementation of the second<br />
stage of the project.<br />
13
Development of Prioskol <strong>Iron</strong> Ore Deposit<br />
In November, 2006, <strong>MMK</strong> won a tender to develop Prioskol <strong>Iron</strong> Ore Deposit.<br />
In January of 2008 a branch of <strong>MMK</strong> in the Belgorod Region, “Prioskolsky GOK” was set up.<br />
An agreement was signed with TsentrGiproRuda to make the project.<br />
Deposit Characteristics Project Parameters<br />
The Prioskolsky Deposit is the largest deposit of rich iron<br />
ores and ferruginous quartzites in the Kursk Magnetic<br />
Anomaly (KMA).<br />
The deposit’s confirmed reserves comprise 45 m tons of<br />
rich ore (Fe-50,31 %) and<br />
2.1 bn tons of ferruginous quartzites (Fe-33,5 %)<br />
Project’s Strengths<br />
Production capacity: 35 mtpy of crude ore (1-st stage – up to<br />
25 mtpy)<br />
Commercial products (sinter ore, concentrate): 11,3 mtpy to<br />
2016<br />
Capex: USD 1.8 bn<br />
� The capacity of Prioskol Plant and reserves of the deposit can cover <strong>MMK</strong> requirement for iron ore materials for<br />
a period of over 60 years.<br />
� Convenient geographic location enabling it to be used for both supplies to <strong>MMK</strong>’s main site and foreign projects.<br />
� The possibility of products sales to third parties (including international consumers).<br />
� The deposit is ready for development.<br />
� <strong>Iron</strong>-containing minerals quality is high (up to 68.5% Fe in concentrate) and is suitable for DRI production<br />
14
100%<br />
80%<br />
60%<br />
40%<br />
20%<br />
0%<br />
m. tonnes<br />
Structure of provision with iron ore<br />
16,1<br />
Needs in iron ore<br />
17,0<br />
17,5 18,0 18,0<br />
Own raw materials share growth*<br />
22% 22% 26% 32% 40%<br />
44% 40% 35% 27% 18%<br />
35% 38% 39% 41% 42%<br />
19,9 19,9<br />
61%<br />
80% 82% 82%<br />
21%<br />
2%<br />
18% 18% 18% 18%<br />
2008 2009 2010 2011 2012 2013 2014 2015 2016<br />
Bought pellets Bought concentrate Own raw materials<br />
* - Calculation of the share of the own raw materials is based on the demand level, but not a production<br />
Source: The data provided by Strategic Planning Administration of OJSC <strong>MMK</strong><br />
19,8<br />
19,8<br />
15
Strategic Alliance of <strong>MMK</strong> and Belon<br />
In March 2008 ММК acquired 50% of ONARBAY ENTERPRISES LIMITED holding 82.6% of Belon for $230.4 mln<br />
Belon Group’s coal reserves - 446 mt<br />
Steam coal: 267 mt (60%)<br />
Coking coal: 179 mt (40%)<br />
Production in 2007 – 4.6 mt<br />
Investment program to raise scale and efficiency<br />
Belon Group<br />
�Production growth up to 10.8 mt by 2012.<br />
�x2.5 growth of coal concentrate production by<br />
2012 up to 10 mt<br />
�Discontinuance of coal purchases for beneficiation<br />
plants, thus boosting the company’s margins;<br />
�Compliance with current standards of industrial<br />
safety<br />
kt<br />
• Guaranteed supplies of required volumes of deficit coking coal grades<br />
• Improved composition of coal charge<br />
• Reduced consumption of coke (by 15.8 kg per ton of pig iron by 2010)<br />
• Annual costs savings in the Coke and Chemical and the Blast Furnace<br />
Divisions amounting to 35 - 40 mln US$<br />
14,00<br />
12,00<br />
10,00<br />
8,00<br />
6,00<br />
4,00<br />
2,00<br />
0,00<br />
9,48<br />
7,20<br />
<strong>MMK</strong>'s Requirement for Coking Coal Concentrate, mt<br />
0,58<br />
10,00<br />
10,30<br />
10,60<br />
7,50 7,30 7,40<br />
2,00<br />
3,70<br />
4,30<br />
11,00<br />
11,50<br />
7,50 7,40<br />
2007 2008f 2009f 2010f 2011f 2012f<br />
<strong>MMK</strong>'s pig iron production<br />
Coking coal concentrate requirement<br />
Transaction’s Upsides for <strong>MMK</strong><br />
Use of Belon's coking coal concentrate in the <strong>MMK</strong>'s Coke and Chemical Div ision (based on 55.8% in charge)<br />
Note: Improvement of <strong>MMK</strong> Blast Furnace Smelting Technology (Pulverized Coal Injection, installation of Paul Wurth<br />
bell-less top charging devices and use of stabilized sinter) will allow to reduce specific coke consumption by 2012.<br />
5,40<br />
5,70<br />
16
Integration with the existing coal producers<br />
Integration with the existing coal producers:<br />
� Establishment of the strategic alliance with OJSC Belon, a coal producer:<br />
- Securing up to 80% of needs in coal concentrate of required quality.<br />
� Development of ZAO Ugolnaya kompania Kazankovskaya (50% is owned by <strong>MMK</strong>):<br />
Supplementary exploration and development of the Kureinsky coal field.<br />
The license for the Kureinsky coal field (exploration work is being carried out in the coal field)<br />
Preliminary proven coal reserves amount to 425 m tonnes (K, KS, OS, TS grades of coal)<br />
* - The data exclude the implementation of powder coal system<br />
Consumption of coking coal concentrate, million tonnes*<br />
17
6000<br />
4000<br />
2000<br />
0<br />
Guarantied Sufficiency in Scrap<br />
� Incorporation of ZAO Profit into <strong>MMK</strong> Group<br />
� Development of ZAO Profit, expansion of company’s scrap-stocking network<br />
6<br />
4<br />
2<br />
0<br />
2411<br />
4,4 4,3 3,8 3,3<br />
3798<br />
5046<br />
5900<br />
854 1312 1017 1200<br />
2005 2006 2007 2008F*<br />
Othres ММК<br />
Scrap consumption structure, mln. t<br />
4,8 4,8 4,8 4,8 4,8<br />
1,5 1,5 1,7 1,8 1,9 1,9 1,9 1,9 1,9<br />
2008 2009 2010 2011 2012 2013 2014 2015 2016<br />
Source: Data of OAO <strong>MMK</strong> Strategic Planning Administration<br />
Recycle scrap (generated on <strong>MMK</strong> site Purchased scrap (supplies from ZAO Profit)<br />
Dynamics of scrap supply volumes of ZAO Profit, th. t<br />
Source: ZAO Profit<br />
* - forecast takes into account the reservation of <strong>MMK</strong> supplies share at the level of 2007 in total supply volume of ZAO Profit<br />
* - recycle scrap included<br />
Supply structure of ZAO Profit in 2007<br />
0,9%<br />
1,0%<br />
4,4%<br />
10,4%<br />
83,2%<br />
ММК* Evraz Severstal Urals Steel Others<br />
18
2007<br />
2,5%<br />
1,5%<br />
Raw Materials Provision<br />
11,1%<br />
5,2%<br />
79,8%<br />
SSGPO Michailovsky GOK Lebedinsky GOK<br />
Ow n Others<br />
Источник: <strong>MMK</strong><br />
20,0%<br />
15,4 mln. t<br />
0,4% 5,9%<br />
0,8%<br />
11,4%<br />
23,1%<br />
2008<br />
30,3%<br />
Supplies if iron Raw Materials<br />
Supplies of coal concentrate<br />
OAO Belon<br />
21,5%<br />
OOO Raspadsky ugol<br />
OOO Kuzmetugol<br />
OOO TD Mechel<br />
ZAO Sibuglemet<br />
ZAO UK Uzhkuzbasugol<br />
AO Mittal Steel Timertau<br />
ТОО company "COAL TRADE"<br />
Supplies of scrap<br />
Profit; 100%<br />
78,5%<br />
Imported Ow n<br />
* - growth of the share of own raw materials due to increasing the supplies from<br />
BMA and own mines, as well as metallurgical waste processing<br />
8,1% 7,2 mln. t<br />
2007 2012<br />
Self-sufficiency in iron ore, coal and scrap<br />
2007-2016<br />
16,1 mln. t<br />
23%<br />
2007 – 5,05 mln. t<br />
2016 – 6,7 mln. t<br />
2016<br />
82,3%<br />
77%<br />
Imported Ow n<br />
7,4 mln. t<br />
OAO Belon<br />
Others<br />
19,8 mln. t<br />
17,7%<br />
The volume of <strong>Iron</strong> ore materials of SSGPO production in the frames of curren<br />
contracts<br />
19
100%<br />
80%<br />
60%<br />
40%<br />
20%<br />
0%<br />
MW<br />
800<br />
600<br />
400<br />
200<br />
0<br />
Source: ММК<br />
Self-sufficiency in Electric Power and Gas<br />
642<br />
Balance of utilities consumption<br />
809<br />
705<br />
617 627 622<br />
2005 2006 2007<br />
Consumption Generation<br />
Sufficiency in electric power, 2007.<br />
23%<br />
77%<br />
Source: ММК, Deutsche Bank<br />
57% 60%<br />
43% 40%<br />
45%<br />
55%<br />
<strong>MMK</strong> Sev erstal NLMK Ev raz<br />
Captiv e power supplies External power supplies<br />
70<br />
60<br />
50<br />
40<br />
30<br />
20<br />
10<br />
0<br />
Comparison of cost of electric power generated<br />
by <strong>MMK</strong> with purchase price<br />
US$ / th. kW*h<br />
Source: ММК<br />
43,23<br />
160%<br />
16,6<br />
49,84<br />
153%<br />
19,68<br />
58,87<br />
2005 2006 2007<br />
Price of purchased electric pow er<br />
Cost of ow n electric pow er<br />
144%<br />
24,12<br />
Supplies of natural gas for ОАО ММК<br />
Novatek<br />
28%<br />
Chelyabinsk regiongas Novatek<br />
Chelyabins<br />
k regiongas<br />
72%<br />
20
Target investments to boost profitability<br />
<strong>MMK</strong> focuses its activity on steel making, investing in quality and technology<br />
The implementation of the investment programme will enhance <strong>MMK</strong>’s competitive ability<br />
in the long term<br />
The investment programme is perfectly balanced to reduce costs, maintain the existing<br />
capacity and diversify into new unique products<br />
The entire gain in production from <strong>MMK</strong>’s investment program (abt. 3 m tons) will consist<br />
of downstream high value added products for the growing Russian market<br />
“<strong>MMK</strong> shares offer a good combination of improving medium term returns,<br />
relative valuation upside and leading market position in the attractive<br />
segments of downstream domestic market”<br />
Analyst of Goldman Sachs<br />
21
Creating the most efficient steel production in Russia<br />
Crude steel Production<br />
Commercial Products Production<br />
13.3 Mtpy<br />
12.2 Mtpy<br />
Work under<br />
earlier contracts<br />
Plate Mill 5,000<br />
HDGL # 2<br />
14.1 Mtpy<br />
13.0 Mtpy<br />
•Start-up of HDGL 2<br />
with a capacity of<br />
450 ktpy<br />
•Increase of the<br />
2,000 HSM<br />
productivity by 500<br />
ktpy<br />
14.2 Mtpy<br />
13.2 Mtpy<br />
•5,000 Plate Mill to<br />
roll first plate<br />
•Galvanized steel<br />
production level<br />
raised to 850 ktpy<br />
•Start-up of CCL # 2<br />
2007 2008 2009 2010 2011 2012 2013<br />
Note:<br />
1. Expected capacity expansion based on management assessments according to <strong>MMK</strong>’s current Capex budget<br />
14.2 Mtpy<br />
13.2 Mtpy<br />
•Plate Mill 5,000 to<br />
reach design cap. of<br />
1.5 Mtpy<br />
•Colour coated<br />
products’ level to<br />
rise to 400 ktpy<br />
•Start-up of the new<br />
cold rolling shop<br />
(CRM)<br />
14.2 Mtpy<br />
13.2 Mtpy<br />
•Production at the<br />
new 2000CRM to<br />
reach 2 Mtpy<br />
• Production of cold<br />
rolled and<br />
galvanized steel for<br />
auto sector to reach<br />
1.1 Mtpy<br />
•450 ktpy HDGL (#3)<br />
to go on stream<br />
•Commercial<br />
galvanized steel<br />
production to reach<br />
1.35 Mtpy<br />
Increased Efficiency + Increased Capacity<br />
15.1 Mtpy<br />
14.0 Mtpy<br />
•Start-up of BOF<br />
converter # 4, with<br />
BOF production<br />
level to increase by<br />
1 Mtpy<br />
•Production level at<br />
2,500 HRM to go up<br />
to 5 Mtpy<br />
16.1 Mtpy<br />
15.0 Mtpy<br />
•Production in the BOF<br />
Shop to reach 12<br />
Mtpy<br />
•Production level at<br />
2,500 HRM to go up<br />
to 5.5 Mtpy<br />
US$816 m<br />
Planned Investments<br />
US$1 609 m US$1 871 m US$1 476 m US$493 m US$294 m US$186 m<br />
22
Key Projects: Plate Mill and Automotive CR Sheet<br />
Only 8 companies ( located in Germany, France and Japan)<br />
are able to produce plate with comparable characteristics<br />
PLATE PRODUCTION<br />
• Project completion time under SMS Demag contract: 32 months<br />
• Investments: USD 1.4 billion<br />
Contractual schedule:<br />
• Nov. 7, 2006: signing of the contract<br />
• Nov. 2007: foundation works<br />
• April 2008: construction of the building<br />
• July 2008: erection and installation<br />
• May 2009: functional tests<br />
• July 2009: rolling of the first plate<br />
5,000 MM Plate Mills: <strong>MMK</strong> vs Severstal<br />
Characteristics<br />
Year of start-up<br />
Capacity, mtpy<br />
Width, mm<br />
Thickness, mm<br />
Rolling force, kt<br />
Length, m<br />
Strength class<br />
<strong>MMK</strong> (1)<br />
2009<br />
1.5<br />
Up to 4800<br />
8-160<br />
12<br />
24<br />
Up to X120<br />
Severstal<br />
1989<br />
0.6<br />
Up to 4400<br />
12-300<br />
9<br />
18<br />
Up to X80<br />
Source: <strong>MMK</strong><br />
The implementation of the Project will allow to produce high<br />
quality auto body sheet meeting the requirements of the leading<br />
international auto makers (GM, Ford, Toyota, etc )<br />
Main Characteristics<br />
Capacity, kt<br />
Width, mm<br />
Thickness, mm<br />
Steel grades<br />
AUTO BODY SHEET PRODUCTION<br />
• On 13.07.07 a contract was signed with SMS Demag<br />
• Time for equipment manufacturing and installation: apprx 36 months<br />
• Capex: USD1.4 billion<br />
• Negotiations with major international banks re arrangement of<br />
financing for the delivery contract<br />
• Commissioning: scheduled for 2010, design capacity to be reached in<br />
2011<br />
Product unparalleled in Russia = Sales growth = Significant margin’s growth<br />
2000<br />
850-1880<br />
0.28 – 3.0<br />
HSLA, IF-HSS, BH, two-phase,<br />
multiphase, ТRIP<br />
23
th. t<br />
14 000<br />
12 000<br />
10 000<br />
* - in 2007 prices<br />
Higher profitability through organic growth<br />
EBITDA margin*<br />
12 203<br />
48%<br />
927<br />
221<br />
Galvanized<br />
products<br />
1029<br />
927<br />
861<br />
640<br />
2007 2013<br />
Production increase in 2013 compared to 2007<br />
40%<br />
42%<br />
High quality CR flat products<br />
2mtpa<br />
30%<br />
221<br />
Plate<br />
1.5 mtpa<br />
Change of current product mix through<br />
modernisation and new facilities commissioning<br />
387<br />
628<br />
Color-coated<br />
steel<br />
products<br />
15 000<br />
Reduction of commercial slab volume<br />
2 797<br />
24
thousand vehicles<br />
4000<br />
3000<br />
2000<br />
1000<br />
Intercos-IV Project<br />
Russian Foreign<br />
Home appliances market in Russia, 2005-11<br />
thousand pcs.<br />
6000<br />
4000<br />
2000<br />
0<br />
0<br />
2005<br />
2005<br />
2006<br />
2006<br />
2007E<br />
Source: Euromonitor, Forecasts of EIU<br />
Cars output in Russia, 2005-13<br />
2007E<br />
2008E<br />
2009E<br />
2008E<br />
2010E<br />
2009E<br />
ref rigirators washing machine<br />
2011E<br />
2010E<br />
2012E<br />
2011E<br />
2013E<br />
Russian brands import localization of f oreign companies production<br />
Source: Companies forecast, ASM-Holding, forecast of ING<br />
6000<br />
4000<br />
2000<br />
0<br />
Source: Avtostat<br />
CAGR - 8,4%<br />
Car Consumption in Russia, th. units<br />
CAGR 21,3%<br />
614 1 020<br />
1 650<br />
2 257<br />
2 879<br />
3 551<br />
4 238<br />
4 926<br />
832 752 756 736 729 719 703 676<br />
2005 2006 2007 2008 2009 2010 2011 2012<br />
CAGR : Refrigerators – 6%, Washing machines – 7,1%<br />
St. Petersburg<br />
Interkos -4<br />
Project location<br />
Project parameters<br />
Goal: Sales of up to 300 ktpy of <strong>MMK</strong> cold rolled and galvanized steel<br />
products in the North-West Region of Russia by means of creating<br />
production facilities for stamped and stamp-welded components for<br />
auto makers and white goods producers.<br />
1stage:Acquisition of a 75% stake in CJSC Intercos-IV for RUB 509<br />
m.<br />
2 stage: Construction of a steel service center and a stamping plant in<br />
Kolpino, Leningrad Region, designed to process up to 300 ktpy of cold<br />
rolled and galvanized products.<br />
Construction time is 2.5 years.<br />
25
Disclaimer<br />
THIS PRESENTATION IS FOR INFORMATION ONLY.<br />
THIS PRESENTATION IS FOR DISTRIBUTION IN UK ONLY AMONG THE PEOPLE HAVING PROFESSIONAL SKILL IN THE ISSUES RELATED TO INVESTMENTS WITHIN THE<br />
MEANING OF ARTICLE 19(5) OF DIRECTIVE ON FINANCIAL ADVERTISEMENT APPROVED IN 2005 ON THE BASIS OF LAW ON FINANCIAL SERVICES AND MARKETS<br />
2000, OR THOSE PEOPLE, AMONG WHICH IT MAY BE LAWFULLY DISTRIBUTED. THIS INFORMATION IS CONFIDENTIAL AND PROVIDED TO YOU EXCLUSIVELY FOR<br />
YOUR REFERENCE. BY ACCEPTANCE OF THIS INFORMATION THE RECIPIENT HEREOF CONFIRMS THAT HE OR SHE IS A SPECIALIST IN THE SPHERE OF<br />
INVESTMENTS WITHIN THE MEANING OF ARTICLE 19(5) OF DIRECTIVE ON FINANCIAL ADVERTISEMENT APPROVED IN 2005 ON THE BASIS OF LAW ON FINANCIAL<br />
SERVICES AND MARKETS 2000, ACTING IN HIS OR HER NATURE.<br />
THIS PRESENTATION DOES NOT CONSTITUTE AN OFFER OR A PART THEREOF, OR INVITATION TO SELL OR TO ISSUE, OR TO SUBSCRIBE FOR OR OTHERWISE<br />
PURCHASE ANY SHARES IN THE COMPANY OR ANY OTHER SECURITIES AND NOTHING CONTAINED HEREIN SHALL FORM THE BASIS OF ANY CONTRACT OR<br />
COMMITMENT WHATSOEVER.<br />
THE INFORMATION CONTAINED HEREIN IS SUBJECT TO VERIFICATION, COMPLETION AND MAY BE SIGNIFICANTLY CHANGED. NONE OF THE PERSONS IS LIABLE TO<br />
UPDATE OR MAINTAIN TOPICALITY OF THE INFORMATION CONTAINED HEREIN, AND THIS INFORMATION AND OPINIONS REFLECTED THEREIN COULD BE CHANGED<br />
WITHOUT ANY NOTIFICATION THEREABOUT.<br />
THIS PRESENTATION SHOULD REMAIN CONFIDENTIAL UNTIL THE REPORT IS PUBLISHED. SOME INFORMATION CONTAINED HEREIN IS STILL A DRAFT INFORMATION<br />
AND WAS NOT LEGALLY CONFIRMED AND WILL BE FINALY DETERMINED ONLY AT THE MOMENT OF FILING THE APPLICATION FOR FINAL ACCEPTANCE FOR<br />
TRADING AT THE STOCK EXCHANGE.<br />
THIS INFORMATION DOES NOT CONSTITUTE AN OFFER OF THE SECURITIES TO BE SOLD IN RUSSIA, THE UNITED STATES OR ANY OTHER JURISDICTION. THE<br />
SECURITIES HAVE NOT BEEN AND WILL NOT BE REGISTERED UNDER THE US SECURITIES ACT OF 1933,AS AMENDED, AND MAY NOT BE OFFERED OR SOLD INTO<br />
THE UNITED STATES EXCEPT IN A TRANSACTION REGISTERED UNDER SUCH ACT, OR NOT REQUIRED TO BE REGISTERED THERE UNDER, OR PURSUANT TO AND<br />
EXEMPTION FROM REGISTRATION REQUIREMENTS THEREOF. NO OFFERING OF SECURITIES IS BEING MADE INTO THE UNITED STATES. NO SECURITIES WILL BE<br />
REGISTERED UNDER THE APPLICABLE SECURITIES ACT OF ANY STATE OR TERRITORIAL ENTITY OF CANADA AND JAPAN. THIS PRESENTATION IS NOT SUBJECT TO<br />
MAILING, TRANSFERRING OR OTHER TYPE OF DISTRIBUTION IN THE UNITED STATES OF AMERICA, CANADA, AUSTRALIA AND JAPAN, OR TO THE TERRITORY OR<br />
FROM THE TERRITORY OF THE SPECIFIED COUNTRIES TO THE NAME OF ANY ANALYST IN THE SPHERE OF SECURITIES OR OTHER PERSON IN ANY OF THE<br />
SPECIFIED JURISDICTIONS. YOU AGREE TO AVOID FROM DISTRIBUTION OF ANY REPORT RESULTING FROM THE SURVEY OR SIMILAR DOCUMENTS ON THE<br />
TERRITORY OF THE UNITED STATES OF AMERICA, CANADA, AUSTRALIA AND JAPAN, SAVE AS IN ACCORDANCE WITH THE FEDERAL LAWS OF THE UNITED STATES<br />
ON SECURITIES INCLUDING SECURITIES ACT, AS WELL AS THE APPLICABLE LAWS OF CANADA, AUSTRALIA AND JAPAN, ACCORDINGLY.<br />
THIS PRESENTATION INCLUDES THE STATEMENTS RELATED TO THE FUTURE, WHICH REPRODUCE THE INTENTIONS, OPINIONS AND CURRENT EXPECTATIONS OF<br />
THE COMPANY. THE STATEMENTS FOR THE FUTURE INCLUDE ANYTHING, WHICH IS NOT A FACT OCCURED. THE COMPANY TRIED TO HIGHLIGHT SUCH<br />
STATEMENTS RELATED TO THE FUTURE BY MEANS OF THE WORDS, SUCH AS “MAY”, “WILL”, “SHOULD”, “EXPECT”, “INTEND”, “EVALUATE”, “ASSUME”, “PLAN”, “TO<br />
HAVE AN OPINION”, “TRY”, “FORECAST”, “CONTINUE” AND SIMILAR WORDS OR THEIR NEGATIVE FORMS. SUCH STATEMENTS HAD BEEN DONE BASING ON THE<br />
ASSUMPTIONS AND ASSESSMENTS, WHICH MAY OCCUR FAULTY, THOUGH THE COMPANY CONSIDERS THEM REASONABLE AT THE CURRENT MOMENT.<br />
SUCH STATEMENTS RELATED TO THE FUTURE ARE LINKED TO THE RISKS, UNCERTAINTIES AND ASSUMPTIONS, AS WELL AS TO OTHER FACTORS, WHICH MAY<br />
LEAD TO THE EVENT THAT ACTUAL RESULTS OF THE COMPANY’S ACTIVITY AND ACTIVITY OF THE MARKETS, ON WHICH IT OPERATES OR INTENDS TO OPERATE<br />
IN, THEIR FINANCIAL STATUS, LIQUIDITY, CHARACTERISTICS, PROSPECTS AND ABILITIES COUILD MATERIALLY DIFFER FROM THOSE, WHICH ARE EXPRESSED<br />
WITH THE HELP OF SUCH STATEMENTS RELATED TO THE FUTURE. THE IMPORTANT FACTORS, WHICH MAY RESULT IN SUCH DIFFERENCES, INCLUDE, INTER ALIA,<br />
CHANGING BUSINESS CONDITIONS AND OTHER MARKET CONDITIONS, COMMON ECONOMIC CONDITIONS IN RUSSIA, EU COUNTRIES, THE UNITED STATES OF<br />
AMERICA OR ANYWHERE ELSE, AS WELL AS THE ABILITY OF THE COMPANY TO MEET THE TRENDS IN THE INDUSTRY. THE MATERIAL DIFFERENCE OF THE ACTUAL<br />
RESULTS, FEATURES AND ACHIEVEMENTS MAY BE THE RESULT OF ADDITIONAL FACTORS. THE COMPANY AND ALL ITS DIRECTORS, OFFICERS, EMPLOYEES AND<br />
ADVISORS HEREWITH STATE THAT THEY ARE NOT OBLIGED TO ISSUE ANY UPDATE OF OR REVISE ANY STATEMENTS RELATED TO THE FUTURE CONTAINED<br />
HEREIN, OR DISCLOSE ANY CHANGES IN THE FORECASTS OF THE COMPANY OR EVENTS, CONDITIONS AND CIRCUMSTANCES, WHICH SUCH STATEMENTS<br />
RELATED TO THE FUTURE ARE BASED ON, SAVE AS IN THE CASES PROVIDED FOR BY THE APPLICABLE LAWS.<br />
RECEIPT OF ANY COPY OF THIS INFORMATION TESTIFIES THE ACCEPTANCE OF THE ABOVE LIMITATIONS.<br />
26
End of <strong>Presentation</strong>